[Preprint]. 2024 Apr 17:2024.04.15.589676.
doi: 10.1101/2024.04.15.589676.

PIP4K2C inhibition reverses autophagic flux impairment induced by SARS-CoV-2

Affiliations

PIP4K2C inhibition reverses autophagic flux impairment induced by SARS-CoV-2

Marwah Karim et al. bioRxiv. .

Update in

  • PIP4K2C inhibition reverses autophagic flux impairment induced by SARS-CoV-2.
    Karim M, Mishra M, Lo CW, Saul S, Cagirici HB, Gourdelier M, Ghita L, Ojha A, Tran DHN, Agrawal A, McGraw C, East MP, Gammeltoft KA, Sahoo MK, Mooney NA, Johnson GL, Das S, Leyssen P, Neyts J, Chiu W, Cohen CA, Bukh J, Gottwein J, Dye JM, Neff N, Jackson PK, Pinsky BA, Laitinen T, Pantsar T, Poso A, Zanini F, De Jonghe S, Asquith CRM, Einav S. Karim M, et al. Nat Commun. 2025 Jul 10;16(1):6397. doi: 10.1038/s41467-025-61759-1. Nat Commun. 2025. PMID: 40640184 Free PMC article.

Abstract

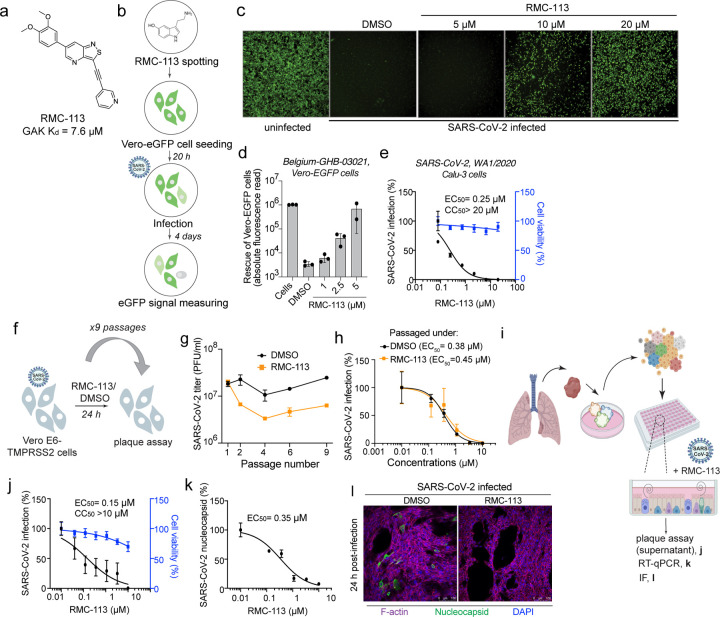
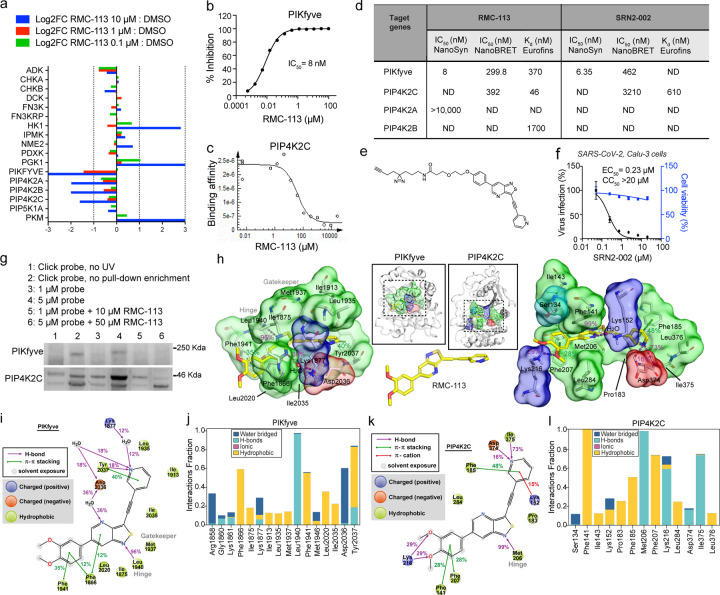
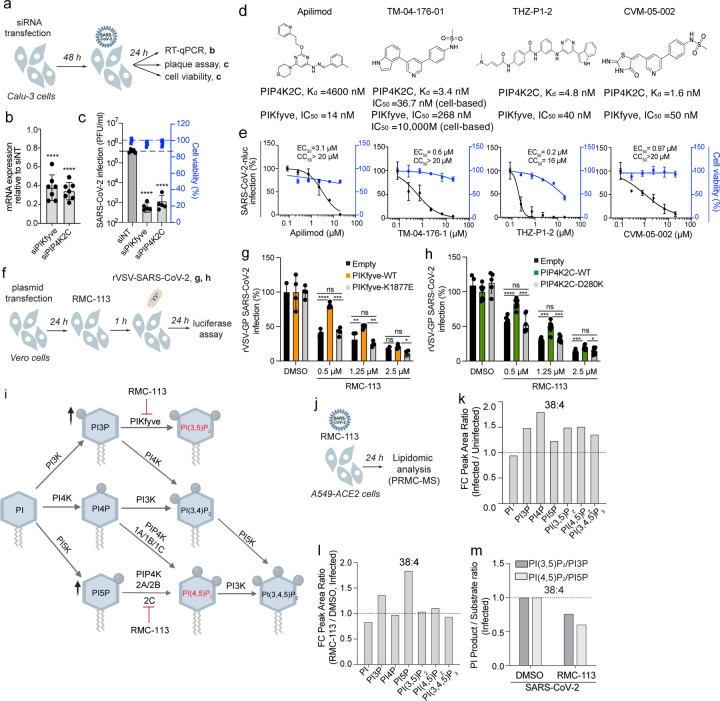
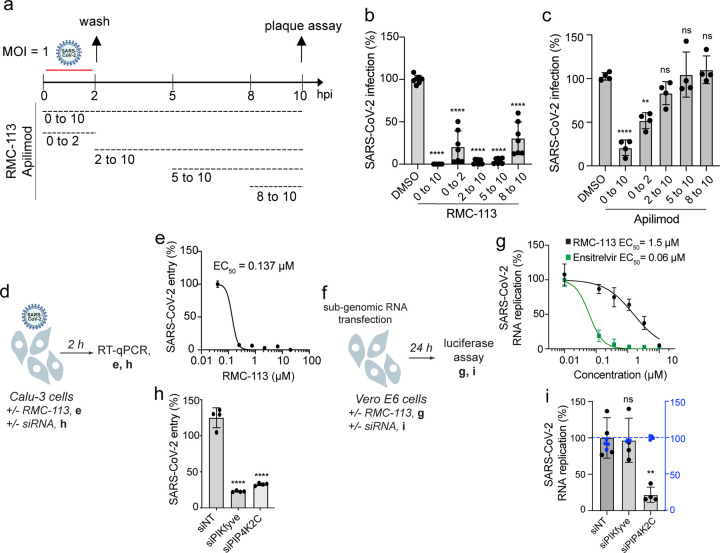
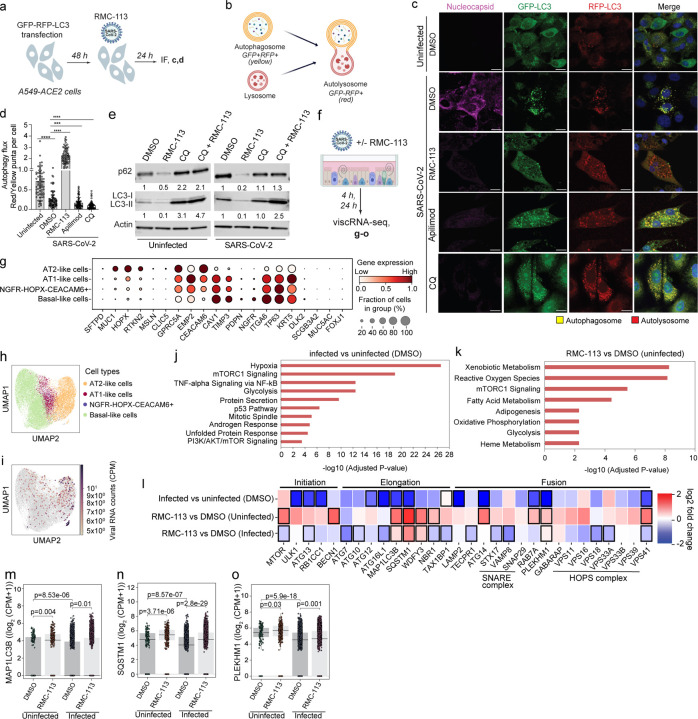
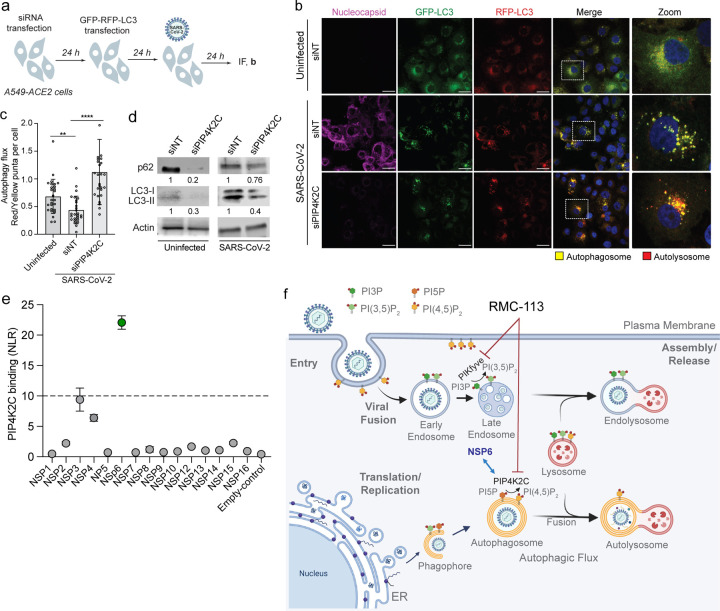
In search for broad-spectrum antivirals, we discovered a small molecule inhibitor, RMC-113, that potently suppresses the replication of multiple RNA viruses including SARS-CoV-2 in human lung organoids. We demonstrated selective dual inhibition of the lipid kinases PIP4K2C and PIKfyve by RMC-113 and target engagement by its clickable analog. Advanced lipidomics revealed alteration of SARS-CoV-2-induced phosphoinositide signature by RMC-113 and linked its antiviral effect with functional PIP4K2C and PIKfyve inhibition. We discovered PIP4K2C's roles in SARS-CoV-2 entry, RNA replication, and assembly/egress, validating it as a druggable antiviral target. Integrating proteomics, single-cell transcriptomics, and functional assays revealed that PIP4K2C binds SARS-CoV-2 nonstructural protein 6 and regulates virus-induced impairment of autophagic flux. Reversing this autophagic flux impairment is a mechanism of antiviral action of RMC-113. These findings reveal virus-induced autophagy regulation via PIP4K2C, an understudied kinase, and propose dual inhibition of PIP4K2C and PIKfyve as a candidate strategy to combat emerging viruses.


Figures

Fig. 1:
Fig. 1:. RMC-113 inhibits SARS-CoV-2 infection in vitro and in human ALOs with a high genetic barrier to resistance.
a, Chemical structure of RMC-113. b, Rescue assay for virus-induced cell lethality. RMC-113 (10 μM) was incubated with Vero E6-eGFP cells for 20 hours followed by SARS-CoV-2 infection. eGFP signal measured at 96 hpi indicates cell survival. c and d, Fluorescence images (c) and corresponding graph (d) of Vero-eGFP cells rescued from SARS-CoV-2-induced lethality by RMC-113 (Belgium-GHB-03021 strain, MOI = 0.05). e and j, Dose response to RMC-113 of SARS-CoV-2 infection [black, USA-WA1/2020 strain, MOI = 0.05 (e), 1 (j)] and cell viability (blue) in Calu-3 cells (e) or ALO-derived monolayer supernatants (j) via plaque and alamarBlue assays at 24 (e) or 48 (j) hpi, respectively. f and i, Schematics of the experiments shown in g and j, k, l, respectively. g, Vero E6-TMPRSS2 cells were infected with rSARS-CoV-2-nLuc virus (MOI = 0.05) and passaged daily under RMC-113 (0.1–0.3 μM) or DMSO over nine passages. Viral titers were measured by plaque assays. h, Dose response to RMC-113 of rSARS-CoV-2-nLuc virus harvested after nine passages under RMC-113 or DMSO via luciferase assays. k, Dose response to RMC-113 of SARS-CoV-2 (MOI = 1) nucleocapsid copy number in ALO lysates measured by RT-qPCR assays at 48 hpi. l, Confocal IF microscopy images of F-actin (violet), nucleocapsid (green), and DAPI (blue) in naive and SARS-CoV-2–infected ALOs, pretreated with DMSO or RMC-113 (5 μM) at 24 hpi. Representative merged images at x40 magnification are shown. Scale bars: 50 μm. Data is representative (c, d, g, j, l), or a combination (e, h, k) of 2 independent experiments, each with 2–3 biological replicates. Data in e, h, j, and k are relative to DMSO. Means ± SD are shown.
Fig. 2:
Fig. 2:. RMC-113 is a selective kinase inhibitor that stably binds PIKfyve and PIP4K2C.
a, Kinase abundance ratio between RMC-113 (0.1, 1.0, and 10 μM)- and DMSO-treated SUM159 cell lysates measured following affinity purification via multiplexed inhibitor beads kinome profiling and analyzed by mass spectrometry (MIB/MS). Shown are the Log2 fold change values of a subset of the screen panel (see Supplementary Fig. 2a). Data means ± SD of 2 replicates are shown. b and c, In vitro dose response to RMC-113 of PIKfyve activity (b) and PIP4K2C binding (c). d, Biochemical parameters for RMC-113 and SRN2–002. ND=Not determined e, Chemical structure of SRN2–002. f, Dose response to SRN2–002 of SARS-CoV-2 (MOI = 0.05) infection (black) and cell viability (blue) in Calu-3 cells via plaque and alamarBlue assays at 24 hpi, respectively. g, PIKfyve and PIP4K2C expression in lysates of SARS-CoV-2-infected A549-ACE2 cells following incubation with SRN2–002 individually or in combination with RMC-113, UV irradiation, and pull down by streptavidin beads measured via Western blotting at 24 hpi. Shown are representative membranes of 2 experiments. Lanes: 1: SRN2–002, no UV; 2: SRN2–002, no pull-down enrichment; 3: SRN2–002 (1 μM); 4: SRN2–002 (5 μM); 5: competitive inhibition of SRN2–002 (1 μM) with RMC-113 (10 μM); 6: competitive inhibition of SRN2–002 (5 μM) with RMC-113 (50 μM). h, Putative binding mode of RMC-113 into the ATP-binding pockets of PIKfyve and PIP4K2C based on microsecond timescale MD simulations. A representative snapshot with key interactions are shown. Binding pocket residues with >10% interaction frequencies to RMC-113 are shown. Residues with positive charge are highlighted with blue molecular surface; negative charge, red; hydrophobic, green; polar, cyan. RMC-113 is shown in yellow (carbon) stick model. H-bonds are illustrated with purple dashed lines, π–π interactions with green. See Supplemental Fig. 2f for more detailed simulation interactions. i and k, Summary of the observed main protein-ligand interactions in the MD simulations of PIKfyve (i) and PIP4K2C (k). Interactions with >10% frequency are displayed. j and l, Aggregate of protein-ligand interactions (residues with >10%) in the simulations of PIKfyve (j) and PIP4K2C (l). Data in (i and j) consist of 72 μs, and (k and l) consist of 20 μs, both analyzed each 1 ns.
Fig. 3:
Fig. 3:. PIKfyve and PIP4K2C are essential for SARS-CoV-2 infection and mediate the antiviral effect of RMC-113.
a, f, j Schematics of the experiments in b, c (a); g, h (f); and k, l, m (j). b, Confirmation of siRNA-mediated knockdown by RT-qPCR in Calu-3 cells. Shown are gene expression levels normalized to GAPDH relative to respective gene levels in siNT control at 48 hours post-transfection. c, Viral titers (PFU/ml) and cell viability (blue) in Calu-3 cells transfected with the indicated siRNAs at 24 hpi with SARS-CoV-2 (MOI = 0.05) via plaque and alamarBlue assays, respectively. d, Structures of PIKfyve and/or PIP4K2C inhibitors. e, Dose response of rSARS-CoV-2-nLuc (black, USA-WA1/2020 strain, MOI = 0.05) infection and cell viability in Calu-3 cells via luciferase and alamarBlue assays at 24 hpi, respectively. g and h, Rescue of rVSV-SARSCoV-2-S infection under RMC-113 treatment upon ectopic expression of WT PIKfyve (g) and PIP4K2C (h), their kinase-dead mutants or empty control plasmids measured by luciferase assays at 24 hpi in Vero cells. i, Phosphoinositides and associated kinases. k and l, Fold change (FC) of peak area ratio of the indicated phosphoinositides in SARS-CoV-2-infected (MOI = 0.5) vs. uninfected (k) and RMC-113- vs. DMSO-treated infected Calu-3 cells (l), as measured via PRMC-MS. m, Product-to-substrate ratios in RMC-113- vs. DMSO-treated cells infected with SARS-CoV-2 (k, l). Data is relative to siNT (b, c) or DMSO (e, g, h). Data are a combination (b, c, e, g, and h) or representative of 2 independent experiments with 2–4 replicates each. Means ± SD are shown (b, c, g, h). k, l, m represent one of two independent experiments. See an associated experiment in Supplemental Fig. 5e-g and Table S2. *P ≤ 0.05, **P < 0.01, ***P <0.001, ****P <0.0001 by 1-way ANOVA followed by Dunnett’s (b, c) or Tukey’s multiple-comparison test (g, h).
Fig. 4:
Fig. 4:. PIP4K2C is required for temporally distinct stages of the SARS-CoV-2 life cycle, whereas PIKfyve is required for viral entry only.
a, Schematic of the time-of-addition experiments shown in b, c. b and c, Calu-3 cells were infected with WT SARS-CoV-2 (MOI = 1). At the indicated times, RMC-113 (10 μM) (b), apilimod (10 μM) (c), or DMSO were added. Supernatants were collected at 10 hpi, and viral titers measured by plaque assays. d and f, Schematics of the experiments shown in e, h (d) and g, i (f). e, Dose response to RMC-113 of WT SARS-CoV-2 entry (MOI = 1) in Calu-3 cell lysates measured by RT-qPCR assays at 2 hpi. g, Dose response to RMC-113 and ensitrelvir of viral RNA replication measured by luciferase assay in Vero E6 cells 24 hours post-transfection of in vitro transcribed nano-luciferase reporter-based SARS-CoV-2 subgenomic non-infectious replicon. h, WT SARS-CoV-2 (MOI = 1) entry measured in Calu-3 cells depleted of the indicated kinases using corresponding siRNAs by RT-qPCR at 2 hpi. i, Viral RNA replication and cell viability (blue) measured by luciferase and alamarBlue assays, respectively, in Vero E6 cells depleted of the indicated kinases, 24 hours post-transfection of in vitro transcribed nano-luciferase reporter-based SARS-CoV-2 subgenomic non-infectious replicon. Data are a combination (b, c, e, g, h) or representative (i) of two independent experiments with 2–4 replicates each. Means ± SD are shown. Data is relative to DMSO (b, c, e, g) or siNT (h, i). **P < 0.01, ****P <0.0001 by 1-way ANOVA followed by Turkey’s (b,c) or Dunnett’s (h, i) multiple-comparison test. ns= non-significant.
Fig. 5:
Fig. 5:. RMC-113 reverses SARS-CoV-2-induced impairment of autophagic flux.
a, Schematic of the experiment shown in c, d. b, Autophagy flux: a shift from autophagosomes (yellow, RFP+/GFP+) to autolysosomes (red, RFP+/GFP-). c, Representative confocal microscopic images of A549-ACE2 cells transfected with GFP-RFP-LC3 tandem plasmid and infected with SARS-CoV-2 (MOI = 0.5), treated with DMSO, RMC-113 (5 μM), apilimod (5 μM) or CQ (1 μM) for 24 hours and stained for nucleocapsid (violet). Representative merged images at x40 magnification are shown Scale bars: 10 μm. Zoomed-in images show autophagosomes (yellow) and autolysosomes (red). d, Autolysosome-to-autophagosome ratio (autophagy flux) in 70 single cells (c). e, Expression levels of autophagy markers in uninfected and SARS-CoV-2-infected (MOI= 1) A549-ACE2 cell lysates treated with RMC-113 (5μM) and/or CQ (1μM) or DMSO at 24 hpi via Western blotting. Numbers represent expression signals relative to DMSO averaged from four membranes. f, Schematic of the viscRNA-seq analysis. g, Dot plot depicting marker genes used to annotate the indicated cell populations. Color indicates expression level in cpm; dot size indicates the fraction of cells expressing the marker. h and i, UMAP embedding of the scRNA-seq dataset indicating distinct cell types (h) or SARS-CoV-2 transcripts (i). j and k, Pathway enrichment in AT2 cells infected vs. uninfected (j) and RMC-113 vs. DMSO treated (k) ALOs. l, Heatmap showing the log2 fold change in the expression of autophagy-related genes between infected vs. uninfected (DMSO), RMC-113 vs. DMSO (uninfected); and RMC-113 vs. DMSO (infected) in AT2-like cells at 24 hpi. See, Supplementary Fig. 8b. Black rectangles highlight transcripts with significant changes measured by Wilcoxon test. m-o, Box plots showing the expression level of the indicated genes in individual AT2 cells at 24 hpi. Horizontal lines indicate the first, second (median) and third quartiles; whiskers extend to ±1.5× the interquartile range. P values by two-sided Wilcoxon test with Benjamini-Hochberg correction are shown. Data is a combination (d, j-o,) or representative (c, e) of 3 independent experiments. Means ± SD are shown (d). ***P < 0.001, ****P <0.0001 by 1-way ANOVA followed by Dunnett’s multiple comparison test (d).
Fig. 6:
Fig. 6:. PIP4K2C binds SARS-CoV-2 NSP6 and mediates virus-induced impairment of autophagic flux.
a, Schematic of the experiment shown in b. b, Representative confocal microscopic images of A549-ACE2 cells transfected with the indicated siRNAs and GFP-RFP-LC3 tandem plasmid, and infected with SARS-CoV-2 (MOI = 0.5) for 24 hours and stained for nucleocapsid (violet). Representative merged images at x40 magnification are shown. Scale bars: 10 μm. Zoomed-in images show autophagosomes (yellow) and autolysosomes (red). c, Autolysosome-to-autophagosomes ratio (autophagy flux) in 27 single cells (b). d, Expression levels of p62, LC3I and LC3II following transfection of the indicated siRNAs in uninfected A549-ACE2 cell lysates (left panel) and SARS-CoV-2-infected cells at 24 hpi (MOI = 0.5) (right panel). Numbers represent the expression signal relative to DMSO averaged from 3 membranes. e, PIP4K2C interactions with 15 SARS-CoV-2 nonstructural proteins and empty plasmid as measured via protein-fragment complementation assay (PCAs) in HEK 293T cells. Dots depict the mean normalized luminescence ratio (NLR) values generated from 2 independent experiments with 3 replicates each. The dotted line depicts the cutoff (NLR>10) used to define PIP4K2C-interacting proteins (depicted in green), representing greater than two SDs above the mean NLR of a non-interacting reference set. NLR, normalized luminescence ratio. f, Proposed model for the roles of PIP4K2C and PIKfyve in SARS-CoV-2 infection and the mechanism of antiviral action of RMC-113. Data is a representative (b, d, e) of 2 independent experiments. Data are relative to siNT (c, d). Means ± SD are shown (c). **P < 0.001, ****P <0.0001 by 1-way ANOVA followed by Dunnett’s multiple comparison test (c).

References

    1. Weaver S.C., Ferro C., Barrera R., Boshell J. & Navarro J.-C. Venezuelan equine encephalitis. Annual Reviews in Entomology 49, 141–174 (2004). - PubMed
    1. Lum F.-M. et al. Monkeypox: disease epidemiology, host immunity and clinical interventions. Nature Reviews Immunology 22, 597–613 (2022). - PMC - PubMed
    1. Saul S. et al. Anticancer pan-ErbB inhibitors reduce inflammation and tissue injury and exert broad-spectrum antiviral effects. The Journal of Clinical Investigation (2023). - PMC - PubMed
    1. Karim M., Lo C.-W. & Einav S. Preparing for the next viral threat with broad-spectrum antivirals. Journal of Clinical Investigation 133, e170236 (2023). - PMC - PubMed
    1. Llorente A., Arora G.K., Grenier S.F. & Emerling B.M. PIP kinases: a versatile family that demands further therapeutic attention. Advances in biological regulation 87, 100939 (2023). - PMC - PubMed

Publication types