[Preprint]. 2024 Apr 15:2024.04.12.589298.
doi: 10.1101/2024.04.12.589298.

Robust self-supervised denoising of voltage imaging data using CellMincer

Affiliations

Robust self-supervised denoising of voltage imaging data using CellMincer

Brice Wang et al. bioRxiv. .

Update in

Abstract

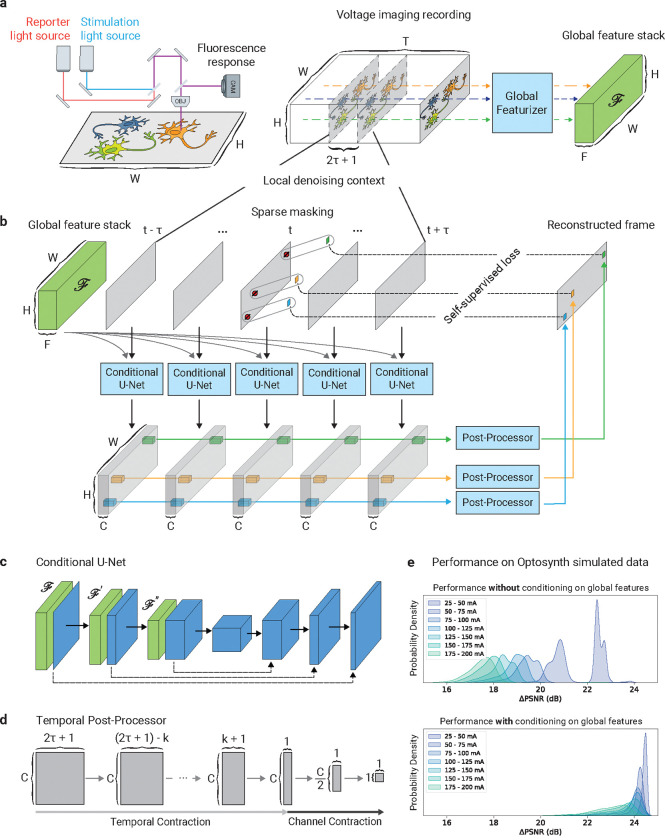
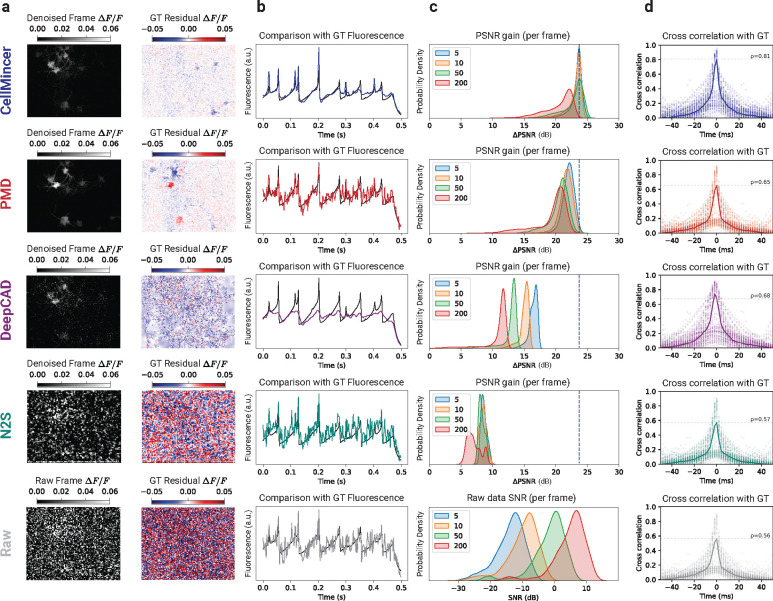
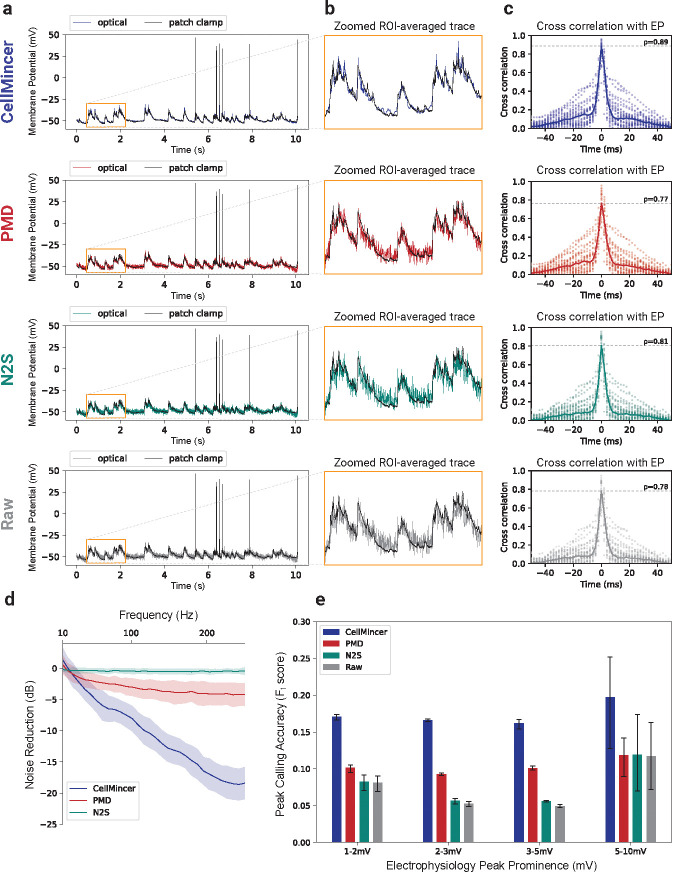
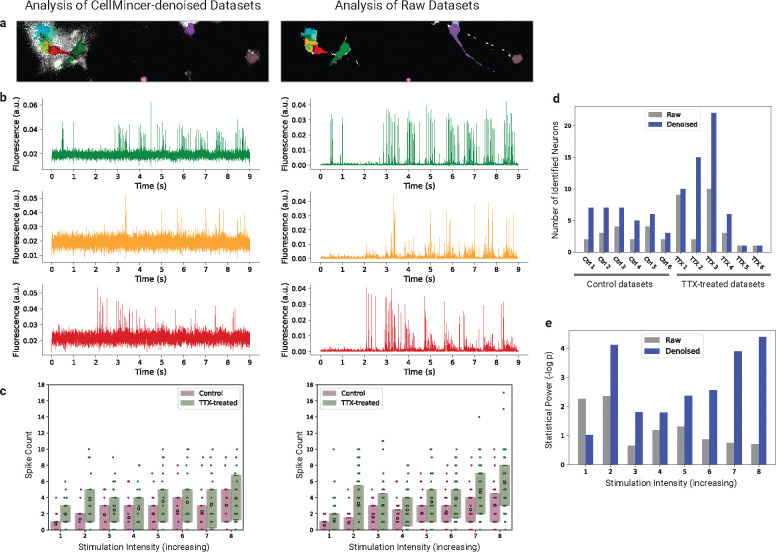
Voltage imaging enables high-throughput investigation of neuronal activity, yet its utility is often constrained by a low signal-to-noise ratio (SNR). Conventional denoising algorithms, such as those based on matrix factorization, impose limiting assumptions about the noise process and the spatiotemporal structure of the signal. While deep learning based denoising techniques offer greater adaptability, existing approaches fail to fully exploit the fast temporal dynamics and unique short- and long-range dependencies within voltage imaging datasets. Here, we introduce CellMincer, a novel self-supervised deep learning method designed specifically for denoising voltage imaging datasets. CellMincer operates on the principle of masking and predicting sparse sets of pixels across short temporal windows and conditions the denoiser on precomputed spatiotemporal auto-correlations to effectively model long-range dependencies without the need for large temporal denoising contexts. We develop and utilize a physics-based simulation framework to generate realistic datasets for rigorous hyperparameter optimization and ablation studies, highlighting the key role of conditioning the denoiser on precomputed spatiotemporal auto-correlations to achieve 3-fold further reduction in noise. Comprehensive benchmarking on both simulated and real voltage imaging datasets, including those with paired patch-clamp electrophysiology (EP) as ground truth, demonstrates CellMincer's state-of-the-art performance. It achieves substantial noise reduction across the entire frequency spectrum, enhanced detection of subthreshold events, and superior cross-correlation with ground-truth EP recordings. Finally, we demonstrate how CellMincer's addition to a typical voltage imaging data analysis workflow improves neuronal segmentation, peak detection, and ultimately leads to significantly enhanced separation of functional phenotypes.


Figures

Figure 1:
Figure 1:
Overview of voltage imaging data and CellMincer denoising model. (a) A simplified schematic diagram of a typical optical voltage imaging experiment (left). The spatially resolved fluorescence response is recorded over time to produce a voltage imaging movie. A key component of CellMincer’s preprocessing pipeline is the computation of spatial summary statistics and various auto-correlations from the entire recording, which are concatenated into a stack of global features (right). (b) An overview of CellMincer’s deep learning architecture. (c) The conditional U-Net convolutional neural network (CNN). At each step in the contracting path, the precomputed global feature stack is spatially downsampled in parallel () and concatenated to the intermediate spatial feature maps. (d) The temporal post-processor neural network. The sequence of pixel embeddings are convolved with a 1D kernel along the time dimension, producing a single vector of length C. A multilayer perceptron subsequently reduces this vector to a single value. (e) A compaxrison of model performance on simulated data before and after introducing global features as a U-Net conditioner. The distributions of PSNR gain are binned by stimulation amplitude. Using global features confers an average increase of 5 dB to the denoiser, roughly corresponding to a 3-fold noise reduction.
Figure 2:
Figure 2:
Benchmarking CellMincer and three other denoising methods on simulated voltage imaging. (a) Sample denoised frame visualizations (grayscale images) and their residuals with respect to simulated ground truth imaging (red/blue images). Both the denoised and residual images are shown as relative change in fluorescence F/F with respect to a frame-averaged polynomial regression of the baseline (see Supplemental Sec. S.3). (b) Sample denoised ROI-averaged neuron traces (color), overlaid with the ground truth (black). (c) Distributions of single-frame PSNR gain achieved through denoising. Each distribution corresponds to a different value of simulated photon-per-fluorophore count Q (shown in the legend), which is the measure of raw data SNR in Optosynth simulations (see Supplemental Sec. S.5). The dashed vertical line over the top four rows is a guide for the eye and indicates the mode of CellMincer’s PSNR gain distribution for the lowest SNR data (corresponding to Q=5). The plot at the bottom row shows the SNR distributions of the raw datasets at different Q levels. (d) Distributions of lagged cross-correlations between denoised single-neuron traces and their ground truths. Their medians are overlaid with peak correlations at Δt=0 labeled. Abbreviations: GT (ground truth).
Figure 3:
Figure 3:
Benchmarking CellMincer and two other denoising methods on paired optical and patch clamp datasets. (a) Sample denoised ROI-averaged neuron traces (color), aligned to the EP-derived ground truth (black). (b) Inlays of subthreshold activity as indicated in the previous column, magnified. (c) Distributions of lagged cross-correlations between denoised single-neuron traces and their corresponding aligned EP signals. Their medians are overlaid with peak correlations at t=0 labeled. (d) Average noise reductions at varying frequency ranges achieved through denoising. (e) Peak-calling accuracy F1-scores over a range of EP peak prominence levels, using the EP signal as ground truth. Abbreviations: ROI (region of interest).
Figure 4:
Figure 4:
Comparing the spiking activity of chronically tetrodotoxin (TTX)-treated vs. control hPSC-derived neurons with raw and CellMincer-denoised Optopatch voltage imaging data. (a) Raw and denoised versions of a sample frame, colored with the neuron components identified in their corresponding datasets. (b) Corresponding ROI-averaged single-neuron traces detected in both versions of the above frame. (c) Spike count distributions, separated by neuron population and stimulation intensity. Spikes were identified in each detected neuron’s trace and binned by their stimulation intensity. (d) Detected neuron counts in the raw and denoised versions of each dataset. (e) Statistical power of the Wilcoxon Rank Sum test applied to the neuron population differentiation hypothesis, reported as the negative logarithm of its p-value.

References

    1. Adam Yoav, Kim Jeong J, Lou Shan, Zhao Yongxin, Xie Michael E, Brinks Daan, Wu Hao, Mostajo-Radji Mohammed A, Kheifets Simon, Parot Vicente, Chettih Selmaan, Williams Katherine J, Gmeiner Benjamin, Farhi Samouil L, Madisen Linda, Buchanan E Kelly, Kinsella Ian, Zhou Ding, Paninski Liam, Harvey Christopher D, Zeng Hongkui, Arlotta Paola, Campbell Robert E, and Cohen Adam E. Voltage imaging and optogenetics reveal behavior-dependent changes in hippocampal dynamics. Nature, 569(7756):413–417, May 2019. - PMC - PubMed
    1. St-Pierre François, Marshall Jesse D, Yang Ying, Gong Yiyang, Schnitzer Mark J, and Lin Michael Z. High-fidelity optical reporting of neuronal electrical activity with an ultrafast fluorescent voltage sensor. Nature neuroscience, 17(6):884–889, 2014. - PMC - PubMed
    1. Hochbaum Daniel R, Zhao Yongxin, Farhi Samouil L, Klapoetke Nathan, Werley Christopher A, Kapoor Vikrant, Zou Peng, Kralj Joel M, Maclaurin Dougal, Smedemark-Margulies Niklas, et al. All-optical electrophysiology in mammalian neurons using engineered microbial rhodopsins. Nature methods, 11(8):825–833, 2014. - PMC - PubMed
    1. Kulkarni Rishikesh U and Miller Evan W. Voltage imaging: pitfalls and potential. Biochemistry, 56(39):5171–5177, 2017. - PMC - PubMed
    1. Lin Michael Z and Schnitzer Mark J. Genetically encoded indicators of neuronal activity. Nature neuroscience, 19(9):1142–1153, 2016. - PMC - PubMed

Publication types