

Hypoxia stimulates CTC-platelet cluster formation to promote breast cancer metastasis
- PMID: 38660400
- PMCID: PMC11039329
- DOI: 10.1016/j.isci.2024.109547
Hypoxia stimulates CTC-platelet cluster formation to promote breast cancer metastasis
Abstract
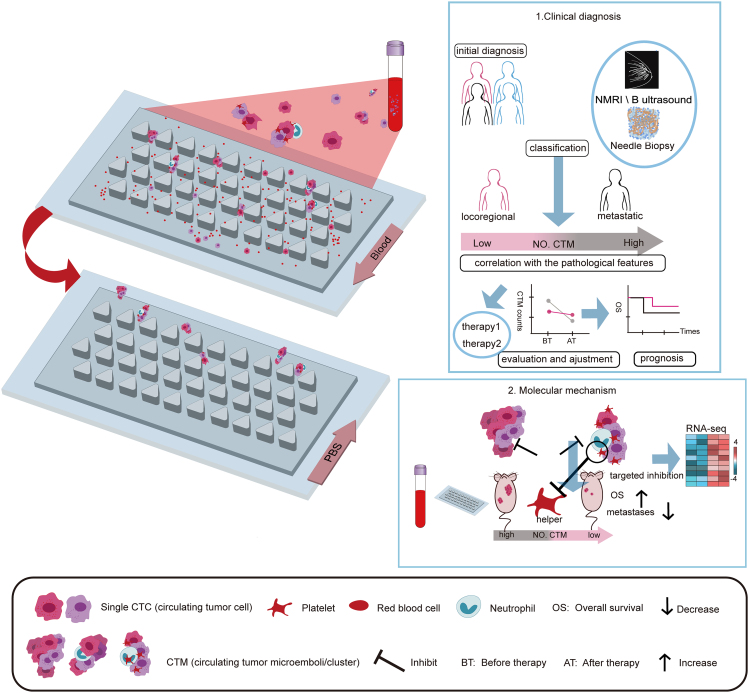
Circulating tumor cell clusters/micro-emboli (CTM) possess greater metastatic capacity and survival advantage compared to individual circulating tumor cell (CTC). However, the formation of CTM subtypes and their role in tumor metastasis remain unclear. In this study, we used a microfluidic Cluster-Chip with easy operation and high efficiency to isolate CTM from peripheral blood, which confirmed their correlation with clinicopathological features and identified the critical role of CTC-platelet clusters in breast cancer metastasis. The correlation between platelets and CTM function was further confirmed in a mouse model and RNA sequencing of CTM identified high-expressed genes related to hypoxia stimulation and platelet activation which possibly suggested the correlation of hypoxia and CTC-platelet cluster formation. In conclusion, we successfully developed the Cluster-Chip platform to realize the clinical capture of CTMs and analyze the biological properties of CTC-platelet clusters, which could benefit the design of potential treatment regimens to prevent CTM-mediated metastasis and tumor malignant progression.
Keywords: Biotechnology; Cancer; Cell biology.
© 2024 The Authors.
Conflict of interest statement
The authors declare no competing interests.
Figures


Similar articles
-
Capture of Circulating Tumour Cell Clusters Using Straight Microfluidic Chips.Cancers (Basel). 2019 Jan 14;11(1):89. doi: 10.3390/cancers11010089. Cancers (Basel). 2019. PMID: 30646614 Free PMC article.
-
A microfluidic device for label-free, physical capture of circulating tumor cell clusters.Nat Methods. 2015 Jul;12(7):685-91. doi: 10.1038/nmeth.3404. Epub 2015 May 18. Nat Methods. 2015. PMID: 25984697 Free PMC article.
-
Detection of circulating tumor cells and evaluation of epithelial-mesenchymal transition patterns of circulating tumor cells in ovarian cancer.Transl Cancer Res. 2022 Aug;11(8):2636-2646. doi: 10.21037/tcr-22-529. Transl Cancer Res. 2022. PMID: 36093536 Free PMC article.
-
Insights on CTC Biology and Clinical Impact Emerging from Advances in Capture Technology.Cells. 2019 Jun 6;8(6):553. doi: 10.3390/cells8060553. Cells. 2019. PMID: 31174404 Free PMC article. Review.
-
Circulating tumor microemboli: Progress in molecular understanding and enrichment technologies.Biotechnol Adv. 2018 Jul-Aug;36(4):1367-1389. doi: 10.1016/j.biotechadv.2018.05.002. Epub 2018 May 18. Biotechnol Adv. 2018. PMID: 29753882 Review.
Cited by
-
The role of platelets in cancer: from their influence on tumor progression to their potential use in liquid biopsy.Biomark Res. 2025 Feb 11;13(1):27. doi: 10.1186/s40364-025-00742-w. Biomark Res. 2025. PMID: 39934930 Free PMC article. Review.
-
Induced clustering of SHP2-depleted tumor cells in vascular islands restores sensitivity to MEK/ERK inhibition.J Clin Invest. 2025 Mar 25;135(10):e181609. doi: 10.1172/JCI181609. eCollection 2025 May 15. J Clin Invest. 2025. PMID: 40131370 Free PMC article.
-
Molecular Underpinnings of Brain Metastases.Int J Mol Sci. 2025 Mar 5;26(5):2307. doi: 10.3390/ijms26052307. Int J Mol Sci. 2025. PMID: 40076927 Free PMC article. Review.
-
The Dynamic Landscape of the Coagulome of Metastatic Malignant Melanoma.Int J Mol Sci. 2025 Feb 8;26(4):1435. doi: 10.3390/ijms26041435. Int J Mol Sci. 2025. PMID: 40003901 Free PMC article.
-
The role of platelets in tumor immune evasion and metastasis: mechanisms and therapeutic implications.Cancer Cell Int. 2025 Jul 11;25(1):258. doi: 10.1186/s12935-025-03877-w. Cancer Cell Int. 2025. PMID: 40646579 Free PMC article. Review.
References
-
- Krebs M.G., Metcalf R.L., Carter L., Brady G., Blackhall F.H., Dive C. Molecular analysis of circulating tumour cells-biology and biomarkers. Nat. Rev. Clin. Oncol. 2014;11:129–144. - PubMed
LinkOut - more resources
Full Text Sources
Molecular Biology Databases
