. 2024 Apr 6;27(5):109678.
doi: 10.1016/j.isci.2024.109678. eCollection 2024 May 17.

The acetylation of MDH1 and IDH1 is associated with energy metabolism in acute liver failure

Affiliations

The acetylation of MDH1 and IDH1 is associated with energy metabolism in acute liver failure

Chunxia Shi et al. iScience. .

Abstract

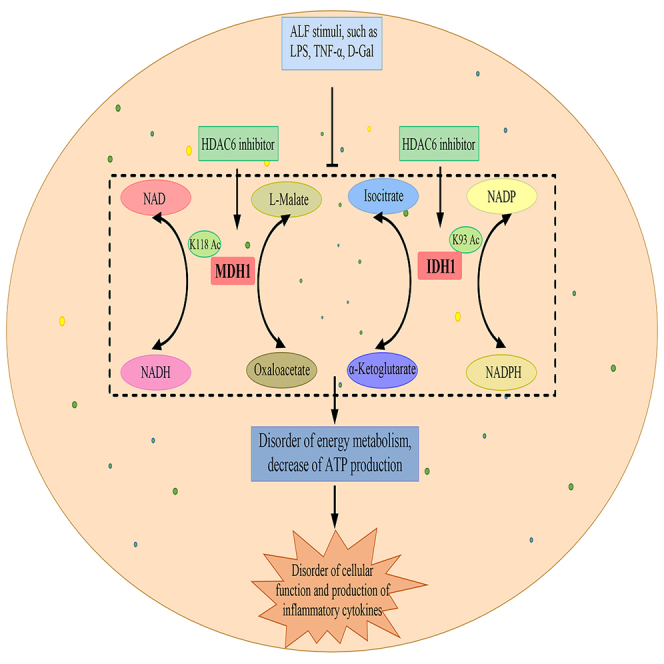
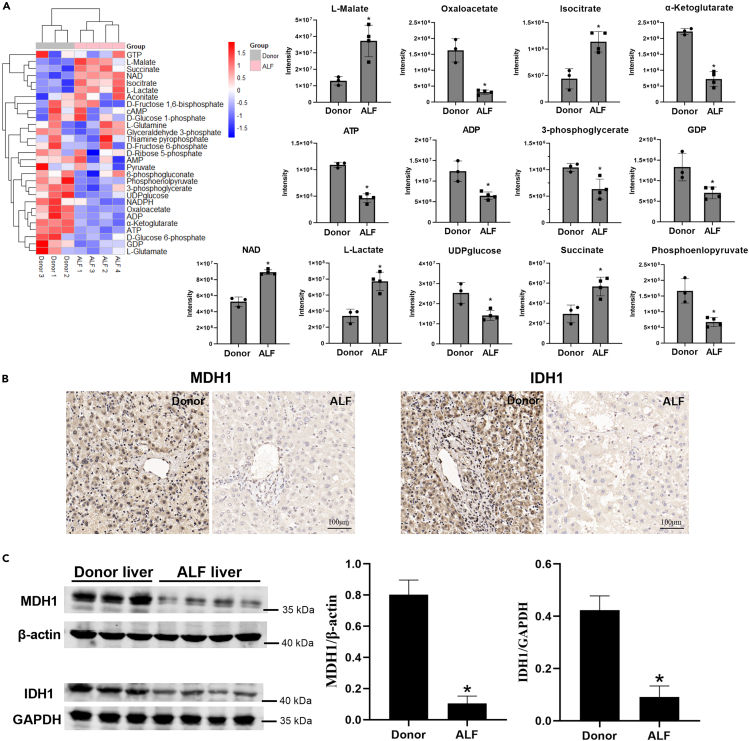
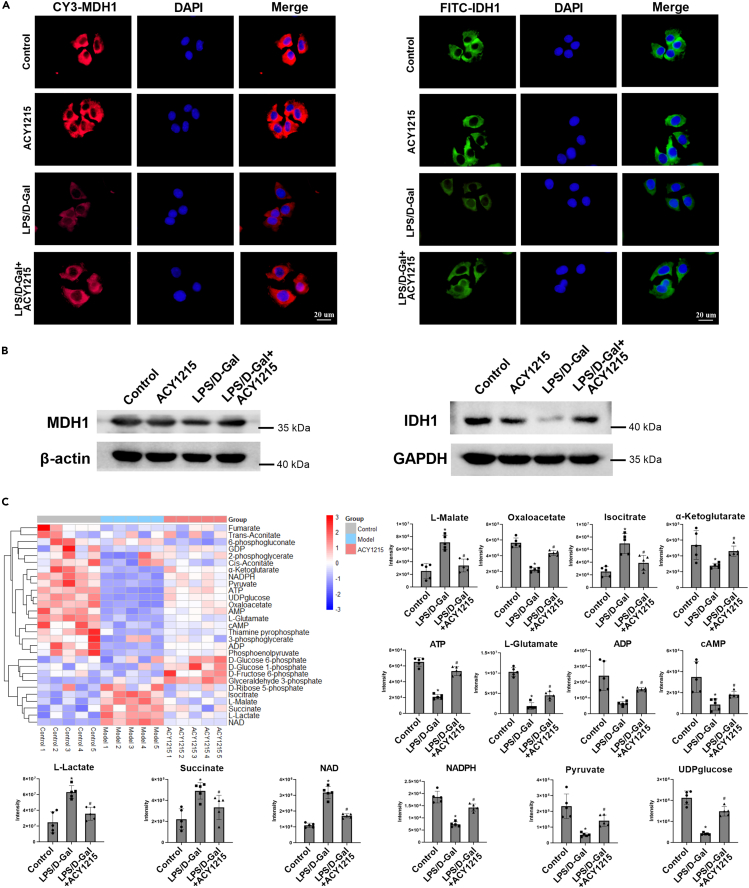
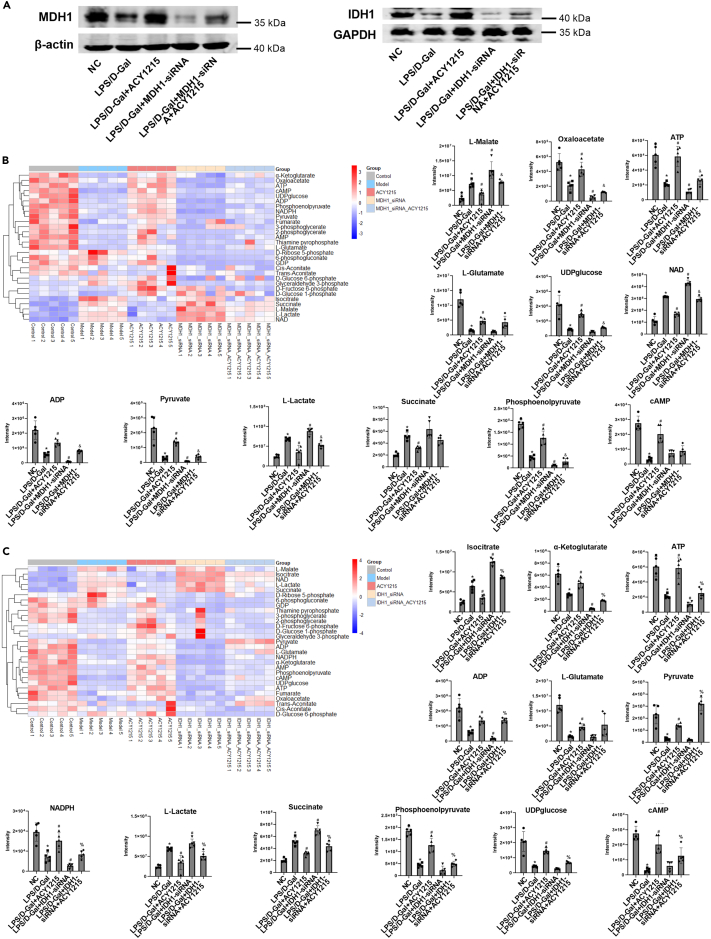
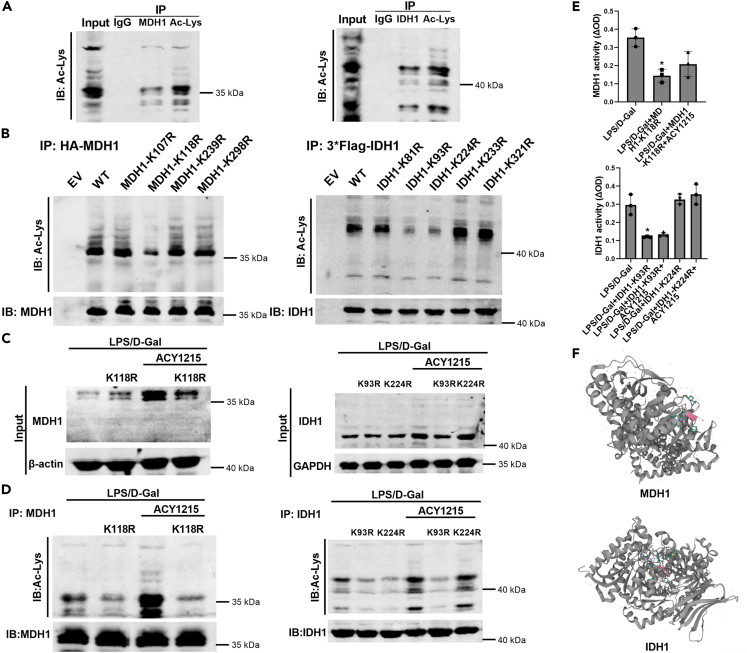
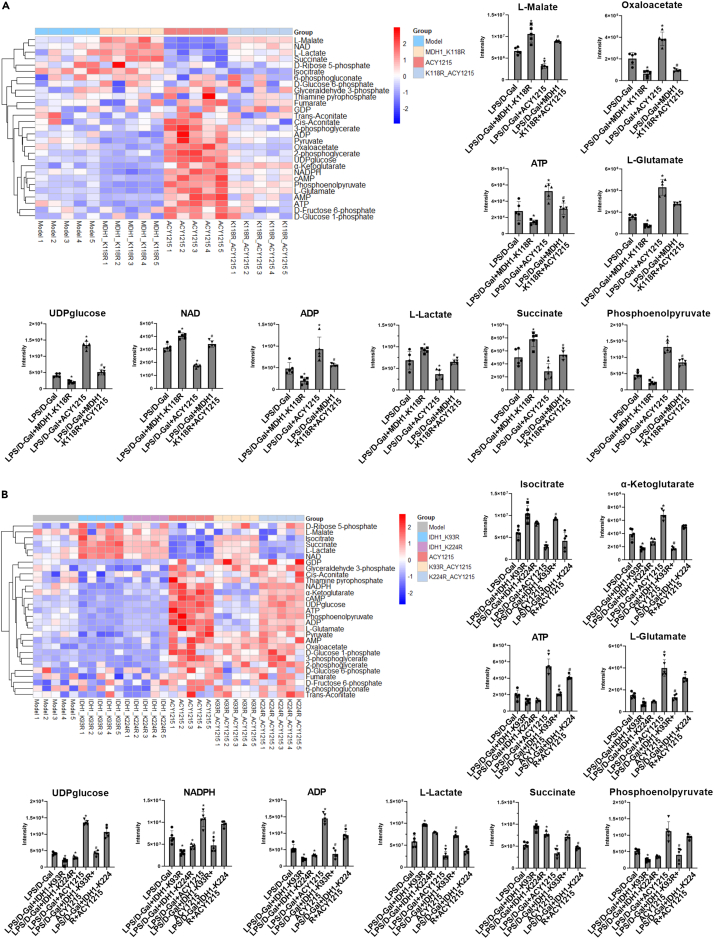
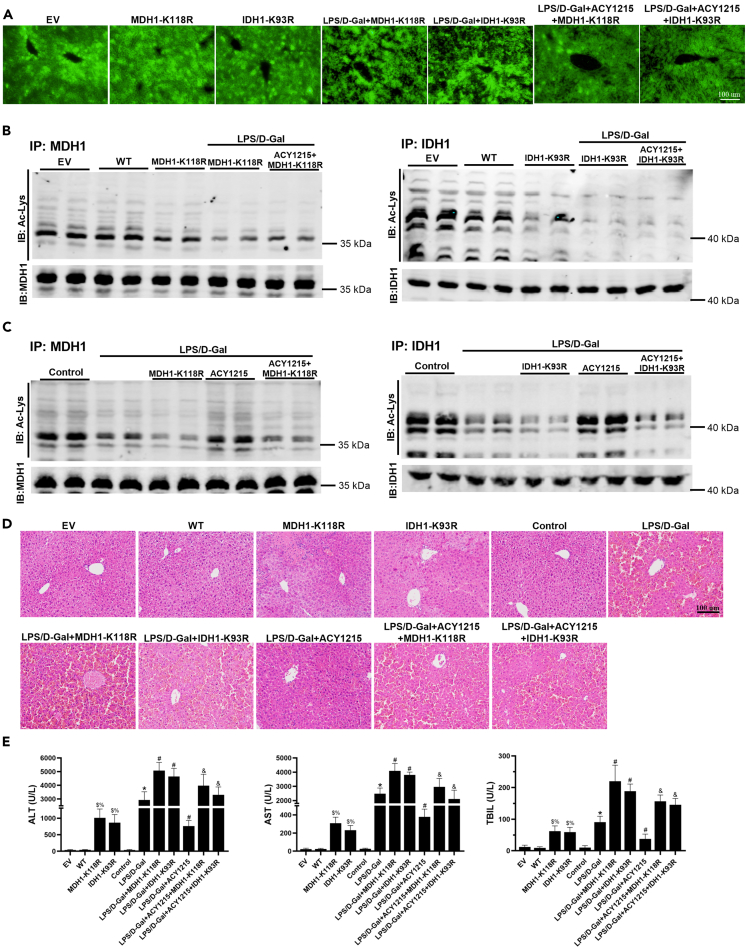
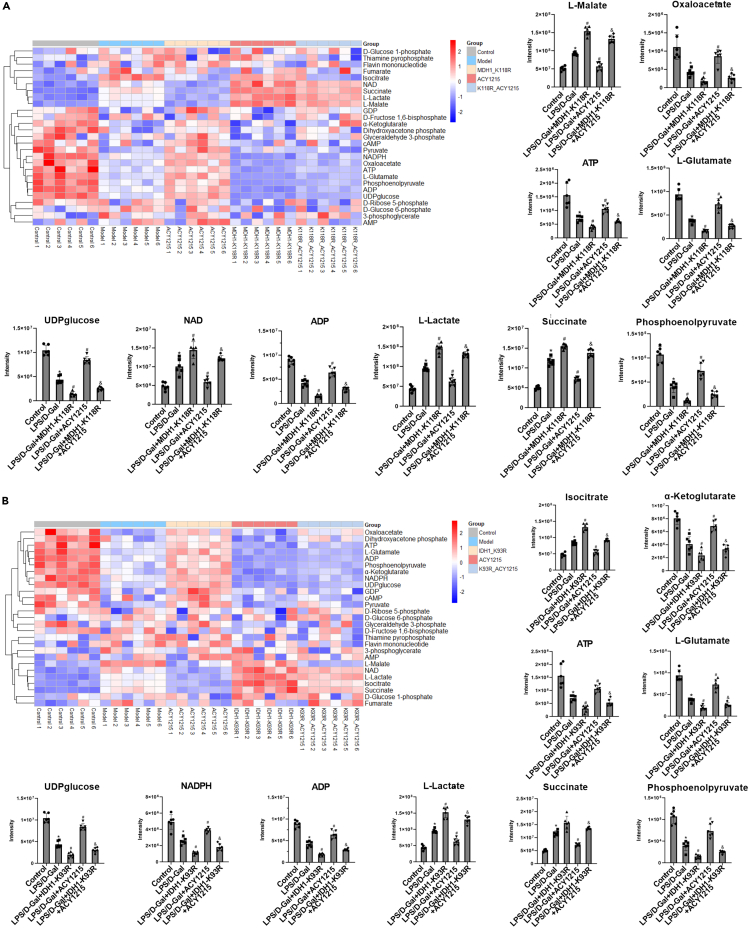
The liver is the main organ associated with metabolism. In our previous studies, we identified that the metabolic enzymes malate dehydrogenase 1 (MDH1) and isocitrate dehydrogenase 1 (IDH1) were differentially expressed in ALF. The aim of this study was to explore the changes in the acetylation of MDH1 and IDH1 and the therapeutic effect of histone deacetylase (HDAC) inhibitor in acute liver failure (ALF). Decreased levels of many metabolites were observed in ALF patients. MDH1 and IDH1 were decreased in the livers of ALF patients. The HDAC inhibitor ACY1215 improved the expression of MDH1 and IDH1 after treatment with MDH1-siRNA and IDH1-siRNA. Transfection with mutant plasmids and adeno-associated viruses, identified MDH1 K118 acetylation and IDH1 K93 acetylation as two important sites that regulate metabolism in vitro and in vivo.

Keywords: Hepatology; Human metabolism; Molecular biology.


Conflict of interest statement

The authors declare that they have no competing of interests.

Figures

None
Graphical abstract
Figure 1
Figure 1
Energy metabolism in the liver tissue of ALF patients was disordered and the levels of MDH1 and IDH1 were decreased in the liver tissue of ALF patients (A) Metabolites in three donor and four ALF human livers were examined by LC‒MS/MS, and the levels of some metabolites are shown in bar charts. (B) IHC analysis of MDH1 and IDH1 expression. (C) Protein levels of MDH1 and IDH1 in human liver samples. The results are presented as mean ± SD based on three repetitions. ∗ Compared with the donor group, p < 0.05.
Figure 2
Figure 2
The HDAC inhibitor ACY1215 increased the acetylation and activities of MDH1 and IDH1 and improved energy metabolism in AML-12 cells LPS (100 ng/mL) combined with D-Gal (44 μg/mL) was used to stimulate cells except for the control group. ACY1215 (2.5 μM) was added 2 h in advance of LPS/D-Gal. The cells were harvested 24 h after LPS/D-Gal administration. (A) IF analysis of MDH1 and IDH1 in AML-12 cells. (B) Protein levels of MDH1 and IDH1 in each group. (C) Metabolites were detected by LC‒MS/MS, and the levels of some metabolites are shown in bar charts. The results are presented as the mean ± SD. The LC‒MS/MS results are based on five repetitions, and the other results are based on three repetitions. ∗ Compared with the control group, p < 0.05; # compared with the LPS/D-Gal group, p < 0.05. In the heatmap, “Model” means “LPS/D-Gal group”; “ACY1215” means “LPS/D-Gal + ACY1215 group”.
Figure 3
Figure 3
After the application of MDH1-siRNA and IDH1-siRNA, the improvement effect of ACY1215 on metabolism was weakened in AML-12 cells The cells were divided into the NC group, LPS/D-Gal group, LPS/D-Gal + ACY1215 group, LPS/D-Gal + MDH1-siRNA or IDH1-siRNA group, and LPS/D-Gal + ACY1215 + MDH1-siRNA or LPS/D-Gal + ACY1215 + IDH1-siRNA group. LPS/D-Gal was used to stimulate the cells except the NC group. MDH1-siRNA or IDH1-siRNA transfection was performed 24 h prior to LPS/D-Gal stimulation, and ACY1215 was added to the medium 2 h prior to LPS/D-Gal stimulation. The cells were harvested 24 h after LPS/D-Gal administration. (A) Protein levels of MDH1 and IDH1 in each group. (B and C) Metabolites were detected by LC‒MS/MS, and the levels of some metabolites are shown in bar charts. The results are presented as the mean ± SD. The LC‒MS/MS results are based on five repetitions, and the other results are based on three repetitions. ∗ Compared with NC group, p < 0.05; # compared with LPS/D-Gal group, p < 0.05; & compared with LPS/D-Gal + MDH1-siRNA group, p < 0.05; % compared with LPS/D-Gal + IDH1-siRNA group, p < 0.05. In the heatmap, “Control” means “NC group”; “Model” means “LPS/D-Gal group”; “ACY1215” means “LPS/D-Gal + ACY1215 group”; “MDH1_siRNA” means “LPS/D-Gal + MDH1-siRNA group”; “IDH1_siRNA” means “LPS/D-Gal + IDH1-siRNA group”; “MDH1_siRNA_ACY1215” means “LPS/D-Gal + ACY1215 + MDH1-siRNA group”; and “IDH1_siRNA_ACY1215” means “LPS/D-Gal + ACY1215 + IDH1-siRNA group”.
Figure 4
Figure 4
Acetylation of the MDH1 K118 site and IDH1 K93 site plays key roles in activity in cells 293T cells were seeded into 6-well plates and transfected with plasmids mixed with Lipofectamine 2000 according to the manufacturer’s instructions. For AML-12 cells, LPS/D-Gal and ACY1215 were used to stimulate the cells after plasmid transfection as described above. (A) IP analysis of MDH1 and IDH1 acetylation in AML-12 cells. (B) IP analysis of 293T cells after plasmid transfection. (C) Protein levels of MDH1 and IDH1 in AML-12 cells. (D) IP analysis of AML-12 cells after plasmid transfection and drug treatment. (E) The activities of MDH1 and IDH1 in each group. MDH1 or IDH1 levels were normalized. (F) Structure of MDH1 K118 (UniProt database: P40925) and IDH1 K93 (UniProt database: O75874). ∗ Compared with LPS/D-Gal group, p < 0.05.
Figure 5
Figure 5
Effect of MDH1 K118 acetylation and IDH1 K93 and K224 acetylation on energy metabolism in AML-12 cells (A and B) Metabolites were detected by LC‒MS/MS, and the levels of some metabolites are shown in bar charts. The results are presented as the mean ± SD based on five repetitions. ∗ Compared with the LPS/D-Gal group, p < 0.05; # compared with the LPS/D-Gal + ACY1215 group, p < 0.05. In the heatmap, “Model” means “LPS/D-Gal group”; “ACY1215” means “LPS/D-Gal + ACY1215 group”; “MDH1_K118R″ means “LPS/D-Gal + MDH1 K118R group”; “K118R_ACY1215” means “LPS/D-Gal + MDH1 K118R + ACY1215 group”; “IDH1_K93R″ means “LPS/D-Gal + IDH1 K93R group”; “IDH1_K224R″ means “LPS/D-Gal + IDH1 K224R group”; “K93R_ACY1215” means “LPS/D-Gal + IDH1 K93R + ACY1215 group”; and “K224R_ACY1215” means “LPS/D-Gal + IDH1 K224R + ACY1215 group”.
Figure 6
Figure 6
The MDH1 K118 mutation and IDH1 K93 mutation aggravated liver damage in mice The mice were randomly divided into eleven groups: empty (EV) group, wild-type (WT) group, MDH1-K118R group, IDH1-K93R group, control group, LPS/D-Gal group, LPS/D-Gal + MDH1-K118R group, LPS/D-Gal + IDH1-K93R group, LPS/D-Gal + ACY1215 group, LPS/D-Gal + ACY1215 + MDH1-K118R group, and LPS/D-Gal + ACY1215 + IDH1-K93R group. Except for the EV, WT, MDH1-K118R, IDH1-K93R and control groups, the mice were intraperitoneally injected with LPS (100 μg/kg) and D-Gal (400 mg/kg). AAV was administered via tail vein injection at a dose of 1E11 vg 4 weeks before LPS/D-Gal injection. ACY1215 (25 mg/kg) was administered by intraperitoneal injection 2 h before LPS/D-Gal injection. At 24 h after LPS/D-Gal injection, the mice were sacrificed. Mouse livers and serum were collected for analysis. (A) Representative images showing AAV fluorescence. (B and C) IP analysis of MDH1 and IDH1 acetylation in each group. (D) HE staining in each group. (E) The levels of serum ALT, AST, and TBIL in each group. The results are presented as the mean ± SD based on three repetitions. $ Compared with the EV group, p < 0.05; % compared with the WT group, p < 0.05; ∗ compared with the control group, p < 0.05; # compared with the LPS/D-Gal group, p < 0.05; & compared with the LPS/D-Gal + ACY1215 group, p < 0.05.
Figure 7
Figure 7
Effect of MDH1 K118 acetylation and IDH1 K93 acetylation on energy metabolism in mouse livers (A and B) Metabolites were detected by LC‒MS/MS, and the levels of some metabolites are presented as the mean ± SD. ∗ Compared with the control group, p < 0.05; # compared with the LPS/D-Gal group, p < 0.05; & compared with the LPS/D-Gal + ACY1215 group, p < 0.05. In the heatmap, “Model” means “LPS/D-Gal group”; “ACY1215” means “LPS/D-Gal + ACY1215 group”; “MDH1_K118R″ means “LPS/D-Gal + MDH1 K118R group”; “K118R_ACY1215” means “LPS/D-Gal + MDH1 K118R + ACY1215 group”; “IDH1_K93R″ means “LPS/D-Gal + IDH1 K93R group”; and “K93R_ACY1215” means “LPS/D-Gal + IDH1 K93R + ACY1215 group”.

Similar articles

Cited by

References

    1. Stravitz R.T., Lee W.M. Acute liver failure. Lancet. 2019;394:869–881. doi: 10.1016/S0140-6736(19)31894-X. - DOI - PMC - PubMed
    1. Wu M., Liao L., Jiang L., Zhang C., Gao H., Qiao L., Liu S., Shi D. Liver-targeted Nano-MitoPBN normalizes glucose metabolism by improving mitochondrial redox balance. Biomaterials. 2019;222 doi: 10.1016/j.biomaterials.2019.119457. - DOI - PubMed
    1. Nishikawa T., Bellance N., Damm A., Bing H., Zhu Z., Handa K., Yovchev M.I., Sehgal V., Moss T.J., Oertel M., et al. A switch in the source of ATP production and a loss in capacity to perform glycolysis are hallmarks of hepatocyte failure in advance liver disease. J. Hepatol. 2014;60:1203–1211. doi: 10.1016/j.jhep.2014.02.014. - DOI - PMC - PubMed
    1. Mansouri A., Gattolliat C.H., Asselah T. Mitochondrial Dysfunction and Signaling in Chronic Liver Diseases. Gastroenterology. 2018;155:629–647. doi: 10.1053/j.gastro.2018.06.083. - DOI - PubMed
    1. Meng Q.H., Hou W., Yu H.W., Lu J., Li J., Wang J.H., Zhang F.Y., Zhang J., Yao Q.W., Wu J., et al. Resting energy expenditure and substrate metabolism in patients with acute-on-chronic hepatitis B liver failure. J. Clin. Gastroenterol. 2011;45:456–461. doi: 10.1097/MCG.0b013e31820f7f02. - DOI - PubMed