

Demography and movement patterns of a freshwater ciliate: The influence of oxygen availability
- PMID: 38660468
- PMCID: PMC11040103
- DOI: 10.1002/ece3.11291
Demography and movement patterns of a freshwater ciliate: The influence of oxygen availability
Abstract
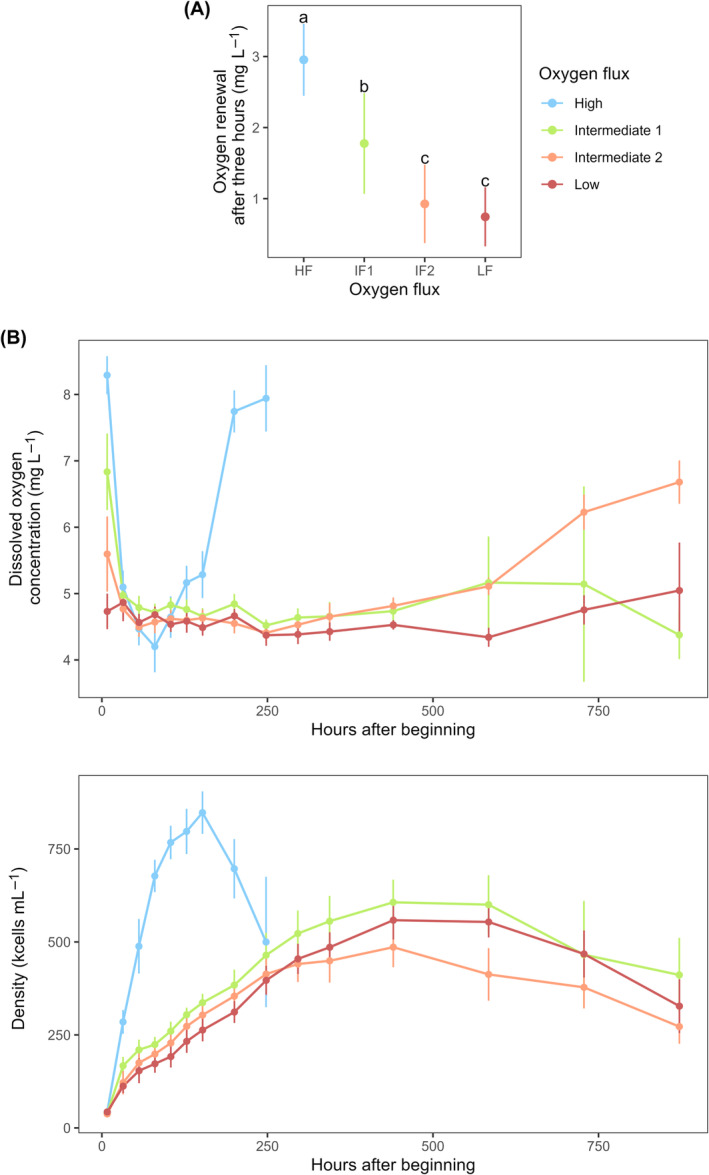
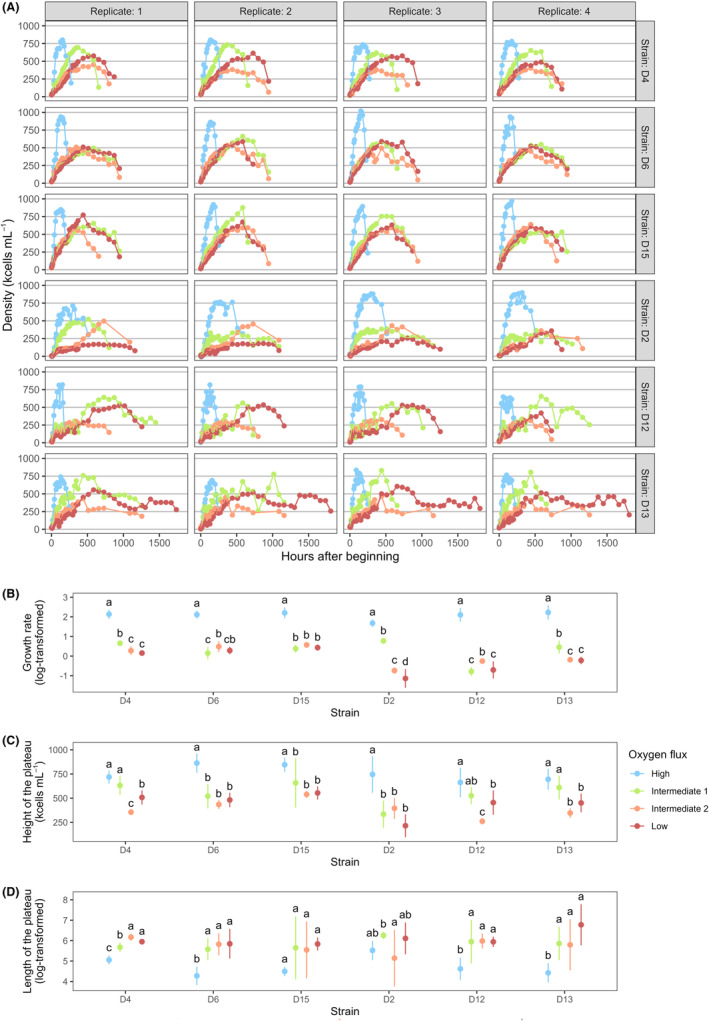
In freshwater habitats, aerobic animals and microorganisms can react to oxygen deprivation by a series of behavioural and physiological changes, either as a direct consequence of hindered performance or as adaptive responses towards hypoxic conditions. Since oxygen availability can vary throughout the water column, different strategies exist to avoid hypoxia, including that of active 'flight' from low-oxygen sites. Alternatively, some organisms may invest in slower movement, saving energy until conditions return to more favourable levels, which may be described as a 'sit-and-wait' strategy. Here, we aimed to determine which, if any, of these strategies could be used by the freshwater ciliate Tetrahymena thermophila when faced with decreasing levels of oxygen availability in the culture medium. We manipulated oxygen flux into clonal cultures of six strains (i.e. genotypes) and followed their growth kinetics for several weeks using automated image analysis, allowing to precisely quantify changes in density, morphology and movement patterns. Oxygen effects on demography and morphology were comparable across strains: reducing oxygen flux decreased the growth rate and maximal density of experimental cultures, while greatly expanding the duration of their stationary phase. Cells sampled during their exponential growth phase were larger and had a more elongated shape under hypoxic conditions, likely mirroring a shift in resource investment towards individual development rather than frequent divisions. In addition to these general patterns, we found evidence for intraspecific variability in movement responses to oxygen limitation. Some strains showed a reduction in swimming speed, potentially associated with a 'sit-and-wait' strategy; however, the frequent alteration of movement paths towards more linear trajectories also suggests the existence of an inducible 'flight response' in this species. Considering the inherent costs of turns associated with non-linear movement, such a strategy may allow ciliates to escape suboptimal environments at a low energetic cost.
Keywords: Tetrahymena thermophila; cell behaviour; hypoxia; plasticity; sit‐and‐wait.
© 2024 The Authors. Ecology and Evolution published by John Wiley & Sons Ltd.
Conflict of interest statement
The authors declare no conflict of interest.
Figures


Similar articles
-
The interplay between movement, morphology and dispersal in Tetrahymena ciliates.PeerJ. 2019 Dec 17;7:e8197. doi: 10.7717/peerj.8197. eCollection 2019. PeerJ. 2019. PMID: 31871838 Free PMC article.
-
Evolution of dispersal and life history strategies--Tetrahymena ciliates.BMC Evol Biol. 2007 Aug 6;7:133. doi: 10.1186/1471-2148-7-133. BMC Evol Biol. 2007. PMID: 17683620 Free PMC article.
-
Characteristics of dividing and non-dividing Tetrahymena cells at different physiological states.Eur J Protistol. 1993 May 28;29(2):182-90. doi: 10.1016/S0932-4739(11)80272-5. Epub 2011 Nov 2. Eur J Protistol. 1993. PMID: 23195541
-
The Minderoo-Monaco Commission on Plastics and Human Health.Ann Glob Health. 2023 Mar 21;89(1):23. doi: 10.5334/aogh.4056. eCollection 2023. Ann Glob Health. 2023. PMID: 36969097 Free PMC article. Review.
-
Hypoxia: from molecular responses to ecosystem responses.Mar Pollut Bull. 2002;45(1-12):35-45. doi: 10.1016/s0025-326x(02)00061-9. Mar Pollut Bull. 2002. PMID: 12398365 Review.
Cited by
-
Spatio-temporal pattern formation of living organisms at the edge of chaos.ISME J. 2025 Jan 2;19(1):wraf050. doi: 10.1093/ismejo/wraf050. ISME J. 2025. PMID: 40079679 Free PMC article.
References
-
- Almeyda, L. , Dhanjee, A. , Lee, K. , & Yu, L. (2015). The effect of increasing glucose concentrations on the swimming speed of Tetrahymena thermophila . The Expedition, 5.
-
- Bejda, A. J. , Studholme, A. L. , & Olla, B. L. (1987). Behavioral responses of red hake, Urophycis chuss, to decreasing concentrations of dissolved oxygen. Environmental Biology of Fishes, 19(4), 261–268. 10.1007/BF00003227 - DOI
-
- Bellou, S. , Makri, A. , Triantaphyllidou, I. E. , Papanikolaou, S. , & Aggelis, G. (2014). Morphological and metabolic shifts of Yarrowia lipolytica induced by alteration of the dissolved oxygen concentration in the growth environment. Microbiology, 160(4), 807–817. 10.1099/mic.0.074302-0 - DOI - PubMed
-
- Bower, B. , Fisher, S. , Fu, C. , & Todd, C. (2012). Determining the effect of copper sulfate concentration on the swimming speed of Tetrahymena thermophila . The Expedition, 2. https://ojs.library.ubc.ca/index.php/expedition/article/view/184156
LinkOut - more resources
Full Text Sources
