. 2024 Apr 9:12:1387234.
doi: 10.3389/fcell.2024.1387234. eCollection 2024.

Activation of Pannexin-1 channels causes cell dysfunction and damage in mesangial cells derived from angiotensin II-exposed mice

Affiliations

Activation of Pannexin-1 channels causes cell dysfunction and damage in mesangial cells derived from angiotensin II-exposed mice

Claudia M Lucero et al. Front Cell Dev Biol. .

Abstract

Chronic kidney disease (CKD) is a prevalent health concern associated with various pathological conditions, including hypertensive nephropathy. Mesangial cells are crucial in maintaining glomerular function, yet their involvement in CKD pathogenesis remains poorly understood. Recent evidence indicates that overactivation of Pannexin-1 (Panx1) channels could contribute to the pathogenesis and progression of various diseases. Although Panx1 is expressed in the kidney, its contribution to the dysfunction of renal cells during pathological conditions remains to be elucidated. This study aimed to investigate the impact of Panx1 channels on mesangial cell function in the context of hypertensive nephropathy. Using an Ang II-infused mouse model and primary mesangial cell cultures, we demonstrated that in vivo exposure to Ang II sensitizes cultured mesangial cells to show increased alterations when they are subjected to subsequent in vitro exposure to Ang II. Particularly, mesangial cell cultures treated with Ang II showed elevated activity of Panx1 channels and increased release of ATP. The latter was associated with enhanced basal intracellular Ca2+ ([Ca2+]i) and increased ATP-mediated [Ca2+]i responses. These effects were accompanied by increased lipid peroxidation and reduced cell viability. Crucially, all the adverse impacts evoked by Ang II were prevented by the blockade of Panx1 channels, underscoring their critical role in mediating cellular dysfunction in mesangial cells. By elucidating the mechanisms by which Ang II negatively impacts mesangial cell function, this study provides valuable insights into the pathogenesis of renal damage in hypertensive nephropathy.

Keywords: ATP; hypertensive nephropathy; inflammation; intracellular Ca2+; panx1.


Conflict of interest statement

The authors declare that the research was conducted in the absence of any commercial or financial relationships that could be construed as a potential conflict of interest.

Figures

FIGURE 1
FIGURE 1
Ang II infusion causes hypertension and renal damage. (A–C) Averaged data of systolic blood pressure (A), diastolic blood pressure (B) and mean arterial pressure (C) over time in mice under control (saline) conditions (blue circles) or infused with Ang II (red circles) for 6 weeks. (D–F) Averaged data of plasma creatinine levels (D), blood urea nitrogen (BUN) levels (E) and the ratio of urine protein to urine creatinine (U Prot/U Crea, (F) in mice under control (saline) conditions (blue bars) or after 6 weeks of infusion with Ang II (red bars). Each bar represents the mean value ± SEM of ≥9 independent experiments. Statistical significance, *p < 0.05, **p < 0.01, ***p < 0.001; Ang II-treated mice compared to saline-treated mice (one-way ANOVA followed by Tukey’s post hoc test).
FIGURE 2
FIGURE 2
In vivo Ang II infusion does not impact Etd uptake, whereas Ang II in vitro enhances Panx1 expression in mesangial cells. (A) Time-lapse measurements of Etd uptake by cultured mesangial cells from saline-treated mice (blue circles) or mice infused with Ang II for 6 weeks (red circles). (B) Averaged Etd uptake rate normalized with saline condition (dashed line) by cultured mesangial cells from saline-treated mice (blue bars) or mice infused with Ang II for 6 weeks (red bars). Data were obtained from at least three independent experiments with four or more repeats each one (≥30 cells analyzed for each repeat). (C) Representative experiments of expression and protein levels of Panx1 by cultured mesangial cells from saline-treated mice under control conditions or treated with 1 μM Ang II for 24, 48 or 72 h. Levels of each analyzed band were normalized according to the levels of GADPH, and α-tubulin detected in each lane. (D, E) Quantification of expression (D) and total protein levels (E) of Panx1 normalized with the control condition (dashed line) by cultured mesangial cells from saline-treated mice stimulated with 1 μM Ang II for 24, 48 or 72 h. Each bar represents the mean value ± SEM of ≥4 independent experiments with four replicates each. Statistical significance, ***p < 0.001, **p < 0.01, *p < 0.05; Ang II vs control conditions (one-way ANOVA followed by Tukey’s post hoc test). (F) Representative immunofluorescence images depicting Panx1 (red) and DAPI (blue) staining by mesangial cells from saline-treated mice under control conditions or after treatment with 1 μM Ang II for 72 h. Calibration bar = 30 μm.
FIGURE 3
FIGURE 3
In vivo Ang II infusion sensitizes mesangial cells to exhibit increased Panx1 channel activity following a subsequent in vitro Ang II exposure. Averaged Etd uptake rate normalized with saline condition (dashed line) by mesangial cells from saline-treated mice (blue bars) or six-week-treated Ang II mice (red bars) under control conditions or stimulated with 1 μM of Ang II for 72 h alone or in combination with the following blockers: 10 µM carbenoxolone (CBX), 500 µM Probenecid (PBC), 50 µM 10panx1. Each bar represents the mean value ± SEM of ≥4 independent experiments with four replicates each. Statistical significance, ***p < 0.001; Ang II from Ang II-treated mice compared to Ang II from saline-treated mice; ÇÇp < 0.01; Ang II from saline-treated mice compared to saline-treated mice; $$$ p < 0.001; Ang II from Ang II-treated mice compared to Ang II-treated mice; ### p < 0.001; effect of pharmacological agents compared to Ang II treatment from saline-treated mice; &&& p < 0.001; effect of pharmacological agents compared to Ang II treatment from Ang II-treated mice (one-way ANOVA followed by Tukey’s post hoc test).
FIGURE 4
FIGURE 4
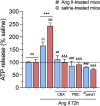
In vivo Ang II infusion sensitizes mesangial cells to exhibit increased Panx1 channel-dependent release of ATP following a subsequent in vitro Ang II exposure. Averaged data of ATP release normalized with saline condition (dashed line) by mesangial cells from saline-treated mice (blue bars) or six-week-treated Ang II mice (red bars) under control conditions or stimulated with 1 μM Ang II for 72 h alone or in combination with the following blockers: 10 µM carbenoxolone (CBX), 500 µM Probenecid (PBC) or 50 µM 10panx1. Each bar represents the mean value ± SEM of ≥4 independent experiments with four replicates each. Statistical significance, ***p < 0.001; Ang II from Ang II-treated mice compared to Ang II from saline-treated mice; ÇÇp < 0.01; Ang II from saline-treated mice compared to saline-treated mice; $$$ p < 0.001; Ang II from Ang II-treated mice compared to Ang II-treated mice; ## p < 0.01, ### p < 0.001; effect of pharmacological agents compared to Ang II treatment from saline-treated mice; &&& p < 0.001; effect of pharmacological agents compared to Ang II treatment from Ang II-treated mice (one-way ANOVA followed by Tukey’s post hoc test).
FIGURE 5
FIGURE 5
Panx1 channels contribute to the in vivo Ang II-induced sensitization of mesangial cells to exhibit increased basal and ATP-mediated [Ca2+]i dynamics following a subsequent in vitro Ang II exposure. (A, B) Representative plots of relative changes in Ca2+ signals over time induced by 10 µM ATP (light yellow background) by mesangial cells from saline-treated mice (A) or six-week-treated Ang II mice (B) under control conditions (white circles) or stimulated with 1 μM Ang II for 72 h (orange circles). (C–F) Averaged data normalized with saline condition (dashed line) of basal Ca2+ signal (C), ATP-induced peak amplitude normalized to basal FURA-2 ratio (D), integrated ATP-induced FURA-2 ratio response (E) and altered basal FURA-2 ratio (F) by mesangial cells from saline-treated mice (blue bars) or six-week-treated Ang II mice (red bars) under control conditions or stimulated with 1 μM Ang II for 72 h alone or in combination with the following blockers: 10 µM carbenoxolone (CBX), 500 µM Probenecid (PBC) or 50 µM 10panx1. Each bar represents the mean value ± SEM of ≥4 independent experiments with four replicates each. Statistical significance, *p < 0.05, **p < 0.01; Ang II from Ang II-treated mice compared to Ang II from saline-treated mice; Çp < 0.05, ÇÇp < 0.01; Ang II from saline-treated mice compared to saline-treated mice; $ p < 0.05, $$ p < 0.01, $$$ p < 0.001; Ang II from Ang II-treated mice compared to Ang II-treated mice; # p < 0.05, ## p < 0.01, ### p < 0.001; effect of pharmacological agents compared to Ang II treatment from saline-treated mice; & p < 0.05, && p < 0.01, &&& p < 0.001; effect of pharmacological agents compared to Ang II treatment from Ang II-treated mice (one-way ANOVA followed by Tukey’s post hoc test).
FIGURE 6
FIGURE 6
Panx1 channels contribute to the in vivo Ang II-induced sensitization of mesangial cells to exhibit increased IL-1β release and lipid peroxidation following a subsequent in vitro Ang II exposure. (A, B) Averaged data of IL-1β (A) or TBARS (B) levels by mesangial cells from saline-treated mice (blue bars) or six-week-treated Ang II mice (red bars) under control conditions or stimulated with 1 μM Ang II for 72 h alone or in combination with the following blockers: 10 µM carbenoxolone (CBX), 500 µM Probenecid (PBC) or 50 µM 10panx1. Each bar represents the mean value ± SEM of ≥4 independent experiments with four replicates each. Statistical significance, ***p < 0.001; Ang II from Ang II-treated mice compared to Ang II from saline-treated mice; ÇÇÇp < 0.001; Ang II from saline-treated mice compared to saline-treated mice; $$$ p < 0.001; Ang II from Ang II-treated mice compared to Ang II-treated mice; ### p < 0.001; effect of pharmacological agents compared to Ang II treatment from saline-treated mice; &&& p < 0.001; effect of pharmacological agents compared to Ang II treatment from Ang II-treated mice (one-way ANOVA followed by Tukey’s post hoc test).
FIGURE 7
FIGURE 7
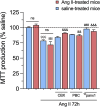
Panx1 channels contribute to the in vitro Ang II-induced decrease in cell viability in mesangial cells. Graphs showing the measurement of cell viability (MTT production) normalized with saline condition (dashed line) by mesangial cells from saline-treated mice (blue bars) or six-week-treated Ang II mice (red bars) under control conditions or stimulated with 1 μM Ang II for 72 h alone or in combination with the following blockers: 10 µM carbenoxolone (CBX), 500 µM Probenecid (PBC) or 50 µM 10panx1. Each bar represents the mean value ± SEM of ≥4 independent experiments with four replicates each. Statistical significance, ÇÇÇp < 0.001; Ang II from saline-treated mice compared to saline-treated mice; $$$ p < 0.001; Ang II from Ang II-treated mice compared to Ang II-treated mice; ### p < 0.001; effect of pharmacological agents compared to Ang II treatment from saline-treated mice; && p < 0.01, &&& p < 0.001; effect of pharmacological agents compared to Ang II treatment from Ang II-treated mice (one-way ANOVA followed by Tukey’s post hoc test).

Similar articles

References

    1. Abed A., Toubas J., Kavvadas P., Authier F., Cathelin D., Alfieri C., et al. (2014). Targeting connexin 43 protects against the progression of experimental chronic kidney disease in mice. Kidney Int. 86, 768–779. 10.1038/ki.2014.108 - DOI - PubMed
    1. Abudara V., Retamal M. A., Del Rio R., Orellana J. A. (2018). Synaptic functions of hemichannels and pannexons: a double-edged sword. Front. Mol. Neurosci. 11, 435. 10.3389/fnmol.2018.00435 - DOI - PMC - PubMed
    1. Alonso F., Krattinger N., Mazzolai L., Simon A., Waeber G., Meda P., et al. (2010). An angiotensin II- and NF-kappaB-dependent mechanism increases connexin 43 in murine arteries targeted by renin-dependent hypertension. Cardiovasc Res. 87, 166–176. 10.1093/cvr/cvq031 - DOI - PMC - PubMed
    1. Bao L., Locovei S., Dahl G. (2004). Pannexin membrane channels are mechanosensitive conduits for ATP. FEBS Lett. 572, 65–68. 10.1016/j.febslet.2004.07.009 - DOI - PubMed
    1. Baranova A., Ivanov D., Petrash N., Pestova A., Skoblov M., Kelmanson I., et al. (2004). The mammalian pannexin family is homologous to the invertebrate innexin gap junction proteins. Genomics 83, 706–716. 10.1016/j.ygeno.2003.09.025 - DOI - PubMed