. 2024 Jun 1;326(6):F1041-F1053.
doi: 10.1152/ajprenal.00005.2024. Epub 2024 Apr 25.

SGLT2-independent effects of canagliflozin on NHE3 and mitochondrial complex I activity inhibit proximal tubule fluid transport and albumin uptake

Affiliations

SGLT2-independent effects of canagliflozin on NHE3 and mitochondrial complex I activity inhibit proximal tubule fluid transport and albumin uptake

Wafaa N Albalawy et al. Am J Physiol Renal Physiol. .

Abstract

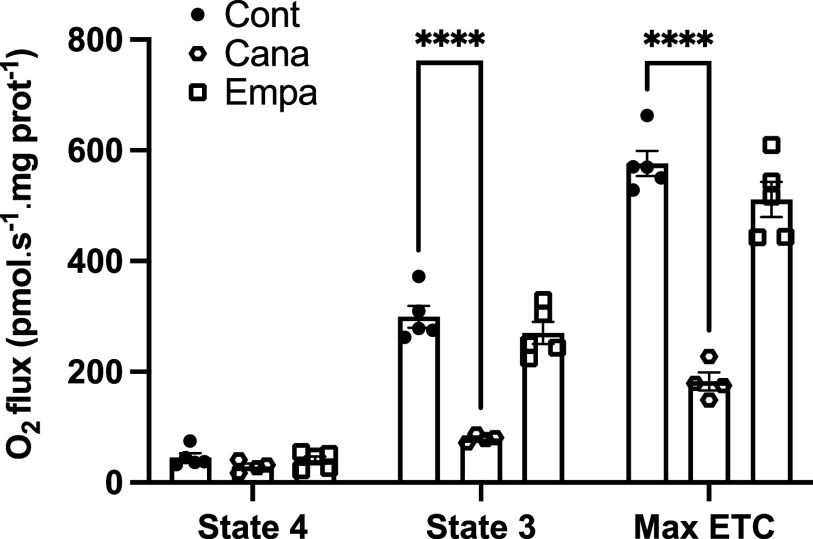
Beyond glycemic control, SGLT2 inhibitors (SGLT2is) have protective effects on cardiorenal function. Renoprotection has been suggested to involve inhibition of NHE3 leading to reduced ATP-dependent tubular workload and mitochondrial oxygen consumption. NHE3 activity is also important for regulation of endosomal pH, but the effects of SGLT2i on endocytosis are unknown. We used a highly differentiated cell culture model of proximal tubule (PT) cells to determine the direct effects of SGLT2i on Na+-dependent fluid transport and endocytic uptake in this nephron segment. Strikingly, canagliflozin but not empagliflozin reduced fluid transport across cell monolayers and dramatically inhibited endocytic uptake of albumin. These effects were independent of glucose and occurred at clinically relevant concentrations of drug. Canagliflozin acutely inhibited surface NHE3 activity, consistent with a direct effect, but did not affect endosomal pH or NHE3 phosphorylation. In addition, canagliflozin rapidly and selectively inhibited mitochondrial complex I activity. Inhibition of mitochondrial complex I by metformin recapitulated the effects of canagliflozin on endocytosis and fluid transport, whereas modulation of downstream effectors AMPK and mTOR did not. Mice given a single dose of canagliflozin excreted twice as much urine over 24 h compared with empagliflozin-treated mice despite similar water intake. We conclude that canagliflozin selectively suppresses Na+-dependent fluid transport and albumin uptake in PT cells via direct inhibition of NHE3 and of mitochondrial function upstream of the AMPK/mTOR axis. These additional targets of canagliflozin contribute significantly to reduced PT Na+-dependent fluid transport in vivo.NEW & NOTEWORTHY Reduced NHE3-mediated Na+ transport has been suggested to underlie the cardiorenal protection provided by SGLT2 inhibitors. We found that canagliflozin, but not empagliflozin, reduced NHE3-dependent fluid transport and endocytic uptake in cultured proximal tubule cells. These effects were independent of SGLT2 activity and resulted from inhibition of mitochondrial complex I and NHE3. Studies in mice are consistent with greater effects of canagliflozin versus empagliflozin on fluid transport. Our data suggest that these selective effects of canagliflozin contribute to reduced Na+-dependent transport in proximal tubule cells.

Keywords: metabolism; proximal tubule; sodium-glucose cotransporter; sodium/hydrogen exchanger.


Conflict of interest statement

O.A.W. serves as a consultant for Judo Biosciences. None of the other authors has any conflicts of interest, financial or otherwise, to disclose.

Figures

None
Graphical abstract
Figure 1.
Figure 1.
Canagliflozin (Cana) inhibits fluid transport across PT cell monolayers in a glucose-independent manner. A: filter-grown OK cells were pretreated with vehicle (Ctrl) with the indicated concentrations of canagliflozin or empagliflozin (Empa) or with S3226 (30 µM) plus or minus canagliflozin (25 µM) for 6 h. The volume of apical fluid remaining above the cells was measured and normalized to that of untreated controls in each experiment. Average fluid transport in control cells was 10.3 ± 1.57 µL/h. B: cells were incubated for 6 h with or without canagliflozin (25 µM) in medium containing the indicated concentration of glucose. Fluid transport was quantified as in A and normalized to control conditions (17 mM glucose). Each point in A and B represents data from an individual experiment where the average of replicate values was normalized to the control uptake. Statistical significance was determined by ordinary one-way ANOVA with Dunnett’s multiple comparisons test in A and with Sidak’s multiple comparisons test in B. Asterisks above each column denote significance relative to control (*P < 0.05, **P < 0.01, ***P < 0.001, ***P < 0.0001). OK, opossum kidney; PT, proximal tubule.
Figure 2.
Figure 2.
Canagliflozin (Cana) inhibits endogenous and heterologously expressed NHE3. A: OK cells cultured on 24-well plates were incubated overnight with S3226 (50 µM), canagliflozin (25 µM), or empagliflozin (Empa, 25 µM), and drugs were included in subsequent steps. The following day, cells were loaded with 2 µM BCECF for 30 min and subjected to acid load as described in materials and methods. The acid load buffer was aspirated and intracellular pH (pHi) recovery was monitored under control or Na+-free conditions. B: individual recovery curves were calculated as mentioned in materials and methods. Each point in B represents data from an individually calibrated well (n = 8). Statistical significance was determined by ordinary one-way ANOVA with Dunnett’s multiple comparisons test. C: AP-1 cells transfected with rabbit NHE3 cDNA as described in materials and methods were loaded with 10 µM SNARF for 30 min. After baseline measurements and incubation with NH4Cl, acid load recovery was induced by replacing the NH4Cl buffer with the HEPES buffer with or without drug [EIPA (10 µM), canagliflozin (25 µM), or empagliflozin (50 µM)]. D: individual recovery curves were calculated as described in materials and methods. All technical replicates from three independent experiments are shown. Statistical significance was determined by ordinary one-way ANOVA with Dunnett’s multiple comparisons test. OK, opossum kidney.
Figure 3.
Figure 3.
Glucose-independent inhibition of albumin uptake in PT cells by canagliflozin (Cana). A: filter-grown OK cells were pretreated for 2 h with vehicle or with canagliflozin (cana, 25 µM) or empagliflozin (Empa, 25 µM) and then incubated with apically added Alexa Fluor-647 albumin (40 µg/mL) for 15 min before fixing and imaging. Representative fields are shown. Scale bar: 25 µm. B: OK cells were pretreated for 6 h with vehicle (Ctrl) or with the indicated concentrations of canagliflozin or empagliflozin and then incubated for 15 min with Alexa Fluor-647 albumin before quantifying cell-associated albumin by spectrofluorimetry. C: cells were preincubated for 6 h with or without canagliflozin (25 µM) in medium containing the indicated concentration of glucose and albumin uptake measured as in B. Each point in B and C represents data from an individual experiment where the average of replicate values was normalized to the control uptake. Statistical significance was determined by ordinary one-way ANOVA with Dunnett’s multiple comparisons test in B and with Sidak’s multiple comparisons test in C. Asterisks above each column denote significance relative to control (****P < 0.0001). OK, opossum kidney; PT, proximal tubule.
Figure 4.
Figure 4.
Inhibition of albumin uptake by canagliflozin (Cana) is independent of NHE3. A: duplicate filters of OK cells were incubated for 6 h with NHE3 inhibitors EIPA (25 µM) or S3226 (30 µM) in the presence or absence of canagliflozin (25 µM) before quantitation of albumin uptake. Statistical significance was determined by ordinary one-way ANOVA with Tukey’s multiple comparisons test multiple comparisons. Asterisks above each bar represent significance relative to control and horizontal bars denote statistically significant differences between other conditions (*P < 0.05, **P < 0.01, ***P < 0.001, ****P < 0.0001). B: duplicate filters of OK cells were treated for 2 h with vehicle (control), canagliflozin (25 µM), S3226 (30 µM), or both drugs, and the pH of early endosomes was quantified by ratio imaging as described in materials and methods. Each point represents a single endosome and the means ± SE (in gray) for each condition is plotted (***P < 0.001 and ****P < 0.0001 by two-way ANOVA with Tukey’s multiple comparisons test). C: duplicate filters of OK cells were incubated with EIPA (25 µM), S3226 (30 µM), or canagliflozin (25 µM) for 6 h, and then solubilized. Equal protein loads were Western blotted with antibodies against NHE3 and phospho-S580 NHE3 (pNHE3). A representative gel is shown. Migration of molecular mass standards (in kDa) is indicated on the right. D: the ratio of pNHE3/NHE3 (control ratios normalized to 100% in each experiment) from 3 or 4 independent experiments for each condition is plotted. *P < 0.05 by one-way ANOVA vs. control. OK, opossum kidney.
Figure 5.
Figure 5.
Canagliflozin (Cana) inhibition of albumin uptake is independent of the AMPK/mTOR axis. A: duplicate filters of OK cells were treated with vehicle (Ctrl), S3226 (30 µM), canagliflozin (25 µM), empagliflozin (Empa, 25 µM), rapamycin (Rapa, 10 µM), or AICAR (1 mM) for 6 h and then solubilized. Equal protein loads were blotted to detect AMPK and phospho-AMPK (p-AMPK) mTOR, phospho-mTOR (pmTOR), and phospho-S6 (pS6). Migration of molecular mass standards (in kDa) is indicated on the right. Similar results were obtained in three independent experiments. Duplicate filters of OK cells were treated with vehicle (Ctrl), canagliflozin (25 µM), AICAR (1 mM), rapamycin (10 µM), or metformin (met, 1 mM) for 6 h and fluid transport (B) or albumin uptake (C) was quantified. Each point represents data from an individual experiment where the average of replicate values was normalized to the control uptake. Statistical significance was determined by ordinary one-way ANOVA with Dunnett’s multiple comparisons test. Asterisks above each column denote significance relative to control (*P < 0.05, **P < 0.01, ***P < 0.001, ****P < 0.0001). OK, opossum kidney.
Figure 6.
Figure 6.
Canagliflozin (Cana) selectively inhibits mitochondrial complex I activity. Filter-grown OK cells were pretreated with or without canagliflozin (25 µM) or empagliflozin (Empa, 25 µM) for 30 min. Mitochondrial respiration was measured in the continued presence of drug as described in materials and methods. State 4 represents routine respiration in the presence of complex I substrates, State 3 represents complex I ADP-stimulated activity (OXPHOS), and Max ETC represents the maximum electron transport chain activity supported by complex I activity measured in the presence of the uncoupler FCCP. Data from five independent experiments are plotted. Significance was assessed by two-way ANOVA with Dunnett’s multiple comparisons test (****P < 0.0001). OK, opossum kidney.

Comment in

References

    1. Limbutara K, Chou C-L, Knepper MA. Quantitative proteomics of all 14 renal tubule segments in rat. J Am Soc Nephrol 31: 1255–1266, 2020. doi:10.1681/ASN.2020010071. - DOI - PMC - PubMed
    1. Shepard BD, Pluznick JL. Saving the sweetness: renal glucose handling in health and disease. Am J Physiol Renal Physiol 313: F55–F61, 2017. doi:10.1152/ajprenal.00046.2017. - DOI - PMC - PubMed
    1. Fonseca-Correa JI, Correa-Rotter R. Sodium-glucose cotransporter 2 inhibitors mechanisms of action: a review. Front Med (Lausanne) 8: 777861, 2021. doi:10.3389/fmed.2021.777861. - DOI - PMC - PubMed
    1. Rieg T, Vallon V. Development of SGLT1 and SGLT2 inhibitors. Diabetologia 61: 2079–2086, 2018. doi:10.1007/s00125-018-4654-7. - DOI - PMC - PubMed
    1. Perkovic V, Jardine MJ, Neal B, Bompoint S, Heerspink HJL, Charytan DM, Edwards R, Agarwal R, Bakris G, Bull S, Cannon CP, Capuano G, Chu PL, de Zeeuw D, Greene T, Levin A, Pollock C, Wheeler DC, Yavin Y, Zhang H, Zinman B, Meininger G, Brenner BM, Mahaffey KW; CREDENCE Trial Investigators. Canagliflozin and renal outcomes in type 2 diabetes and nephropathy. N Engl J Med 380: 2295–2306, 2019. doi:10.1056/NEJMoa1811744. - DOI - PubMed

MeSH terms

LinkOut - more resources