. 2025 Jan;52(1):56-67.
doi: 10.1111/jcpe.13990. Epub 2024 Apr 25.

Probing the salivary proteome for prognostic biomarkers in response to non-surgical periodontal therapy

Affiliations

Probing the salivary proteome for prognostic biomarkers in response to non-surgical periodontal therapy

Angelika Silbereisen et al. J Clin Periodontol. 2025 Jan.

Abstract

Aim: This prospective study investigated the salivary proteome before and after periodontal therapy.

Materials and methods: Ten systemically healthy, non-smoking, stage III, grade C periodontitis patients underwent non-surgical periodontal treatment. Full-mouth periodontal parameters were measured, and saliva (n = 30) collected pre- (T0), and one (T1) and six (T6) months post-treatment. The proteome was investigated by label-free quantitative proteomics. Protein expression changes were modelled over time, with significant protein regulation considered at false discovery rate <0.05.

Results: Treatment significantly reduced bleeding scores, percentages of sites with pocket depth ≥5 mm, plaque and gingival indexes. One thousand seven hundred and thirteen proteins were identified and 838 proteins (human = 757, bacterial = 81) quantified (≥2 peptides). At T1, 80 (T1 vs. T0: 60↑:20↓), and at T6, 118 human proteins (T6 vs. T0: 67↑:51↓) were regulated. The salivary proteome at T6 versus T1 remained stable. Highest protein activity post- versus pre-treatment was observed for cellular movement and inflammatory response. The small proline-rich protein 3 (T1 vs. T0: 5.4-fold↑) and lymphocyte-specific protein 1 (T6 vs. T0: 4.6-fold↓) were the top regulated human proteins. Proteins from Neisseria mucosa and Treponema socranskii (T1 vs. T0: 8.0-fold↓, 4.9-fold↓) were down-regulated.

Conclusions: Periodontal treatment reduced clinical disease parameters and these changes were reflected in the salivary proteome. This underscores the potential of utilizing saliva biomarkers as prognostic tools for monitoring treatment outcomes.

Keywords: biomarkers; label‐free quantitative proteomics; periodontal treatment; periodontitis; saliva; subgingival instrumentation.


Conflict of interest statement

The authors declare no conflicts of interest.

Figures
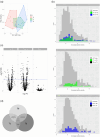
FIGURE 1
FIGURE 1
Saliva proteome in periodontitis stage III, grade C patients (n = 10) at baseline (T0) and 1‐month (T1) and 6‐month (T6) post‐treatment. (a) Principal component analysis for saliva proteome clustered based on normalized protein intensities for the quantified (≥peptides) proteins at each time point. (b) Bar plots summarize the numbers of all quantified human proteins (in grey) at different abundance levels based on their normalized protein intensities at T0, T1 and T6. Additionally, proteins that were significantly regulated (false discovery rate [FDR] <0.05) when comparing their abundance between T1 and T0, T6 and T0, and T6 and T1, are labelled in green, blue and black, respectively. (c) Volcano plots visualizing the regulation patterns of the quantified proteins between different time points and bar plots illustrating protein intensities and regulated proteins at each time point. Negative log10‐transformed FDRs in the volcano plots are presented as a function of log2‐fold changes. Proteins were considered regulated based on FDR < 0.05 (dotted line). (d) Venn diagram illustrating regulated human proteins between the different time points. Exclusively regulated proteins between the different time points are provided in parenthesis.
FIGURE 2
FIGURE 2
Top 3 up‐regulated and down‐regulated human proteins between the three time points T0, T1 and T6 (based on highest fold changes and a false discovery rate [FDR] <0.05). Normalized protein intensities are presented as median ± interquartile range and for each patient (n = 10) individually. (a) Small proline‐rich protein 3 (up‐regulated: 5.4‐fold at T1 vs. T0, 6.1‐fold at T6 vs. T0), (b) adipogenesis regulatory factor (up‐regulated: 3.5‐fold at T1 vs. T0), (c) keratin, type I cytoskeletal 16 (up‐regulated: 3.2‐fold at T1 vs. T0), (d) haemoglobin subunit delta (down‐regulated: 7.6‐fold at T1 vs. T0, 5.4‐fold at T6 vs. T0), (e) carbonic anhydrase 1 (down‐regulated: 5.9‐fold at T1 vs. T0, 5.8‐fold at T6 vs. T0), (f) band 3 anion transport protein (down‐regulated: 5.2‐fold at T1 vs. T0), (g) dipeptidyl peptidase 4 (up‐regulated: 3.5‐fold at T6 vs. T0), (h) heat shock protein beta‐1 (up‐regulated: 3.4‐fold at T6 vs. T0), (i) lymphocyte‐specific protein 1 (down‐regulated: 4.6‐fold at T6 vs. T0, 3.3‐fold at T6 vs. T1). *Significant difference to baseline (FDR < 0.05). Significant difference to T1 (FDR < 0.05).
FIGURE 3
FIGURE 3
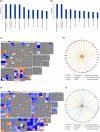
Pathway analysis for regulated human proteins based on a false discovery rate (FDR) < 0.05. (a, b) Top 10 disease categories regulated between T1 versus T0 (a) and T6 versus T0 (b) ranked by −log(p‐values). (c, d) Mapping of the top 10 disease categories indicating increased or decreased activity in associated diseases or biological processes (squares) between T1 versus T0 (c) and T6 versus T0 (d). The square colour indicates increased (orange) or decreased (blue) activity based on z‐scores (grey: no prediction), with colour intensities reflecting the prediction strength. The square size reflects −log(p‐values) (larger squares: more significant). (e, f) Biological process ‘cell movement’ (within the disease category ‘cellular movement’) with high activity patterns based on z‐scores between T1 versus T0 (e) and T6 versus T0 (f) and associated proteins. Proteins are colour‐coded (red: up‐regulated, green: down‐regulated compared to baseline) and colour intensity increases with the degree of regulation. Predicted relationships between the biological process and the associated proteins are indicated by lines (orange: activation, blue: inhibition, yellow: effect inconsistent, grey: no prediction).

References

    1. Afacan, B. , Öztürk, V. Ö. , Emingil, G. , Köse, T. , & Bostanci, N. (2018). Alarm anti‐protease trappin‐2 negatively correlates with proinflammatory cytokines in patients with periodontitis. Journal of Periodontology, 89(1), 58–66. 10.1902/jop.2017.170245 - DOI - PubMed
    1. Andersen, E. , Dessaix, I. M. , Perneger, T. , & Mombelli, A. (2010). Myeloid‐related protein (MRP8/14) expression in gingival crevice fluid in periodontal health and disease and after treatment. Journal of Periodontal Research, 45(4), 458–463. 10.1111/j.1600-0765.2009.01257.x - DOI - PubMed
    1. Balan, P. , Belibasakis, G. , Ivanovski, S. , Bostanci, N. , & Seneviratne, C. J. (2022). Community dynamics of subgingival microbiome in periodontitis and targets for microbiome modulation therapy. Critical Reviews in Microbiology, 1–13, 726–738. 10.1080/1040841X.2022.2133594 - DOI - PubMed
    1. Baumgartner, D. , Johannsen, B. , Specht, M. , Lüddecke, J. , Rombach, M. , Hin, S. , Paust, N. , von Stetten, F. , Zengerle, R. , Herz, C. , Peham, J. R. , Paqué, P. N. , Attin, T. , Jenzer, J. S. , Körner, P. , Schmidlin, P. R. , Thurnheer, T. , Wegehaupt, F. J. , Kaman, W. E. , … Mitsakakis, K. (2021). OralDisk: A chair‐side compatible molecular platform using whole saliva for monitoring oral health at the dental practice. Biosensors, 11(11), 423. 10.3390/bios11110423 - DOI - PMC - PubMed
    1. Belibasakis, G. N. , Bostanci, N. , Marsh, P. D. , & Zaura, E. (2019). Applications of the oral microbiome in personalized dentistry. Archives of Oral Biology, 104, 7–12. 10.1016/j.archoralbio.2019.05.023 - DOI - PubMed