. 2024 Jun;44(6):1246-1264.
doi: 10.1161/ATVBAHA.123.320367. Epub 2024 Apr 25.

Mild Hypoxia Accelerates Cerebral Cavernous Malformation Disease Through CX3CR1-CX3CL1 Signaling

Affiliations

Mild Hypoxia Accelerates Cerebral Cavernous Malformation Disease Through CX3CR1-CX3CL1 Signaling

Eduardo Frias-Anaya et al. Arterioscler Thromb Vasc Biol. 2024 Jun.

Abstract

Background: Heterogeneity in the severity of cerebral cavernous malformations (CCMs) disease, including brain bleedings and thrombosis that cause neurological disabilities in patients, suggests that environmental, genetic, or biological factors act as disease modifiers. Still, the underlying mechanisms are not entirely understood. Here, we report that mild hypoxia accelerates CCM disease by promoting angiogenesis, neuroinflammation, and vascular thrombosis in the brains of CCM mouse models.

Methods: We used genetic studies, RNA sequencing, spatial transcriptome, micro-computed tomography, fluorescence-activated cell sorting, multiplex immunofluorescence, coculture studies, and imaging techniques to reveal that sustained mild hypoxia via the CX3CR1-CX3CL1 (CX3C motif chemokine receptor 1/chemokine [CX3C motif] ligand 1) signaling pathway influences cell-specific neuroinflammatory interactions, contributing to heterogeneity in CCM severity.

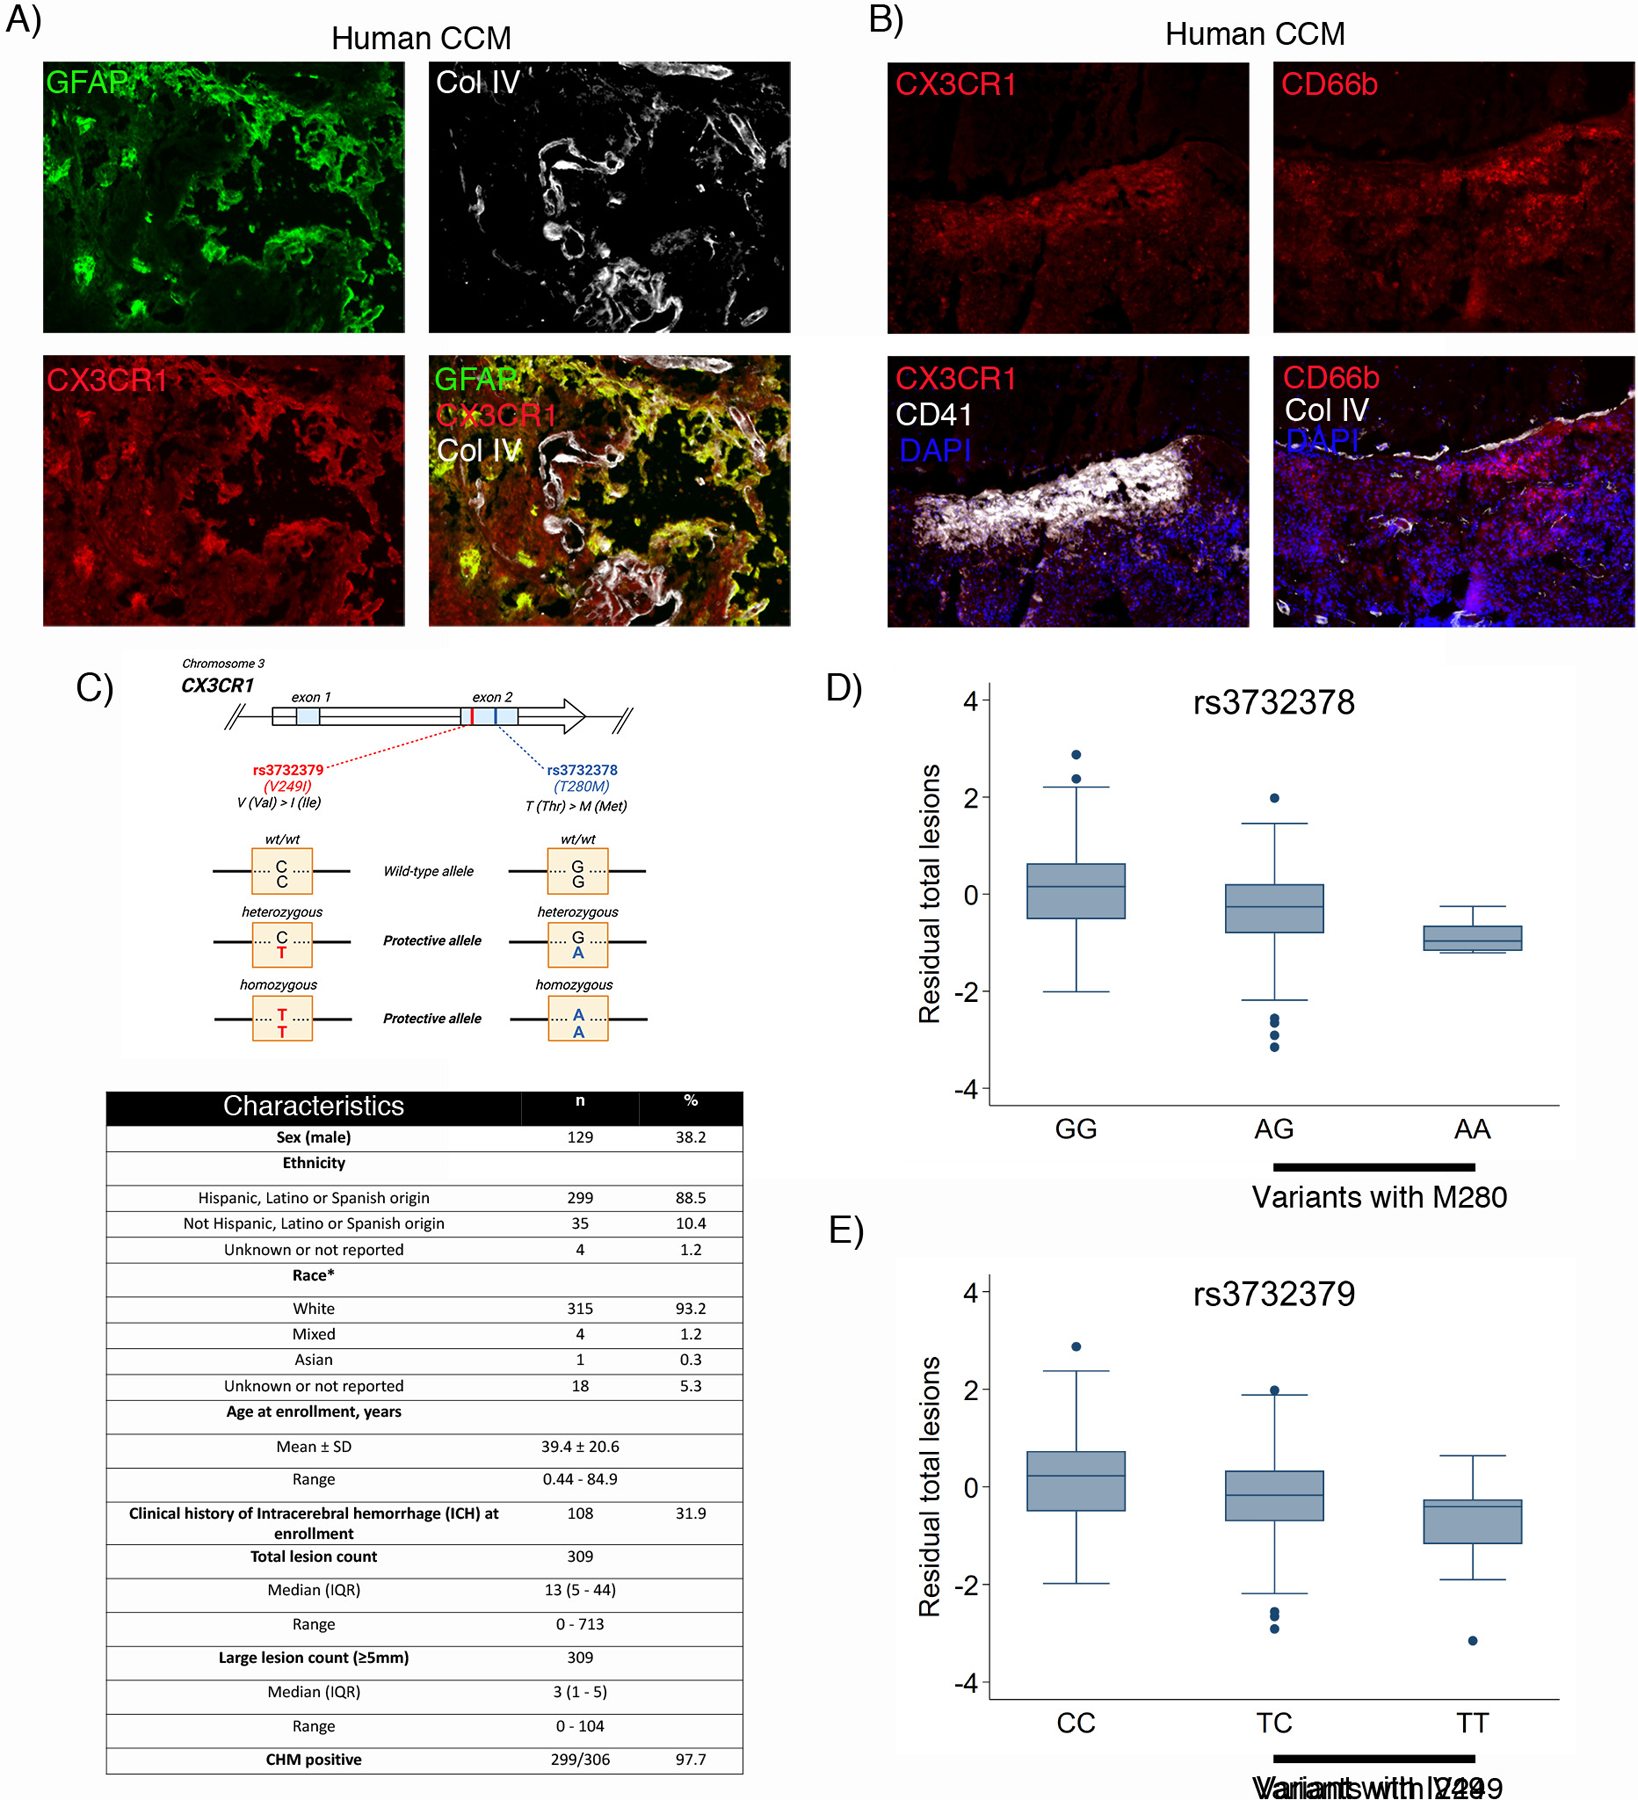
Results: Histological and expression profiles of CCM neurovascular lesions (Slco1c1-iCreERT2;Pdcd10fl/fl; Pdcd10BECKO) in male and female mice found that sustained mild hypoxia (12% O2, 7 days) accelerates CCM disease. Our findings indicate that a small reduction in oxygen levels can significantly increase angiogenesis, neuroinflammation, and thrombosis in CCM disease by enhancing the interactions between endothelium, astrocytes, and immune cells. Our study indicates that the interactions between CX3CR1 and CX3CL1 are crucial in the maturation of CCM lesions and propensity to CCM immunothrombosis. In particular, this pathway regulates the recruitment and activation of microglia and other immune cells in CCM lesions, which leads to lesion growth and thrombosis. We found that human CX3CR1 variants are linked to lower lesion burden in familial CCMs, proving it is a genetic modifier in human disease and a potential marker for aggressiveness. Moreover, monoclonal blocking antibody against CX3CL1 or reducing 1 copy of the Cx3cr1 gene significantly reduces hypoxia-induced CCM immunothrombosis.

Conclusions: Our study reveals that interactions between CX3CR1 and CX3CL1 can modify CCM neuropathology when lesions are accelerated by environmental hypoxia. Moreover, a hypoxic environment or hypoxia signaling caused by CCM disease influences the balance between neuroinflammation and neuroprotection mediated by CX3CR1-CX3CL1 signaling. These results establish CX3CR1 as a genetic marker for patient stratification and a potential predictor of CCM aggressiveness.

Keywords: genetic markers; hemangioma, cavernous, central nervous system; hypoxia; neuroinflammatory diseases; thromboinflammation.


Conflict of interest statement

Disclosures None.

Figures

Figure 1.
Figure 1.. Hypoxia accelerates CCM lesion formations.
A, Experimental protocol: endothelial-specific inactivation of murine Pdcd10 (Pdcd10ECKO) or Krit1 (Krit1ECKO) by tamoxifen injection at P1, P2, P3 and hindbrains were analyzed at P9(Pdcd10ECKO) or P10 (Krit1ECKO). Mice were exposed to sustained mild hypoxic conditions (12% O2, two days) or under normoxic conditions (21% O2). B, Increased area of lesions (micro CT image in red) is present in a representative image of cerebellum of P9 Pdcd10ECKO mice following 2 days hypoxia (12% O2, from P7 to P9) when compared to Pdcd10ECKO mice under normoxia. C, Lower panel, quantification of lesion (micro CT image in red) volumes by micro-CT analysis from mice in upper panel. Data are mean ± SEM, n=10 mice in each group. ***, P<0.001. D, Increased area of lesions is present in a representative image of the cerebellum of P10 Krit1ECKO mice following 2 days hypoxia (12% O2, from P8 to P10) when compared to Krit1ECKO mice under normoxia condition. E, Lower panel, quantification of lesion volumes by micro-CT analysis from mice in upper panel. Data are mean ± SEM, n= 8 or 11 mice in each group. *, P<0.05. F, Histological analysis of brain sections from P9 Pdcd10ECKO mice under hypoxic (12% O2, from P7 to P9) and normoxic conditions. Multiple CCM lesions detected in sections stained by hematoxylin and eosin (pink). In consecutive sections, CCM lesions spatially developed on fibrous astrocyte areas positive for GFAP immunostaining (red). Dramatic vascular dilation is shown by isolectin B4 (IB4; green) surrounded by increased expression of VEGF (black) by ISH. Scale bar is 500 µm. G, High magnification of CCM lesions under mild hypoxia stained by ISH for VEGF (purple) combined with immunohistochemistry to identify GFAP positive astrocytes (red). n=6 or 7 mice in each group. Scale bars: 500 µm (f and g).
Figure 2.
Figure 2.. Hypoxia accelerates CCM lesion through angiogenesis and inflammation signaling pathways.
A, Prominent lesions (micro CT images in red) rapidly worsen in the cerebrum and cerebellum of P50 Pdcd10BECKO mice following seven days of sustained mild hypoxic conditions (12% O2) when compared to Pdcd10BECKO mice under normoxic conditions (21% O2). Lower panel, quantification of brain lesion volumes by micro-CT analysis. Data are mean ± SEM, n = 17 or 18 mice in each group. **, P<0.01. B, VEGF levels in plasma from Pdcd10BECKO mice and littermate Pdcd10fl/fl controls under sustained mild hypoxic or normoxic conditions, as assessed by ELISA. n = 5 or 11 mice in each group. Data are mean ± SEM. **, P<0.01, ***, P<0.001. C, Top pathway enrichment analysis for Pdcd10BECKO brain tissue under normoxic and sustained mild hypoxic conditions. Pdcd10fl/fl under sustained mild hypoxic or normoxic conditions were used as controls. n = 3 or 4 mice in each group. D, List of the top 57 genes differentially expressed in Pdcd10BECKO brain tissue under sustained mild hypoxia. Changes in transcript level in Pdcd10BECKO brain tissue under normoxic or hypoxia conditions are indicated. The P Value shown is adjusted P Value by FDR (False Discovery Rate). n = 3 or 4 mice in each group.
Figure 3.
Figure 3.. Hypoxia induces thrombosis in CCM disease.
A, Histopathology images show brain microthrombi (Black arrows indicate old fibrin, and white arrowhead indicate mature fibrin) in sustained mild hypoxia Pdcd10BECKO sections stained by OMSB (dark red=mature fibrin, blue=old fibrin, bright red=red cells). B-C, Quantification of thrombus size and area present in Pdcd10BECKO brain sections in a. n= 6 mice in each group. D, Histopathology images show brain microthrombi (arrows) in human CCM lesions stained by MSB. Human CCM lesion-free brain tissue is matched to the CCM patient brain tissue. E-F, Partial platelet depletion by IP administration of anti-CD41 antibody (2 mg/kg) or IgG control (2 mg/kg). Quantification of thrombus size and number present in Pdcd10BECKO brain sections stained by OMSB. n= 6 mice in each group. Data in C are mean ± SEM. *, P<0.05. Scale bar: 50 µm (a and d).
Figure 4.
Figure 4.. Reactive astrocytes with inflammatory signature in CCM disease.
A, Differential gene expression analysis of RNA-seq from translated mRNAs obtained from ribosomes in astrocytes from Pdcd10BECKO;Aldh1l1-EGFP/Rpl10a under hypoxic and normoxic conditions. Pdcd10fl/fl;Aldh1l1-EGFP/Rpl10a under hypoxic and normoxic conditions were used as controls (FDR < 0.05). n = 4 or 7 mice in each group. B, Top pathway enrichment analysis from translated mRNAs obtained from ribosomes in astrocytes from a. C, List of the top 50 up- or down-regulated genes from translated mRNAs obtained from ribosomes in astrocytes from Pdcd10BECKO;Aldh1l1-EGFP/Rpl10a under hypoxic conditions. The P Value shown is adjusted P Value by FDR (False Discovery Rate). n = 4 or 7 mice in each group. D, Transcriptional signature of reactive astrocytes with neuroinflammatory capacity.
Figure 5.
Figure 5.. Hypoxia acts as an accelerant in the CCM endothelium and increases CX3CR1-CX3CL1 signaling.
A, Differential gene expression analysis of RNA-seq from fresh isolated brain endothelial cells from Pdcd10BECKO;Aldh1l1-EGFP/Rpl10a under hypoxic and normoxic conditions. Pdcd10fl/fl;Aldh1l1-EGFP/Rpl10a under hypoxic and normoxic conditions were used as controls (FDR < 0.05). Pdcd10fl/fl;Aldh1l1-EGFP/Rpl10a in normoxia and hypoxia, n = 4, Pdcd10fl/fl;Aldh1l1-EGFP/Rpl10a in normoxia, n = 4, Pdcd10BECKO;Aldh1l1-EGFP/Rpl10a in hypoxia, n= 5, B, Analysis of inflammation-related transcripts in normoxia and hypoxia. C, Bubble plot of the top pathway enrichment analysis from mRNAs obtained from fresh isolated brain endothelial cells in normoxia and hypoxia. P values are scaled from lower (red) to higher (blue) values. Bubble size represents the count of genes per term. The P Value shown is adjusted P Value by FDR (False Discovery Rate). D, Circos plots representing ligand-receptor analysis of outgoing signaling (ligand) from CCM endothelium (red) to incoming signaling (receptor) to reactive astrocytes (blue), in normoxia (top) and hypoxia (bottom). Arrows point to CX3CR1-CX3CL1 interactions.
Figure 6.
Figure 6.. CX3CR1 genotypes and CCM lesion burden in familial CCM patients from the Brain Vascular Malformation Consortium (BVMC) study.
A, Immunofluorescence staining shows colocalization between GFAP-positive astrocytes (green) and CX3CR1 (red) around human CCM lesions. Collagen IV label extracellular matrix of brain endothelium (white). Scale bar is 200 µm. B, Immunofluorescence staining of CX3CR1 (red), CD41-positive platelets (white), and in serial section the immunofluorescence staining of CD66b-positive neutrophils (red), and collagen IV that label extracellular matrix of brain endothelium (white) in human CCM lesions. DAPI staining (blue) was used to reveal nuclei. Scale bar is 200 µm (A and B). C Schematic representation of human CX3CR1 gene on chromosome 3 and general characteristics of familial CCM patients included in this study (n=338). D, CX3CR1 rs3732378 missense variant (Thr280Met). GG genotype corresponds to wild-type allele (non-variant). G-to-A substitution changed Thr280 to Met (M280). CX3CR1, T280M, rs3732378 G>A, frequency = 0.15, BetaT280M=−0.5, 95% Confidence Interval= −0.71 to −0.29, P=3.7X10⁻⁶. The reference group is being compared to carriers of one or both copies of the minor allele. E, CX3CR1 rs3732379 missense variant (Val249Ile). CC genotype corresponds to wild-type allele (non-variant). C-to-T substitution changed Val249 to Ile (I249). CX3CR1, V249I, rs3732379 C>T, frequency = 0.23, BetaV249I=−0.4, 95% Confidence Interval= −0.60 to −0.24, P=7X10⁻⁶. The reference group is being compared to carriers of one or both copies of the minor allele.
Figure 7.
Figure 7.. Increased inflammatory microglia activity in CCM brain tissue and anti-CX3CL1 blocking antibody attenuates migration of CX3CR1+ cells.
A, FACS of isolated microglia (sorted CD45int, CD11b+, Ly6C) and mRNA expression determine by qRT-PCR in Pdcd10BECKO and Pdcd10fl/fl littermates control brains. n= 4 mice in each group.B-C, FACS and histological analysis of ROS activation in microglia, peripheral inflammatory cells and brain tissue. n= 3 mice in each group. Asterisks denote vascular lumen of CCM lesions. D, Isolation and differentiation of BM-derived CX3CR1+ cells. E, Cx3cl1 mRNA expression by qRT-PCR in CCM-like reactive astrocytes in culture. F, BM-derived CX3CR1+ cells migration assay in CCM-like reactive astrocytes and CX3CR1+ cells pre-treated with CX3CL1 blocking antibody compared to IgG-treated CCM-like reactive astrocytes and CX3CR1+ cells. n= 3 in each group. Data are mean ± SEM. *, P<0.05, **, P<0.01,***, P<0.001. Scale bar: 50 µm.
Figure 8.
Figure 8.. Blocking antibodies against CX3CL1 or loss of one copy of the Cx3Cr1 gene decreases CCM immunothrombosis.
Analysis and quantification of the area and a number of thrombi in lesions per mm2 in P50 Pdcd10BECKO mice treated with monoclonal blocking antibodies against CX3CL1 (CX3CL1 Ab) or IgG control (Control Ab) following seven days of sustained mild hypoxic conditions (12% O2). A, Brain microthrombi sections stained by OMSB. B, Immunofluorescence for CX3CR1+ cells (green), leukocyte recruitment CD45+ (red) forming thrombus in the vascular lumen. Endothelium visualized using isolectin B4 (IB4; white). C, Analysis and quantification of thrombus area (left) and thrombus number per mm2 (right) in stage 1 (single cavernous) lesions. D, Analysis and quantification of thrombus area (left) and thrombus number per mm2 (right) in stage 2 (multi-cavernous) lesions. All data are mean ± SEM, CX3CL1 Ab-treated n = 13; Control Ab-treated mice, n = 13. Analysis and quantification of the area and a number of thrombi in lesions per mm2 in P50 Pdcd10BECKO;Cx3Cr1KO/wt (Pdcd10BECKO;Cx3Cr1−/+) and Pdcd10BECKO;Cx3Cr1wt/wt (Pdcd10BECKO;Cx3Cr1+/+) brains following seven days of sustained mild hypoxic conditions (12% O2). E, Brain microthrombi sections stained by OMSB. F, Serial section from a using immunofluorescence for CD41+ platelet cells (green) forming thrombus in the vascular lumen. Endothelium visualized using isolectin B4 (IB4; red) (n=4). C, CCM reactive GFAP+ astrocytes (red) are mainly positive to CX3CR1 (green) staining in Pdcd10BECKO;Cx3Cr1+/+ brains when compared to Pdcd10BECKO;Cx3Cr1−/+ brains. G, Leukocyte recruitment CD45+ (red) and co-localization with CX3CR1 staining (green) constitute the more significant number of cells in lesions in Pdcd10BECKO;Cx3Cr1+/+ brains when compared to Pdcd10BECKO;Cx3Cr1−/+ brains. Asterisk indicate lumen of CCM lesions. H, Analysis and quantification of thrombus area (left) and thrombus number per mm2 (right) in stage 1 (single cavernous) lesions. I, Analysis and quantification of thrombus area (left) and thrombus number per mm2 (right) in stage 2 (multi-cavernous) lesions. All data are mean ± SEM, Pdcd10BECKO;Cx3Cr1−/+, n = 12; Pdcd10BECKO;Cx3Cr1+/+mice, n = 11. *, P<0.05, **, P<0.01 Scale bars: 250 µm (A) 100 µm (B, and F), and 25 µm (G).

References

    1. Spiegler S, Rath M, Paperlein C, Felbor U. Cerebral Cavernous Malformations: An Update on Prevalence, Molecular Genetic Analyses, and Genetic Counselling. Mol Syndromol 2018;9:60–69. doi: 10.1159/000486292 - DOI - PMC - PubMed
    1. Fischer A, Zalvide J, Faurobert E, Albiges-Rizo C, Tournier-Lasserve E. Cerebral cavernous malformations: from CCM genes to endothelial cell homeostasis. Trends Mol Med 2013;19:302–308. doi: 10.1016/j.molmed.2013.02.004 - DOI - PubMed
    1. Lai CC, Nelsen B, Frias-Anaya E, Gallego-Gutierrez H, Orecchioni M, Herrera V, Ortiz E, Sun H, Mesarwi OA, Ley K, et al. Neuroinflammation Plays a Critical Role in Cerebral Cavernous Malformation Disease. Circ Res 2022;131:909–925. doi: 10.1161/CIRCRESAHA.122.321129 - DOI - PMC - PubMed
    1. Leblanc GG, Golanov E, Awad IA, Young WL, Biology of Vascular Malformations of the Brain NWC. Biology of vascular malformations of the brain. Stroke. 2009;40:e694–702. doi: 10.1161/STROKEAHA.109.563692 - DOI - PMC - PubMed
    1. Gore AV, Lampugnani MG, Dye L, Dejana E, Weinstein BM. Combinatorial interaction between CCM pathway genes precipitates hemorrhagic stroke. Dis Model Mech 2008;1:275–281. doi: 10.1242/dmm.000513 - DOI - PMC - PubMed

Publication types

MeSH terms