Review
. 2025 May;298(2):219-231.
doi: 10.1111/jmi.13306. Epub 2024 Apr 25.

MINFLUX nanoscopy: Visualising biological matter at the nanoscale level

[Article in Italian]
Affiliations
Review

MINFLUX nanoscopy: Visualising biological matter at the nanoscale level

[Article in Italian]
Alexander Carsten et al. J Microsc. 2025 May.

Abstract

Since its introduction in 2017, MINFLUX nanoscopy has shown that it can visualise fluorescent molecules with an exceptional localisation precision of a few nanometres. In this overview, we provide a brief insight into technical implementations, fluorescent marker developments and biological studies that have been conducted in connection with MINFLUX imaging and tracking. We also formulate ideas on how MINFLUX nanoscopy and derived technologies could influence bioimaging in the future. This insight is intended as a general starting point for an audience looking for a brief overview of MINFLUX nanoscopy from theory to application.

Keywords: MINFLUX; single molecule tracking; super‐resolution microscopy.


Conflict of interest statement

The authors declare no conflict of interest.

Figures

FIGURE 1
FIGURE 1
MINFLUX imaging and tracking principles. The green dots represent the targeted coordinates to which the excitation minimum of the doughnut shaped excitation beam is targeted. The yellow stars represent fluorophores in their on‐state. Adapted from Ref. (27). (A) 2D‐MINFLUX imaging. During 2D‐MINFLUX imaging the laser beam, depicted in red, is moved iteratively in a hexagonal pattern towards the fluorophore. After each iteration, the fluorophore can be targeted more precisely based on calculations of the collected photons of the previous iteration. Consequently, the scanning coordinate patterns diameter L is reduced and recentred towards the fluorophore in subsequent iterations. (B) 3D‐MINFLUX imaging. During 3D‐MINFLUX imaging first the xy position and then the z position is targeted during each iteration. Here, the location of the fluorophore is singled out by a bottle‐beam shaped excitation laser guided to coordinated in an octahedronal shape. The bottle‐beam shaped excitation laser is shown in an xz‐view. Adapted from Ref. (31). (C) 2D‐MINFLUX tracking. During tracking, the doughnut‐shaped excitation beam is scanned towards a set of coordinates, following the movement of the single fluorescent molecule.
FIGURE 2
FIGURE 2
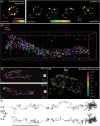
Selection of published MINFLUX imaging and tracking applications in biological samples. (A) xy‐ and xyz‐view of the SNAP‐tag labelled nuclear pore complex protein Nup96 recorded with 3D‐MINFLUX imaging. Scale bar: 200 nm. (B) 3D DNA‐PAINT MINFLUX multiplexing of mitochondrial proteins TOM70, Mic60 and ATP5B. The size of the bounding box is 3.4 × 1 × 0.6 µm3. (C) xz‐ and yz‐views of rod ribbon active zone proteins Rim2 (magenta) and Bassoon (green) stained using 3D‐MINFLUX nanoscopy. The grey square box has an edge with a length of 100 nm. (D) xy‐view of the Halo‐tag labelled type three secretion system component YscL in Yersinia enterocolitica using 3D‐MINFLUX nanoscopy. The white boxed area has a depth of 200 nm along the x‐axis. (E) 3D‐MINFLUX tracks of kinesin in live U2OS cells in xy‐ and xz‐ view. Scale bar: 100 nm.
FIGURE 3
FIGURE 3
Workflow to guide researchers towards MINFLUX imaging of single molecules in cells. The workflow is exemplary for a microbiological research question. Adjustments might be necessary especially for Step 1 (Genetic modifications). GMO: genetically modified organism; MEA: mercaptoethylamine. Created with BioRender.com. Source: Ref. (66).

References

    1. Hartschuh, A. , Pedrosa, H. N. , Novotny, L. , & Krauss, T. D. (2003). Simultaneous fluorescence and Raman scattering from single carbon nanotubes. Science, 301(5638), 1354–1356. - PubMed
    1. Lin, H. J. , Herman, P. , & Lakowicz, J. R. (2003). Fluorescence lifetime‐resolved pH imaging of living cells. Cytometry A, 52(2), 77–89. - PMC - PubMed
    1. Renz, M. (2013). Fluorescence microscopy‐a historical and technical perspective. Cytometry A, 83(9), 767–779. - PubMed
    1. Amos, W. B. , & White, J. G. (2003). How the confocal laser scanning microscope entered biological research. Biology of the Cell, 95(6), 335–342. - PubMed
    1. Denk, W. , Strickler, J. H. , & Webb, W. W. (1990). Two‐photon laser scanning fluorescence microscopy. Science, 248(4951), 73–76. - PubMed

Substances

LinkOut - more resources