. 2024 Jul 1;221(7):e20231814.
doi: 10.1084/jem.20231814. Epub 2024 Apr 25.

Dual fluorescence reporter mice for Ccl3 transcription, translation, and intercellular communication

Affiliations

Dual fluorescence reporter mice for Ccl3 transcription, translation, and intercellular communication

Maria Belen Rodrigo et al. J Exp Med. .

Abstract

Chemokines guide immune cells during their response against pathogens and tumors. Various techniques exist to determine chemokine production, but none to identify cells that directly sense chemokines in vivo. We have generated CCL3-EASER (ErAse, SEnd, Receive) mice that simultaneously report for Ccl3 transcription and translation, allow identifying Ccl3-sensing cells, and permit inducible deletion of Ccl3-producing cells. We infected these mice with murine cytomegalovirus (mCMV), where Ccl3 and NK cells are critical defense mediators. We found that NK cells transcribed Ccl3 already in homeostasis, but Ccl3 translation required type I interferon signaling in infected organs during early infection. NK cells were both the principal Ccl3 producers and sensors of Ccl3, indicating auto/paracrine communication that amplified NK cell response, and this was essential for the early defense against mCMV. CCL3-EASER mice represent the prototype of a new class of dual fluorescence reporter mice for analyzing cellular communication via chemokines, which may be applied also to other chemokines and disease models.


Conflict of interest statement

Disclosures: C. Martin-Higueras reported personal fees from Novo Nordisk and Arbor Biotechnologies outside the submitted work. No other disclosures were reported.

Figures

None
Graphical abstract
Figure 1.
Figure 1.
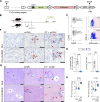
Deletion of Ccl3-producing cells aggravates mCMV infection. (A) Schematic representation of knock-in construct designed to tag endogenous Ccl3 with Venus, report of Ccl3 promotor activity via tdTomato expression, and DTR-mediated deletion of Ccl3-expressing cells. (B) Scheme of the experiment. C57BL6/J (BL6) and CCL3-EASER mice were treated with DT or PBS. 1 day later, mice were infected with mCMV and analyzed at the indicated time points. (C) Representative contour (left) and dot plots (right) of liver-associated leukocytes of CCL3-EASER mice treated as indicated. 1 day later, liver leukocytes were analyzed by flow cytometry. (D) Quantification of C. (E) Viral load of PBS- or DT-treated CCL3-EASER and BL6 mice 4 and 7 days after infection. (F) Bright-field microscopy images showing 8 µm liver sections stained with mAB Croma101 directed against mCMV IE1 4 days after infection. Red arrowheads indicate mCMV positive cells. Scale bar 50 µm. (G) Histopathological evaluation of paraffin-embedded liver tissue sections stained with hematoxylin-eosin 4 days after mCMV infection. Red arrowheads indicate immune infiltration. Scale bar 100 µm. Images were acquired as tile scans with 20× magnification and automatic stitching with 5% overlap using ZEN Blue software. Data in D–E are presented as mean ± SD. Each symbol represents individual mice. Shown is one representative of at least two independent experiments. Statistical difference was assessed by unpaired nonparametric Mann–Whitney U-test: *P < 0.05, **P < 0.01, ***P < 0.001, ****P < 0.0001. Data in D–F are representative of three mice per group of two independent experiments. n.s. stands for not statistically significant; d.p.i., days post infection; CV, central vein; PV, portal vein.
Figure S1.
Figure S1.
DT-treated CCL3-EASER mice are more susceptible to mCMV infection. (A) Scheme of the experiment. C57BL6/J (BL6) and CCL3-EASER mice were treated with DT or PBS, and infected 1 day later with mCMV. (B) Survival plot of PBS- or DT-treated CCL3-EASER and BL6 mice. (C) Relative body weight of the indicated mice. (D) mCMV genome counts in liver, spleen, and lung at 14 days after infection. (E) Liver mCMV viral titer at 14 days after infection. Data shows mean ± SD is representative of at least three mice per group.
Figure 2.
Figure 2.
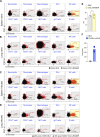
CCL3-EASER identified NK cells as the major producers of Ccl3. BL6 and CCL3-EASER mice were infected with 5 × 10⁵ PFU of mCMV and analyzed at 0, 4, 8, 16, and 48 h after infection (n = 4 mice per time point). (A) Representative overlapped dot plots of the indicated cell populations of liver-associated leukocytes from naive BL6 (black) and naive CCL3-EASER (red) mice. (B) Frequency of the indicated cell populations from total Ccl3-tdTomato+ cells in spleen, liver, and lung from naive EASER mice. Calculated as the percentage within tdTomato positive population. (C) Representative overlapped dot plots of the indicated cell populations of liver-associated leukocytes from mCMV infected BL6 (black) and infected CCL3-EASER (red) mice. (D) Frequency of the indicated cell populations from total Ccl3-tdTomato+ cells from spleen, liver, and lung before and after mCMV infection, calculated as in B. Data is presented as means ± SD and is representative of four mice per group for two independent experiments. DC, dendritic cells.
Figure S2.
Figure S2.
Further details on Ccl3-tdTomato transcription. (A and B) Representative overlapped dot plots of the indicated cell populations of spleen (A) and lung (B) associated leukocytes from naive BL6 (black) and naive CCL3-EASER (red) mice presented in Fig. 2. (C and D) Representative overlapped dot plots of the indicated cell populations of spleen (C) and lung (D) associated leukocytes from mCMV-infected BL6 (black) and infected CCL3-EASER (red) mice presented in Fig. 2. (E) Ccl3 transcription in liver NK cells determined by RT-qPCR from naive BL6 and homozygous CCL3-EASER mice. (F) Ccl3-protein quantification by ELISA from liver NK cells from naive BL6 mice. Positive control: Activated NK cells from mCMV-infected BL6. DC, dendritic cells; gdT cells, γδ T cells.
Figure 3.
Figure 3.
NK cells reduced the viral load on DT-treated CCL3-EASER mice. (A) Scheme of the experiment. CCL3-EASER mice received 25 ng/g/BW of DT or PBS i.p. on two consecutive days to delete Ccl3-producing cells. 1 day later, leukocytes of the indicated organs were analyzed by flow cytometry. (B) Count of the indicated cell populations in liver, spleen, and lung. (C) Scheme of the experiment. After DT or PBS administration, mice were infected i.v. with mCMV and were partially reconstituted with CD45.1 splenic NK cells. Mice were analyzed 4 days after infection. (D) Representative contour plots indicating the presence of CD45.1 NK cells in the liver after adoptive cell transfer 4 days after infection. (E) Viral load of control or depleted CCL3-EASER mice 4 days after mCMV infection, from the same organs analyzed in D. Data is presented as means ± SD; n = 4 mice per group. Data is representative of two independent experiments. Unpaired nonparametric Mann–Whitney U-test was used: ns, not significant; *P < 0.05; **P < 0.01; ***P < 0.001; ****P < 0.0001.
Figure 4.
Figure 4.
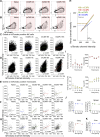
Ccl3 organ-specific posttranscriptional fine-tuning during mCMV. (A) Scheme of the experiment. CCL3-EASER mice were infected with 5 × 10⁵ PFU of mCMV at the indicated time points and analyzed together at time “0.” Isolated leukocytes were stimulated in vitro in the presence of monensin and brefeldin A for 4 h. (B) Representative contour plots from CCL3-EASER liver NK cells at 0 (naive), 4, 8, and 16 h after mCMV infection. The red shaded boxes indicate tdTomato-positive cells. (C) Frequency of tdTomato-positive cells from total NK cells. (D) Kinetic of Ccl3-promotor activity evaluated with tdTomato MFI. (E) Frequency of Venus-positive cells from total NK cells. (F) Dynamics of Ccl3-protein expression evaluated with Venus MFI. (G) Representative XY plots of Venus and tdTomato channel intensity from liver NK cells gated on tdTomato-positive cells (as shown in A) at 0 (naive), 4, 8, and 16 h after mCMV infection. Dotted lines represent the simple linear regression of the correlation between Venus and tdTomato channel intensity. Linear regression is color coded according to the time point of infection: gray = 0 h (naive), blue = 4 h, green = 8 h, and red = 16 h. (H) Comparison of simple linear regression from liver, spleen, and lung. Color code as described in G. Black dotted line indicates tdT50: point of half of tdTomato channel intensity from the control group (naive). Data is presented as mean ± SD; n = 3 mice per group; and representative of two independent experiments. In C–F, data is shown as mean ± SD. Ordinary one-way ANOVA with multiple comparisons to naive group was used: *P < 0.05; **P < 0.01; ***P < 0.001. In G, correlation test was used, two-tailed P value, Pearson r with 95% confidence interval.
Figure S3.
Figure S3.
Posttranscriptional fine-tuning of Ccl3 during mCMV infection. (A and B) Representative contour plots from CCL3-EASER spleen (A) and lung (B) NK cells from mice infected with mCMV and analyzed at the indicated time point and presented in Fig. 4. The red shaded boxes indicate tdTomato-positive cells. (C and D) Representative XY plots of Venus and tdTomato channel intensity from spleen (C) and lung (D) NK cells gated on tdTomato-positive cells (as shown in A and B, respectively). The dotted lines represent the simple linear regression of the correlation between Venus and tdTomato channel intensity. Linear regression is color-coded according to the time point after infection: gray = 0 h (naive), blue = 4 h, green = 8 h, and red = 16 h. (E–G) Representative XY plots of Venus and tdTomato channel intensity from liver (E), spleen (F), and lung (G) monocytes gated on tdTomato-positive cells from mice treated as described in Fig. 4. Linear regression is color-coded as described in C and D. (H) Comparison of simple linear regression from lung monocytes. Color-coded as described in C and D. Black dotted line indicates tdT50: point of half tdTomato channel intensity obtained from the naive group. (I) Frequency and MFI of tdTomato (top panels) and Venus (bottom panels) expression in monocytes during mCMV infection. (J) Viral transcripts determined from liver, spleen, and lungs from the same mice analyzed in E–I. Viral E1 transcripts were quantified by RT-qPCR. The absolute values were normalized to 107 β-actin transcripts. (K) Viral genomes from liver samples in J. Absolute quantification assessed via normalization with 1 × 10⁶ cellular genomes (gB/M55 per 1 × 10⁶ PTHrP). Data is presented as mean ± SD; n = 3 mice per group. Statistical analysis was assessed by ordinary one-way ANOVA with Tukey’s post-test to naive group was used: *P < 0.05. In C–G, correlation test was used, two-tailed P value, Pearson r with 95% confidence interval.
Figure 5.
Figure 5.
Type I IFN influences Ccl3 production during mCMV. (A) Scheme of the experiment. Heterozygous CCL3-EASER mice were i.v. infected with WT Smith- or ∆m157-mCMV and analyzed 16 h after infection. Ccl3 promotor and transcriptional activities of NK cell were analyzed by flow cytometry according to tdTomato and Venus signals, respectively, after 4 h of in vitro stimulation in the presence of monensin and brefeldin A. (B) Frequency of tdTomato+ NK cells from WT Smith- or ∆m157-infected CCL3-EASER mice and tdTomato MFI. (C) Frequency of Venus+ NK cells from WT Smith- or ∆m157-infected CCL3-EASER mice and Venus MFI. (D) Scheme of the experiment. Homozygous CCL3-EASER mice were i.p. treated with 200 µg of anti-IFNAR-1 antibody (clone MAR1-5A3) or irrelevant isotype control. 1 h later, mice were infected i.v. with mCMV and analyzed as previously described in A. (E) Frequency of tdTomato+ NK cells from isotype- or IFNAR-1–treated CCL3-EASER mice and tdTomato MFI. (F) Frequency of Venus+ NK cells from isotype- or IFNAR-1–treated CCL3-EASER mice and Venus MFI. (G) Representative XY plots of Venus and tdTomato channel intensity of liver NK cells gated on tdTomato-positive cells. Dotted lines represent the simple linear regression of the correlation between Venus and tdTomato channel intensity (gray: isotype; orange: IFNAR-1). (H) Comparison of linear regression from isotype- or IFNAR-1–treated CCL3-EASER mice. Color code as described in G. Black dotted line indicates tdT50: point of half of tdTomato channel intensity from the isotype control group. In B, C, E, and F, data is presented as mean ± SD and representative of at least three mice per group of two independent experiments. Each experiment is indicated with different symbols within the column plots: (1) circles, (2) triangles. Unpaired nonparametric Mann–Whitney U-test was used: ns, not significant; *P < 0.05; **P < 0.01; ***P < 0.001. In G correlation test was used, two-tailed P value, Pearson r with 95% confidence interval.
Figure S4.
Figure S4.
IFN-I directly influences Ccl3 protein expression in NK cells. (A) Scheme of the experiment. Same experiment as in Fig. 5 was performed with homozygous CCL3-EASER mice. (B) Frequency of tdTomato+ NK cells from WT Smith- or ∆m157-infected CCL3-EASER mice and tdTomato MFI. (C) Frequency of Venus+ NK cells from WT Smith- or ∆m157-infected CCL3-EASER mice and Venus MFI. Each symbol represents a single mouse. Statistical differences were analyzed by unpaired nonparametric Mann–Whitney U-test. ns, not significant. (D) Naive EASER-NK cells were cultured in the presence of mrIL-2 and stimulated for 4 h with 100 U/ml of mrIFNb as indicated. After incubation, MFI of tdTomato and Venus signals were evaluated by flow cytometry. Each symbol represents one mouse. Paired non-parametric Wilcoxon test was used: ns, not significant; *P < 0.05.
Figure 6.
Figure 6.
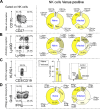
mMCV infection induces Ccl3 regardless of NK cell subsets. (A–D) CCL3-EASER mice were infected i.v. with mCMV and analyzed by flow cytometry 16 h after infection. Ccl3-protein expression of liver NK cells was analyzed by flow cytometry according to Venus+ signal, after 4 h of in vitro stimulation in the presence of monensin and brefeldin A. NK cells were defined considering the following markers: NK1.1+CD3DX5+CD49aCXCR6. Analysis of Ccl3 protein expression was performed in naive and mCMV-infected CCL3-EASER mice. In every case, on the left: representative contour plots of subsets analyzed; on the right: pie charts indicating the frequency of Venus expression from total NK cells. NK cells were subdivided according to: (A) NK cell status of maturation based on the expression of CD11b and CD27 markers; (B) expression of Ly49H and -D activation receptors; (C) expression of KLRG1 receptor; and (D) production of IFNg and Granzyme B (GrzB). Data are presented as mean (in C as mean ± SD) and it is representative of two independent experiments (n = 5 per group). Unpaired nonparametric Mann–Whitney U-test was used: n.s., not significant; *P < 0.05.
Figure 7.
Figure 7.
Ccl3 secreted by NK cells was sensed by NK and NKT cells in vitro. Purified NK cells from CCL3-EASER mice were expanded for 6 days with mrIL-2 and cocultured 1:1 for 4 h with possible Ccl3-receiving cells in a 96-well/plate precoated with purified anti-NK1.1 antibody (clone PK136). In all cases, purity of cocultured cells was >85%. (A) Scheme of the experiment. (B–E) Representative contour plots of the coculture of EASER-NK cells with (B) NK/NKT cells; (C) OVA-activated CD4+ OT-II T cells; (D) OVA-activated CD8+ OT-I T cells; and (E) thioglycolate elicited peritoneal macrophages. EASER-NK cells are indicated with an orange-shadowed gate, Ccl3 recipients with a gray-shadowed gate (exceptionally, recipient NK cells are indicated with a blue-shadowed gate, and NKT cells with a light-blue-shadowed gate), Venus+ cells with a green-shadowed gate; tdTomato+ cell with a red-shadowed gate; and tdTomato+Venus+ cells with a yellow-shadowed gate. (F) Transmigration assay of CD45.1 WT NK cells (top chamber) toward CD45.2 EASER-NK cells activated with plate-bound anti-NK1.1 mAb (bottom chamber) (panel 1). Ccl3-Venus production control and Venus/tdTomato negative control cultures are shown in panels 2 and 3, respectively. Venus uptake control in panel 4. Representative dot plots indicate gating of: EASER-NK cells (orange-shadowed gate) and non-reporter CD45.1 NK cells (blue-shadowed gate), Venus+ cells with a green-shadowed gate, tdTomato+ cell with a red-shadowed gate, and tdTomato+Venus+ cells with a yellow-shadowed gate. Data in B–E are representative of three independent experiments (n = 3–5 mice per group). Data in F is representative of two independent experiments. BFA, brefeldin A; Mon, monensin.
Figure S5.
Figure S5.
CCL3-EASER NK cell coculture controls. Cocultures presented in Fig. 7 were additionally incubated in the presence of monensin/brefeldin A to set Venus negative gates. (A–D) Representative contour plots of the coculture of EASER-NK cells with: (A) non-reporter NK/NKT cells; (B) OVA-activated CD4 OT-II T cells; (C) OVA-activated CD8 OT-I T cells; (D) thioglycolate elicited peritoneal macrophages. EASER-NK cells are indicated with an orange-shadowed gate, Ccl3-recipients with a gray-shadowed gate (exceptionally, recipient NK cells are indicated with a blue-shadowed gate, and NKT cells with a light-blue-shadowed gate), Venus+ cells with a green-shadowed gate, tdTomato+ cell with a red-shadowed gate, and tdTomato+Venus+ cells with a yellow-shadowed gate. (E) Representative contour plots of EASER-NK cells co-cultured with naive non-reporter NK cells. EASER-NK cells are indicated with an orange-shadowed gate, Ccl3-recipients with a gray-shadowed gate, Venus+ cells with a green-shadowed gate, tdTomato+ cell with a red-shadowed gate, and tdTomato+Venus+ cells with a yellow-shadowed gate. Data representative of three independent experiments (n = 4–5 per group). (F) Transwell assay of non-reporter (BL6) CD45.2 thioglycolate elicited macrophages (top chamber) and CD45.1 EASER-NK cells activated with plate bound anti-NK1.1 mAb (bottom chamber), panel 1. Macrophage Venus/tdTomato-negative control and Ccl3-Venus production control are shown in panels 2 and 3, respectively. Mac, macrophages; BFA, brefeldin A; Mon, monensin.
Figure 8.
Figure 8.
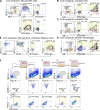
Ccl3 secreted by NK cells crosstalked mainly with NK cells in vivo. (A) Scheme of the experiment. Mixed BM chimeras (panel 1) were infected with mCMV and analyzed ex vivo 16 h after infection. BM chimeras reconstituted solely with non-reporter cells (panel 2) and equally infected with mCMV were used as autofluorescence control for the Venus and tdTomato channels. (B) Representative one-photon intravital microscopy of liver from infected CCL3-EASER mice (see Videos 1 and 2). Red arrowheads indicate tdTomato+ cells, green arrowheads Venus+ cells, yellow arrowheads tdTomato+ Venus+ cells. Scale bar 50 µm. (C) Representative dot plots of Venus single positive (non-reporter) cell populations in liver, spleen, and blood analyzed by flow cytometry ex vivo. Green boxes indicate Venus single positive cells. Data are representative of two independent experiments (n = 5–6 mice per group).

References

    1. Armingol, E., Officer A., Harismendy O., and Lewis N.E.. 2021. Deciphering cell-cell interactions and communication from gene expression. Nat. Rev. Genet. 22:71–88. 10.1038/s41576-020-00292-x - DOI - PMC - PubMed
    1. Bachmann, M.F., Kopf M., and Marsland B.J.. 2006. Chemokines: More than just road signs. Nat. Rev. Immunol. 6:159–164. 10.1038/nri1776 - DOI - PubMed
    1. Bekiaris, V., and Lane P.J.L.. 2010. The localization and migration of natural killer cells in health and disease. Natural Killer Cells. 137–153., 10.1016/B978-0-12-370454-2.00010-7 - DOI
    1. Bernardini, G., Sciumè G., Bosisio D., Morrone S., Sozzani S., and Santoni A.. 2008. CCL3 and CXCL12 regulate trafficking of mouse bone marrow NK cell subsets. Blood. 111:3626–3634. 10.1182/blood-2007-08-106203 - DOI - PubMed
    1. Biolatti, M., Gugliesi F., Dell’Oste V., and Landolfo S.. 2018. Modulation of the innate immune response by human cytomegalovirus. Infect Genet Evol. 64. 105–114. 10.1016/j.meegid.2018.06.025 - DOI - PubMed

Publication types

LinkOut - more resources