Review
. 2024 Apr 30;68(1):41-51.
doi: 10.1042/EBC20230045.

Understanding and computational design of genetic circuits of metabolic networks

Affiliations
Review

Understanding and computational design of genetic circuits of metabolic networks

Alicia Berkvens et al. Essays Biochem. .

Abstract

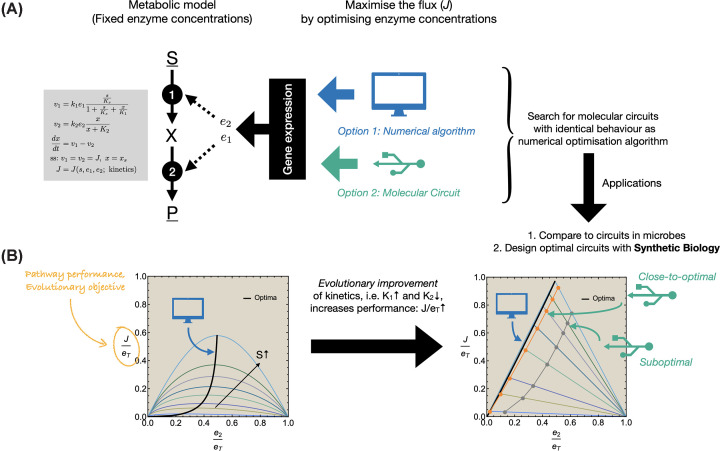
The expression of metabolic proteins is controlled by genetic circuits, matching metabolic demands and changing environmental conditions. Ideally, this regulation brings about a competitive level of metabolic fitness. Understanding how cells can achieve a robust (close-to-optimal) functioning of metabolism by appropriate control of gene expression aids synthetic biology by providing design criteria of synthetic circuits for biotechnological purposes. It also extends our understanding of the designs of genetic circuitry found in nature such as metabolite control of transcription factor activity, promoter architectures and transcription factor dependencies, and operon composition (in bacteria). Here, we review, explain and illustrate an approach that allows for the inference and design of genetic circuitry that steers metabolic networks to achieve a maximal flux per unit invested protein across dynamic conditions. We discuss how this approach and its understanding can be used to rationalize Escherichia coli's strategy to regulate the expression of its ribosomes and infer the design of circuitry controlling gene expression of amino-acid biosynthesis enzymes. The inferred regulation indeed resembles E. coli's circuits, suggesting that these have evolved to maximize amino-acid production fluxes per unit invested protein. We end by an outlook of the use of this approach in metabolic engineering applications.

Keywords: Escherichia coli; gene expression and regulation; mathematical modelling; microbiology.


Conflict of interest statement

The authors declare that there are no competing interests associated with the manuscript.

Figures

Figure 1
Figure 1. Illustration of the maximization of steady-state pathway flux per unit invested protein by optimal gene expression, either with a numerical algorithm or a molecular genetic circuit
(A) Overview of the rationale. We consider a mathematical model of a metabolic network in which an intermediate metabolite X inhibits its own production and stimulates its conversion into end product P. We aim to maximize its steady-state performance (J/eT) as function of an environmental condition (e.g., a nutrient concentration) by optimizing the expression of its enzymes. The optimization can be carried out by an optimization algorithm (symbolized by the computer) or, remarkably, also by a molecular genetic circuit (symbolized by a circuit) that controls the expression of the pathway’s enzymes as a function of one intermediate of the metabolic pathway. (B) Illustration of simulation results. We consider in the left and right figure the relationship between J/eT and e2/eT (with e2 as the concentration of enzyme 2) for different values of the environmental parameter S. The black lines connect the optimal protein fractions, as a function of S. These plots were obtained by calculating the steady state of the network as function of e2 (with e1 = eT - e2) for different values of S. The black line connects the maximal values of J/eT when e2/eT has attained its optimal level. The figure on the right indicates higher maximal values of J/eT; the underlying metabolic network therefore outperforms the network considered in the left figure. The best network differs from the suboptimal network only in two parameter values: the better network has a first enzyme that is inhibited less by X and a second enzyme that has a higher affinity for X. The orange and gray lines in the right figure illustrate the performance of a genetic circuit, which can approximate the optimal behavior (black line) either very well (orange line) or less well (gray line), depending on parameter values in the genetic circuit. See Figure 2 for details on the genetic circuit, and the Appendix for parameter values and more detail.
Figure 2
Figure 2. Ribosomal expression regulation in E. coli by ppGpp approximates growth-rate maximizing behavior
(A) A coarse-grained model of ribosomal gene expression regulation for E. coli. In E. coli ribosomal genes are regulated by the concentration of the molecule ppGpp [46,47]. ppGpp is made by the protein RelA when it is bound to a ribosome with an unloaded tRNA in its A site [48]. This happens under ribosome excess and biosynthetic enzyme-shortage and accordingly ppGpp can bind to RNA polymerase, thereby reducing its affinity for ribosomal promoters and enhancing it for biosynthesis promoters [46,47,49]. This leads to a regulation of the ribosomal activity that aims to keep its saturation with its substrate, loaded tRNAs, fixed. (B) Top figure: the known experimental linear relation between the ribosomal fraction and the growth rate – known as the ‘growth law’ [40,43,50,51] – is reproduced by the model. Middle figure: the model relation between the steady-state ppGpp concentration and the growth rate, which is in qualitative agreement with experimental data. Bottom figure: the dependency of the growth rate and the nutrient concentration agrees with the expected Monod relationship. (C) Model equations of the system shown in (A) that give the data shown in (B). Note that the model is surprisingly simple. A key ingredient is that the rate of ppGpp synthesis by RelA is proportional to 1 - aa/(aa + KR) with aa/(aa + KR) as the saturation level of the ribosome with substrate. As shown in Figure 1B, orange line, changing the Vrela parameter in vRel A dramatically improves the ability of the gene network to approximate optimal performance. Motivation and model parameters are given in the Appendix.
Figure 3
Figure 3. Approach and illustration of inferring of an genetic network given a kinetic model of the associated metabolic network
The steps (A) and the outcome (B,C) of the approach described in the main text are explained in this figure. The plot in (B) indicates the optimization results as dots and the fitted regulatory circuitry as lines. The two genetic circuits shown in (C). can both fit the optimization results, indicating that alternative regulatory network designs are possible. Model details and parameters may be found in the Appendix.
Figure 4
Figure 4. Illustration of optimal environmental tracking of the steady-state metabolic flux by the optimal genetic network
(A) The optimizing genetic network inferred in Figure 3. (B) Stepwise changes in the environmental concentration of the nutrient S. (C) Illustration of optimal environmental tracking: comparison of the flux of the model with the desired optimal behavior. (D) Overview of the dynamics of the enzyme concentration during the dynamics of (C). Model details and parameters may be found in the Appendix.

References

    1. Jacob F. and Monod J. (1961) Genetic regulatory mechanisms in the synthesis of proteins. J. Mol. Biol. 3, 318–356 10.1016/S0022-2836(61)80072-7 - DOI - PubMed
    1. Chubukov V., Gerosa L., Kochanowski K. and Sauer U. (2014) Coordination of microbial metabolism. Nat. Rev. Microbiol. 12, 327–340 10.1038/nrmicro3238 - DOI - PubMed
    1. Bruggeman F.J., Teusink B. and Steuer R. (2023) Trade-offs between the instantaneous growth rate and long-term fitness: consequences for microbial physiology and predictive computational models. Bioessays 45, 2300015 10.1002/bies.202300015 - DOI - PubMed
    1. van Hoek P.I.M., van Dijken J.P. and Pronk J.T. (1998) Effect of specific growth rate on fermentative capacity of Baker’s yeast. Appl. Environ. Microbiol. 64, 4226–4233 10.1128/AEM.64.11.4226-4233.1998 - DOI - PMC - PubMed
    1. Elsemman I.E., Prado A.R., Grigaitis P., Albornoz M.G., Harman V., Holman S.W.et al. . (2022) Whole-cell modeling in yeast predicts compartment-specific proteome constraints that drive metabolic strategies. Nat. Commun. 13, 801 10.1038/s41467-022-28467-6 - DOI - PMC - PubMed

Publication types

MeSH terms