. 2024 Apr 25;134(11):e173789.
doi: 10.1172/JCI173789.

RNA splicing analysis deciphers developmental hierarchies and reveals therapeutic targets in adult glioma

Affiliations

RNA splicing analysis deciphers developmental hierarchies and reveals therapeutic targets in adult glioma

Xiao Song et al. J Clin Invest. .

Abstract

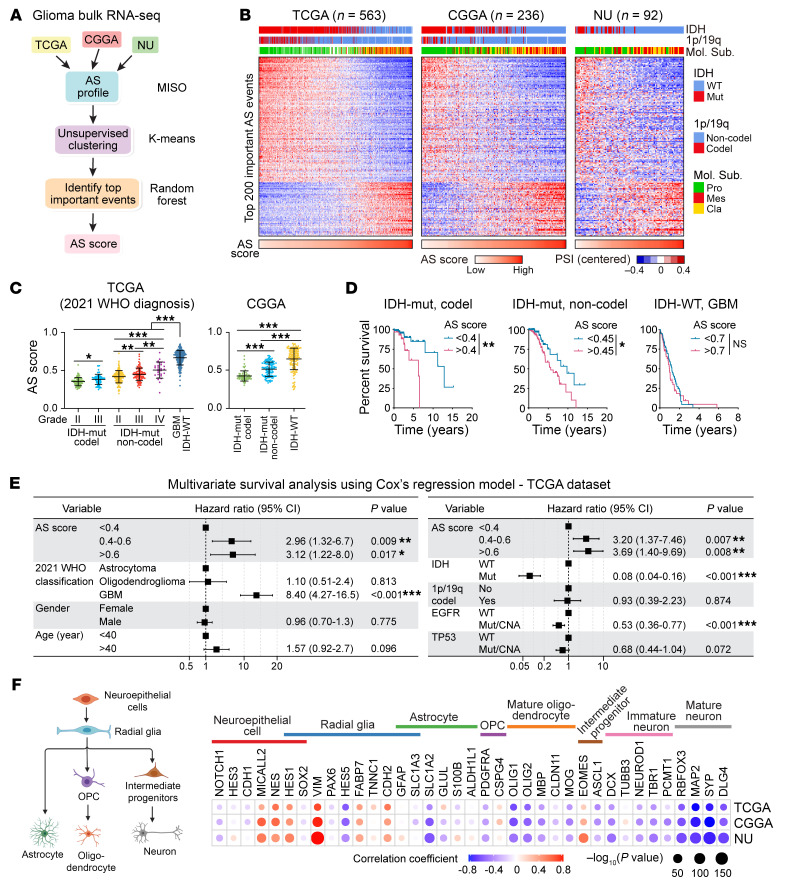
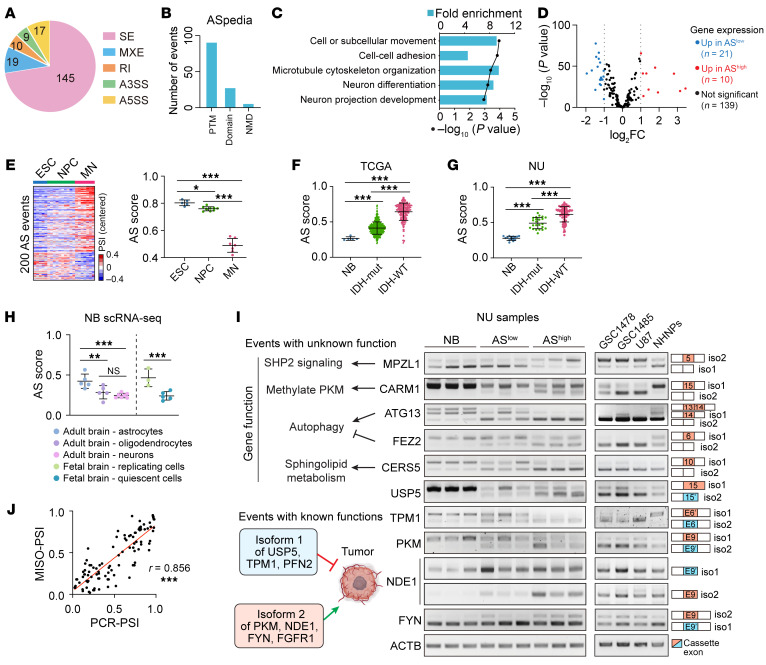
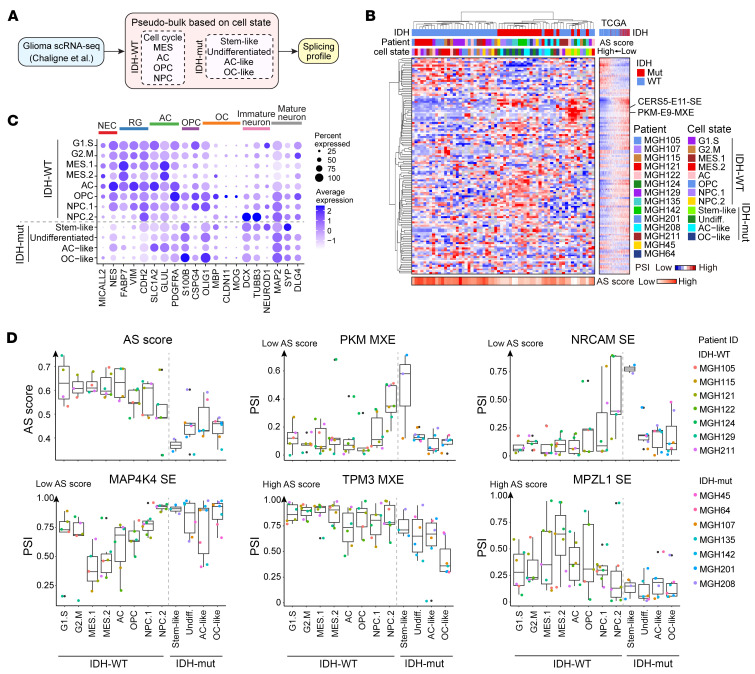
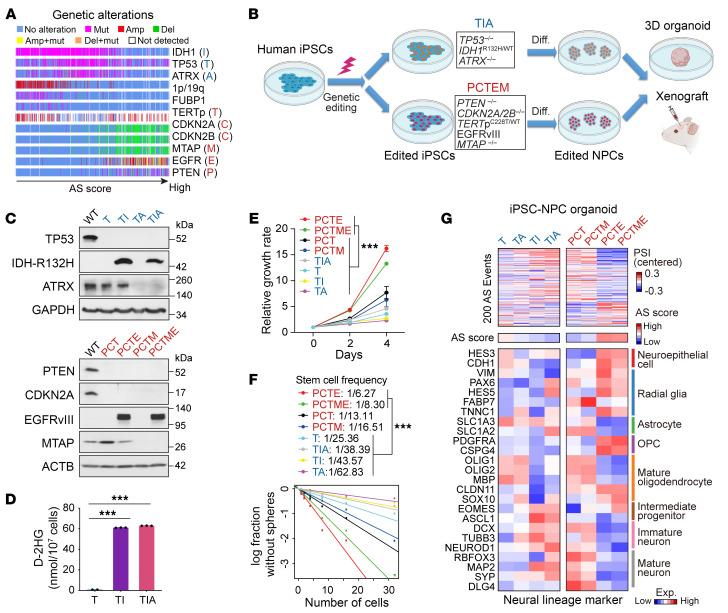
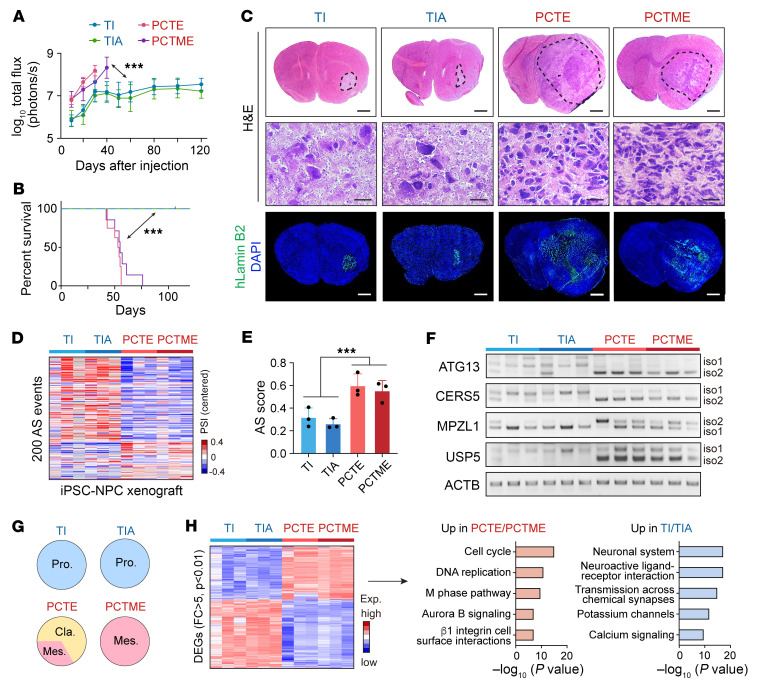
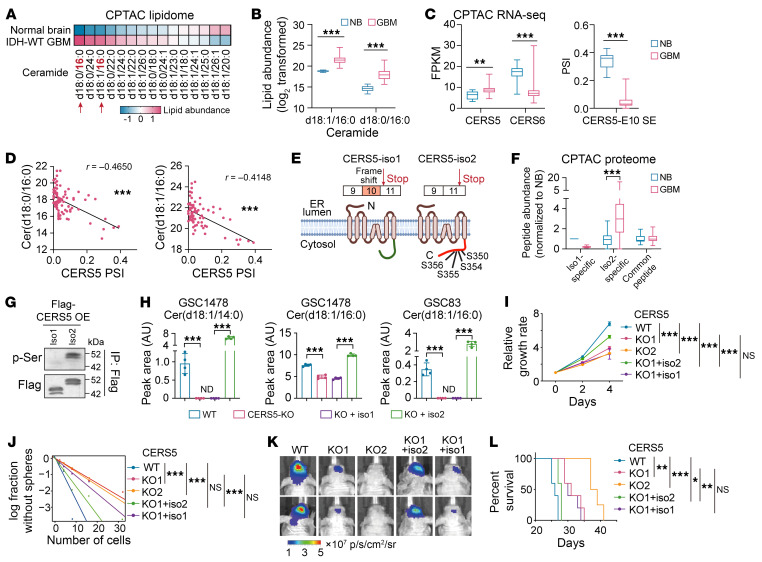
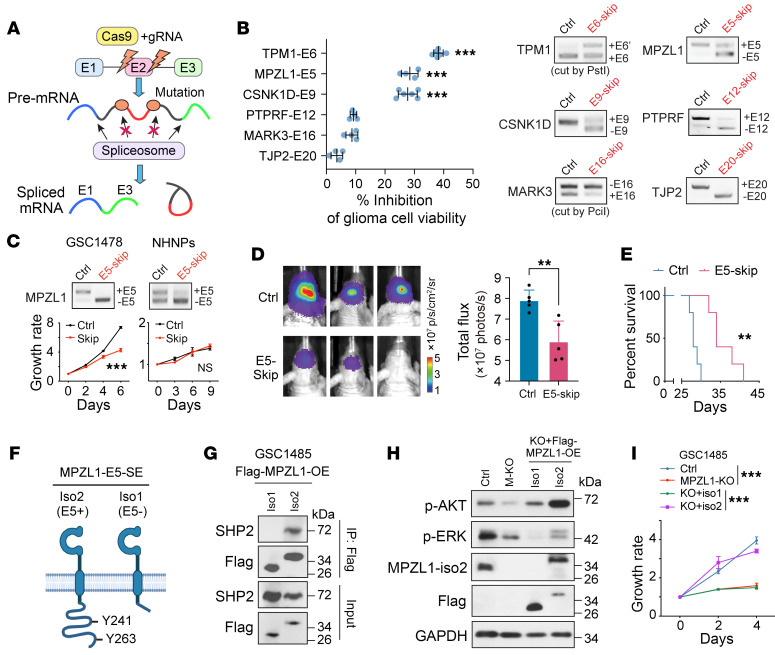
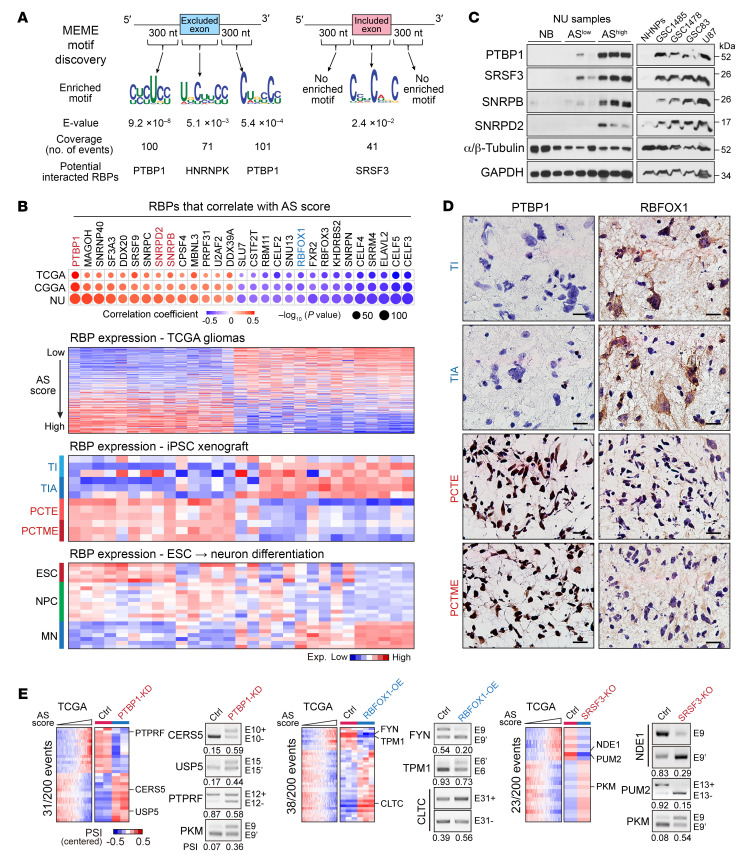
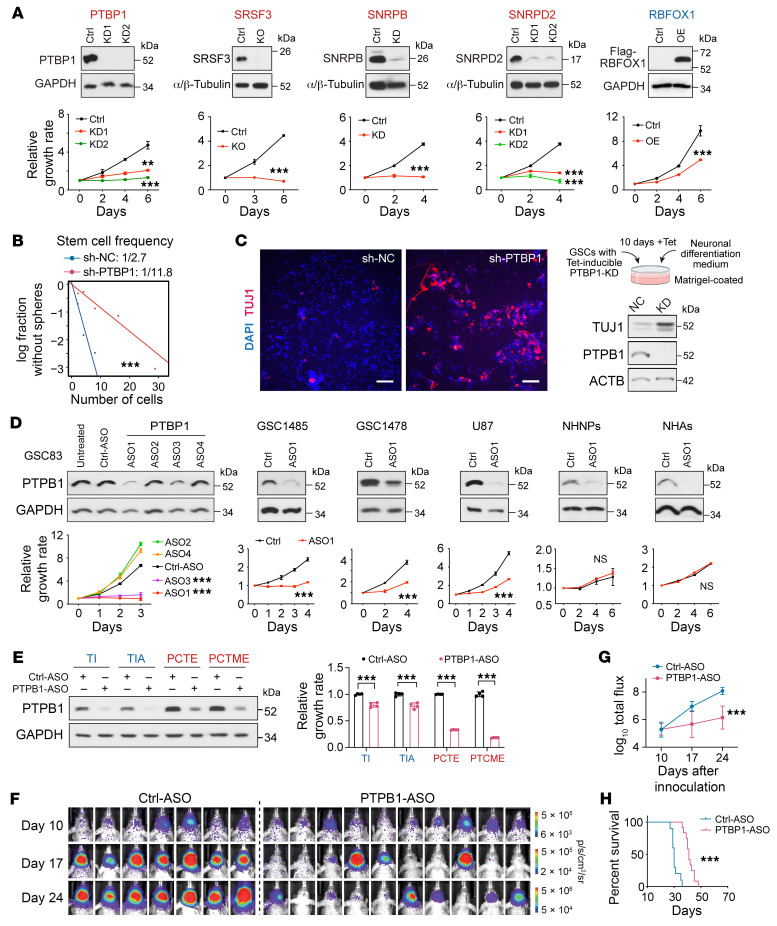
Widespread alterations in RNA alternative splicing (AS) have been identified in adult gliomas. However, their regulatory mechanism, biological significance, and therapeutic potential remain largely elusive. Here, using a computational approach with both bulk and single-cell RNA-Seq, we uncover a prognostic AS signature linked with neural developmental hierarchies. Using advanced iPSC glioma models driven by glioma driver mutations, we show that this AS signature could be enhanced by EGFRvIII and inhibited by in situ IDH1 mutation. Functional validations of 2 isoform switching events in CERS5 and MPZL1 show regulations of sphingolipid metabolism and SHP2 signaling, respectively. Analysis of upstream RNA binding proteins reveals PTBP1 as a key regulator of the AS signature where targeting of PTBP1 suppresses tumor growth and promotes the expression of a neuron marker TUJ1 in glioma stem-like cells. Overall, our data highlights the role of AS in affecting glioma malignancy and heterogeneity and its potential as a therapeutic vulnerability for treating adult gliomas.

Keywords: Brain cancer; Cell biology; Molecular biology; Oncology; RNA processing.


Conflict of interest statement

Conflict of interest: The authors have no conflict of interest to declare.

Figures

Figure 1
Figure 1. Unsupervised splicing analysis in bulk gliomas reveals a prognostic AS signature linked to neural lineage differentiation.
(A) Computational pipeline of AS analysis in gliomas. (B) Heatmaps showing the PSI values of the 200 AS events across 3 glioma samples. Samples were ordered based on their AS scores. Annotations on top show the association of AS landscape with IDH mutation, 1p/19q codeletion and predefined molecular subtyping. Pro, proneural; Mes, mesenchymal; Cla, classical; Mut, mutant; WT, wildtype. (C) AS scores of glioma samples in indicated groups from TCGA and CGGA data sets, analyzed using 1-way ANOVA multiple comparisons with correction by controlling the FDR. (D) Kaplan-Meier analyses in TCGA gliomas grouped by AS score. Log-rank test was used to compare between groups. (E) Multivariate cox regression analysis for overall survival in TCGA glioma samples. HR, hazard ratio; CI, confidence interval. (F) The correlation between AS score and the expression of neural lineage markers. Dot sizes indicate the P value from spearman correlation analysis, and colors indicate correlation coefficient value. The cartoon on left shows the neural differentiation trajectory. *P < 0.05; **P < 0.01; ***P < 0.001.
Figure 2
Figure 2. An overview of the 200 events and validation of their AS pattern.
(A) Distribution of the 200 AS events in each category: SE, skipped exons; MXE, mutually exclusive exons; A5SS/A3SS, alternative 5′/3′ splice sites; RI, retained introns. (B) Functional impact of 200 AS events annotated by the ASpedia database. PTM, posttranslational modification; NMD, nonsense-mediated decay. (C) Top 5 significantly enriched GO biological processes of the 170 genes. (D) Volcano plot for the differential expression of 170 AS-affected genes between samples with high and low AS scores from TCGA data set. (E) AS profiling in human ESC-derived neuronal differentiation model. Left, Heatmaps show the AS landscape of 200 events in ESCs, differentiated NPCs, and motor neurons (MNs). Right, AS scores in indicated groups. (F and G) AS scores in normal brains (NB), IDH-mut, and IDH-WT gliomas from TCGA (F) and NU (G) data sets. (H) AS scores in indicated cell types from scRNA-Seq data of adult and fetal brains. (I) RT-PCR analysis with isoform-specific primers for indicated genes in normal brains (NB), NU glioma tissues (ASlo and AShi), GSC/GBM cell lines, and normal human neural progenitors (NHNPs). (J) Pearson correlation analysis between MISO-estimated PSI and RT-PCR quantified PSI. Data were analyzed using 1-way ANOVA multiple comparisons with correction by controlling the FDR in EH. *P < 0.05; **P < 0.01; ***P < 0.001.
Figure 3
Figure 3. Intratumoral AS heterogeneity is associated with the developmental hierarchy in glioma.
(A) Computational pipeline of AS analysis using a cell-state based pseudobulk strategy in scRNA-Seq data of gliomas. (B) Hierarchical clustering analysis with the PSI data of events in pseudobulks. The heatmap on the right illustrates the PSI data of events at the same order in TCGA samples. (C) Expression of neural lineage markers in each cell state. Dot sizes indicate the percentage of cells in each group expressing the gene, and colors indicate average expression levels. NEC, neuroepithelial cells; RG, radial glia; AC, astrocyte; OPC, oligodendrocyte progenitors; OC, oligodendrocytes. (D) Box plots showing the AS score and PSI distribution of representative AS events in each cell state. The box representing the interquartile range of the data, the line within the box representing the median, and the whiskers extending to the most extreme data points within 1.5 times the interquartile range. Individual data points beyond this range are shown as dots. The color of the dots represents the patient.
Figure 4
Figure 4. Glioma driver mutations modulate AS landscape and neural developmental programs in iPSC-based glioma models.
(A) Mutational landscape of frequent somatic alterations in TCGA glioma samples ordered by AS score. (B) Workflow of iPSC editing, NPC induction, and in vitro and in vivo model system. (C) IB for edited iPSCs. WT, WT; T, TP53–/–; TI, T+IDH1R132H/WT; TA, T+ATRX–/–; TIA, TI+ATRX–/–; PCT, PTEN–/– CDKN2A/2B–/–, TERTp–/–; PCTE, PCT+EGFRvIII-OE; PCTM, PCT+MTAP–/–; PCTME, PCTM+EGFRvIII-OE. (D) Detection of intracellular D-2HG in edited NPCs. n = 2–3. (EF) Cell proliferation (E, n = 3–6) and self-renewal ability (F) of edited NPCs. (G) Heatmap showing the AS landscapes and the expression of neural lineage markers in iPSC organoids harboring indicated mutations. Data were analyzed using 2-tailed unpaired t test in D, 2-way ANOVA in E, and likelihood ratio test of single-hit model in F. ***P < 0.001.
Figure 5
Figure 5. In vivo glioma models from edited iPSCs recapitulate the gene expression and AS signatures of clinical gliomas.
(A) Quantification of bioluminescent intensity emitted from indicated intracranial xenografts. n = 5–6. (B) Kaplan-Meier analysis of tumor-bearing mice. Log-rank test was used to compare between groups. n = 5–8. (C) Representative images of H&E (upper and middle) and IF (lower) staining with a human-specific anti-laminin B2 antibody on brain sections from tumor-bearing mice (n = 5–6). Scale bars, upper and lower panel, 1 mm; middle panel, 20 μm. (D and E) AS landscape of the 200 events (D) and AS scores (E) in iPSC xenografts harboring indicated mutations from RNA-Seq data. (F) RT-PCR analysis with human-specific primers in intracranial xenografts from edited NPCs. (G) Subtyping results of iPSC-derived glioma xenografts based on a previously reported molecular subtype signatures using GlioVis subtyping tools. n = 3. (H) Left, Heatmap showing the differentially expressed genes between TI/TIA and PCTE/PCTME xenografts. Right, Top 5 significantly enriched GO biological processes of the differentially expressed genes between TI/TIA and PCTE/PCTME xenografts. Data were analyzed using 2-way ANOVA in A, log-rank test in B, and 2-tailed unpaired t test in E. ***P < 0.001.
Figure 6
Figure 6. AS of CERS5-E10 affects the ceramide component and oncogenic potential of glioma cells.
(A and B) Ceramide abundance between normal brain and GBM. “d18” represents a sphingoid base with 18 carbons. The number after “:” indicates the presence of double bonds, and the number after “/” denotes the carbon length in the fatty acid chain. (C) Gene expression of CERS5, CERS6 (left) and PSI of CERS5-E10-SE between normal brain and GBM. (D) Spearman correlation analysis between C16-ceramide and PSI of CERS5-E10-SE. (E) A cartoon showing CERS5 isoforms. (F) Abundance of CERS5 peptides analyzed from CPTAC-proteome data. (G) IP-IB in GSC46 overexpressed with CERS5 isoforms. (H) Lipid-MS analysis of ceramides abundance in GSCs. n = 4. ND, not detected. (IL) Effects of CERS5-KO and rescue on proliferation (I, n = 3–6), sphere-formation (J), xenograft growth of GSC1478 (K, representative BLI at 18 days after inoculation) and mouse survival (L, n = 4–5). Data were analyzed using 2-tailed unpaired t test in B, C, F, and H, 2-way ANOVA in I, likelihood ratio test in J, and log-rank test in L. In B, C, and F, the box represents the interquartile range, the line within the box represents the median, and the whiskers extending to the maximum and minimum values. *P < 0.05; **P < 0.01; ***P < 0.001.
Figure 7
Figure 7. Modulation of MPZL1 splicing affects its interaction with SHP2 and the subsequent oncogenic signaling in glioma cells.
(A) Scheme showing CRISPR-based splicing modulation. (B) Left, effects on cell viability of GSC1485 by skipping of indicated exons. Right, RT-PCR. n = 4–6. (C) Effect of MPZL1-E5 skipping on the proliferation of indicated cells. Upper, RT-PCR. Lower, growth curve. n = 4. (D and E) Effects of MPZL1-E5 skipping on xenograft growth of GSC1478 (D, representative BLI and quantification, n = 5) and mouse survival (E, n = 5). (F), A cartoon showing MPZL1 isoforms. (G) IP-IB in GSC1485 overexpressed with MPZL1 isoforms. (H and I) Effects of MPZL1-KO and rescue on signaling pathways (H) and proliferation (I, n = 3–4) of GSC1485. Data were analyzed using 2-tailed unpaired t test in B and D, 2-way ANOVA in C and I, and log-rank test in E. **P < 0.01; ***P < 0.001.
Figure 8
Figure 8. A group of RBPs modulate the AS landscape in glioma.
(A) Motif analysis around the splice sites of the exons from the 200 events and predicted binding RBPs. (B) Upper, dot plot showing the correlation between AS score and the expression of each RBPs. Dot sizes indicate the P value from spearman correlation analysis, and colors indicate correlation coefficient value. Bottom, heatmap showing the expression of each RBPs in TCGA gliomas, iPSC glioma xenografts, and human ESC to MN differentiation model. (C) IB analysis of indicated RBPs in normal brains (NB), NU glioma tissues with low or high AS scores (ASlo and AShi), and indicated cell lines. (D) IHC staining shows the expression of PTBP1 and RBFOX1 in iPSC glioma xenografts. Scale bars: 20 μm. (E) Heatmaps show the PSI distribution of the events that are from the 200 events and affected by PTBP1-KD, RBFOX1-OE, or SRSF3-KO. RT-PCR shows the validation of AS changes in GSC1485 with indicated treatment. The numbers below the PCR plots show the PCR-quantified PSI values.
Figure 9
Figure 9. Targeting PTBP1 inhibited cell growth and induced neuronal-like differentiation in GSCs.
(A) Effect of overexpression (OE), knockdown (KD), or knockout (KO) of indicated RBPs on cell proliferation of GSC1485 (PTBP1, SRSF3, SNRPB, SNRPD2) or GSC1478 (RBFOX1). Upper, IB. Lower, cell proliferation curve. n = 2–4. (B) Sphere-formation analysis in GSC1478 treated with shRNA-PTBP1 (sh-PTBP1) or a negative control (sh-NC). (C) IF and IB analysis of TUJ1 in GSC1478 cells treated with sh-PTBP1 or sh-NC. Scale bars: 100 μm. (D) Effects of PTBP1-targeting ASOs on PTBP1 expression (IB, upper) and cell proliferation (lower) in indicated cells. n = 3–6. (E) Effects of PTBP1-targeting ASO1 on PTBP1 expression (IB, left) and cell proliferation (right) in edited iPSC-derived NPCs with indicated mutations. n = 4. (FH) In vivo effects of PTBP1-ASO1 on the growth of GSC1478-derived intracranial xenografts (F, BLI images of brain glioma xenografts. G, quantification) and survival of mice (H). n = 7–10. Data were analyzed using 2-way ANOVA in A, D, and G, 2-tailed unpaired t test in E, likelihood ratio test in B, and log-rank test in H. **P < 0.01; ***P < 0.001.

References

    1. Nicholson JG, Fine HA. Diffuse glioma heterogeneity and its therapeutic implications. Cancer Discov. 2021;11(3):575–590. doi: 10.1158/2159-8290.CD-20-1474. - DOI - PubMed
    1. Louis DN, et al. The 2021 WHO classification of tumors of the central nervous system: a summary. Neuro Oncol. 2021;23(8):1231–1251. doi: 10.1093/neuonc/noab106. - DOI - PMC - PubMed
    1. Ceccarelli M, et al. Molecular profiling reveals biologically discrete subsets and pathways of progression in diffuse glioma. Cell. 2016;164(3):550–563. doi: 10.1016/j.cell.2015.12.028. - DOI - PMC - PubMed
    1. Suva ML, Tirosh I. The glioma stem cell model in the era of single-cell genomics. Cancer Cell. 2020;37(5):630–636. doi: 10.1016/j.ccell.2020.04.001. - DOI - PubMed
    1. Tirosh I, et al. Single-cell RNA-seq supports a developmental hierarchy in human oligodendroglioma. Nature. 2016;539(7628):309–313. doi: 10.1038/nature20123. - DOI - PMC - PubMed

MeSH terms

Substances