Seizures exacerbate excitatory: inhibitory imbalance in Alzheimer's disease and 5XFAD mice
- PMID: 38662500
- PMCID: PMC11146435
- DOI: 10.1093/brain/awae126
Seizures exacerbate excitatory: inhibitory imbalance in Alzheimer's disease and 5XFAD mice
Abstract
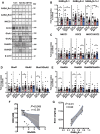
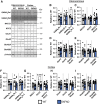
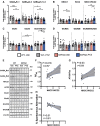
Approximately 22% of Alzheimer's disease (AD) patients suffer from seizures, and the co-occurrence of seizures and epileptiform activity exacerbates AD pathology and related cognitive deficits, suggesting that seizures may be a targetable component of AD progression. Given that alterations in neuronal excitatory:inhibitory (E:I) balance occur in epilepsy, we hypothesized that decreased markers of inhibition relative to those of excitation would be present in AD patients. We similarly hypothesized that in 5XFAD mice, the E:I imbalance would progress from an early stage (prodromal) to later symptomatic stages and be further exacerbated by pentylenetetrazol (PTZ) kindling. Post-mortem AD temporal cortical tissues from patients with or without seizure history were examined for changes in several markers of E:I balance, including levels of the inhibitory GABAA receptor, the sodium potassium chloride cotransporter 1 (NKCC1) and potassium chloride cotransporter 2 (KCC2) and the excitatory NMDA and AMPA type glutamate receptors. We performed patch-clamp electrophysiological recordings from CA1 neurons in hippocampal slices and examined the same markers of E:I balance in prodromal 5XFAD mice. We next examined 5XFAD mice at chronic stages, after PTZ or control protocols, and in response to chronic mTORC1 inhibitor rapamycin, administered following kindled seizures, for markers of E:I balance. We found that AD patients with comorbid seizures had worsened cognitive and functional scores and decreased GABAA receptor subunit expression, as well as increased NKCC1/KCC2 ratios, indicative of depolarizing GABA responses. Patch clamp recordings of prodromal 5XFAD CA1 neurons showed increased intrinsic excitability, along with decreased GABAergic inhibitory transmission and altered glutamatergic neurotransmission, indicating that E:I imbalance may occur in early disease stages. Furthermore, seizure induction in prodromal 5XFAD mice led to later dysregulation of NKCC1/KCC2 and a reduction in GluA2 AMPA glutamate receptor subunit expression, indicative of depolarizing GABA receptors and calcium permeable AMPA receptors. Finally, we found that chronic treatment with the mTORC1 inhibitor, rapamycin, at doses we have previously shown to attenuate seizure-induced amyloid-β pathology and cognitive deficits, could also reverse elevations of the NKCC1/KCC2 ratio in these mice. Our data demonstrate novel mechanisms of interaction between AD and epilepsy and indicate that targeting E:I balance, potentially with US Food and Drug Administration-approved mTOR inhibitors, hold therapeutic promise for AD patients with a seizure history.
Keywords: Alzheimer’s disease; GABA receptors; epilepsy; glutamate receptors; mTOR; rapamycin.
© The Author(s) 2024. Published by Oxford University Press on behalf of the Guarantors of Brain. All rights reserved. For commercial re-use, please contact reprints@oup.com for reprints and translation rights for reprints. All other permissions can be obtained through our RightsLink service via the Permissions link on the article page on our site—for further information please contact journals.permissions@oup.com.
Conflict of interest statement
The authors report no competing interests.
Figures


Comment in
-
Targeting excitatory:inhibitory network imbalance in Alzheimer's disease.Brain. 2024 Jun 3;147(6):1931-1933. doi: 10.1093/brain/awae146. Brain. 2024. PMID: 38736395 No abstract available.
References
-
- Horvath AA, Papp A, Zsuffa J, et al. Subclinical epileptiform activity accelerates the progression of Alzheimer’s disease: A long-term EEG study. Clin Neurophysiol. 2021;132:1982–1989. - PubMed
MeSH terms
Substances
Grants and funding
- P30 AG010124/AG/NIA NIH HHS/United States
- AARF-22-972333/ALZ/Alzheimer's Association/United States
- T32 AG000255/AG/NIA NIH HHS/United States
- AG010124/University of Pennsylvania
- R37 NS115439/NS/NINDS NIH HHS/United States
- P50 NS053488/NS/NINDS NIH HHS/United States
- R21 NS105437/NS/NINDS NIH HHS/United States
- R01 NS101156/NS/NINDS NIH HHS/United States
- T32AG000255/Institutional National Research Service Award
- R01 AG054519/AG/NIA NIH HHS/United States
- P01 AG066597/AG/NIA NIH HHS/United States
- R21NS105437/NS/NINDS NIH HHS/United States
- NH/NIH HHS/United States
- U19 AG062418/AG/NIA NIH HHS/United States
- R01AG077692/AG/NIA NIH HHS/United States
- R01 AG077692/AG/NIA NIH HHS/United States
LinkOut - more resources
Full Text Sources
Medical
Miscellaneous

