Observational Study
. 2024 Jun 21;135(1):138-154.
doi: 10.1161/CIRCRESAHA.124.324559. Epub 2024 Apr 25.

Proteomics, Human Environmental Exposure, and Cardiometabolic Risk

Affiliations
Observational Study

Proteomics, Human Environmental Exposure, and Cardiometabolic Risk

Andrew S Perry et al. Circ Res. .

Abstract

Background: The biological mechanisms linking environmental exposures with cardiovascular disease pathobiology are incompletely understood. We sought to identify circulating proteomic signatures of environmental exposures and examine their associations with cardiometabolic and respiratory disease in observational cohort studies.

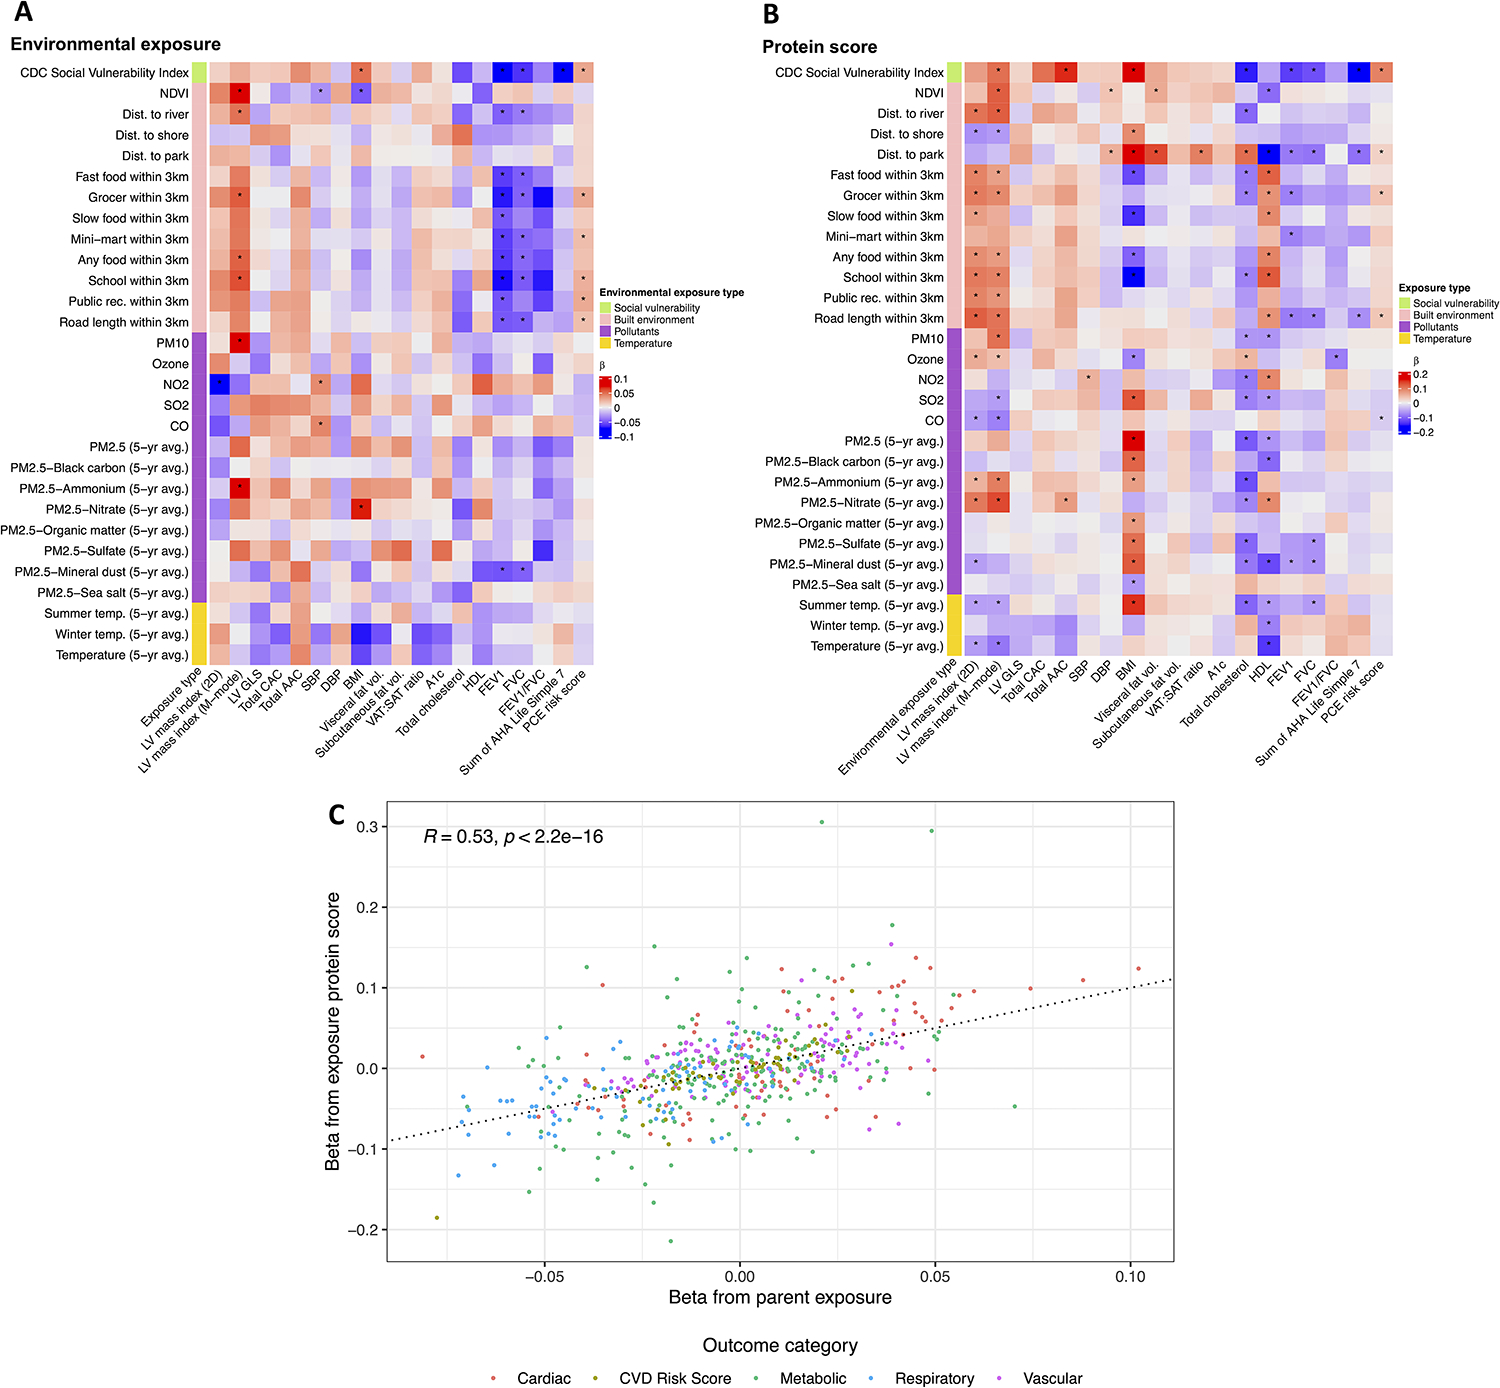
Methods: We tested the relations of >6500 circulating proteins with 29 environmental exposures across the built environment, green space, air pollution, temperature, and social vulnerability indicators in ≈3000 participants of the CARDIA study (Coronary Artery Risk Development in Young Adults) across 4 centers using penalized and ordinary linear regression. In >3500 participants from FHS (Framingham Heart Study) and JHS (Jackson Heart Study), we evaluated the prospective relations of proteomic signatures of the envirome with cardiovascular disease and mortality using Cox models.

Results: Proteomic signatures of the envirome identified novel/established cardiovascular disease-relevant pathways including DNA damage, fibrosis, inflammation, and mitochondrial function. The proteomic signatures of the envirome were broadly related to cardiometabolic disease and respiratory phenotypes (eg, body mass index, lipids, and left ventricular mass) in CARDIA, with replication in FHS/JHS. A proteomic signature of social vulnerability was associated with a composite of cardiovascular disease/mortality (1428 events; FHS: hazard ratio, 1.16 [95% CI, 1.08-1.24]; P=1.77×10⁻⁵; JHS: hazard ratio, 1.25 [95% CI, 1.14-1.38]; P=6.38×10⁻⁶; hazard ratio expressed as per 1 SD increase in proteomic signature), robust to adjustment for known clinical risk factors.

Conclusions: Environmental exposures are related to an inflammatory-metabolic proteome, which identifies individuals with cardiometabolic disease and respiratory phenotypes and outcomes. Future work examining the dynamic impact of the environment on human cardiometabolic health is warranted.

Keywords: cardiovascular diseases; environment; heart failure; hypertension; myocardial infarction; risk factors.


Conflict of interest statement

Disclosures R.V. Shah is supported in part by grants from the National Institutes of Health and the American Heart Association. In the past 12 months, R.V. Shah has served for a consultant for Amgen and Cytokinetics. R.V. Shah is a co-inventor on a patent for ex-RNAs signatures of cardiac remodeling and a pending patent on proteomic signatures of fitness and lung and liver diseases. V.L. Murthy has received grant support from Siemens Healthineers, NIDDK, NIA, NHLBI and AHA. V.L. Murthy has received other research support from NIVA Medical Imaging Solutions. V.L. Murthy owns stock in Eli Lilly, Johnson & Johnson, Merck, Bristo-Myers Squibb, Pfizer and stock options in Ionetix. V.L. Murthy has received research grants and speaking honoraria from Quart Medical. M. Nayor received speaking honoraria from Cytokinetics. M. Nayor is supported by the NIH and by a Career Investment Award from the Department of Medicine, Boston University School of Medicine. B. Choi is supported by the NIH and American Heart Association. M.B. Rice is supported by the NIH and reports fees from the Conservation Law Foundation. The remaining authors report no disclosures.

Figures

Figure 1:
Figure 1:. Study design and correlations between environmental exposures.
(A) We derived circulating proteomic signatures of a variety of environmental exposures. These proteomic signatures were then examined for their relation with cardiorespiratory and metabolic outcomes in 3 separate cohorts. (B) Heatmap of Spearman correlation coefficients between all the environmental exposures. CDC = Centers for Disease Control and Prevention; NDVI = normalized difference vegetation index; Dist. = distance; NO2 = nitrogen dioxide; SO2 = sulfur dioxide; CO = carbon monoxide; PM10 = particulate matter with median diameter < 10 μm; PM2.5 = particulate matter with median diameter < 2.5 μm; avg. = average; temp. = temperature.
Figure 2.
Figure 2.. Model fit of protein scores for exposures.
(left) Barplot of the R2 from linear models of exposure (outcome) as a function of its protein score (predictor) in the validation sample, which was not used to train the model. (right) Barplot of the number of proteins included in each protein score. CDC = Centers for Disease Control and Prevention; NDVI = normalized difference vegetation index; Dist. = distance; NO2 = nitrogen dioxide; SO2 = sulfur dioxide; CO = carbon monoxide; PM10 = particulate matter with median diameter < 10 μm; PM2.5 = particulate matter with median diameter < 2.5 μm; avg. = average; temp. = temperature.
Figure 3:
Figure 3:. Relation of environmental exposures and their corresponding protein scores with cardiometabolic and respiratory phenotypes in CARDIA.
Heatmap of beta coefficients for cardiometabolic and respiratory phenotypes as a function of the environmental exposure (A) or protein score (B) in the entire CARDIA dataset. Phenotype measures from the Year 25 exam are used, except for FEV1, FVC and FEV1/FVC ratio which were measured at Year 30. Protein scores and continuous phenotypes were standardized to mean 0, and variance 1, for use in models. Models were adjusted for age, sex, race, center, BMI, systolic and diastolic blood pressure, anti-hypertensive medication use, diabetes, lifetime pack-years of smoking, estimated glomerular filtration rate, total cholesterol and high-density lipoprotein. Models for cholesterol/lipoproteins were also adjusted for lipid-lowering medication use. For models where the outcome was part of the adjustments (e.g., BMI) the outcome was removed from the adjustments. (C) Comparison of regression coefficients for CMD-exposure vs. CMD-proteomic signature of exposure across the entire CARDIA sample, demonstrating significant variability in association magnitude. Color represents the model outcome: cardiac (LV mass, GLS), vascular (CAC, AAC, SBP, DBP), metabolic (BMI, VAT, SAT, VAT:SAT, HbA1c, total cholesterol, HDL), respiratory (FEV1, FVC, FEV1/FVC), and CVD risk scores (AHA Life Simple 7, pooled cohort equation). CDC = Centers for Disease Control and Prevention; NDVI = normalized difference vegetation index; Dist. = distance; NO2 = nitrogen dioxide; SO2 = sulfur dioxide; CO = carbon monoxide; PM10 = particulate matter with median diameter < 10 μm; PM2.5 = particulate matter with median diameter < 2.5 μm; avg. = average; temp. = temperature. LV = left ventricular; GLS = global longitudinal strain; CAC = coronary artery calcification; AAC = abdominal aortic calcification; vol. = volume; VAT = visceral abdominal tissue; SAT = subcutaneous abdominal tissue; SBP = systolic blood pressure; DBP = diastolic blood pressure; BMI = body mass index; HDL = high-density lipoprotein; FEV1 = forced expiratory volume in 1 second; FVC = forced vital capacity; AHA = American Heart Association; PCE = pooled cohort equation. *false discovery rate <5% (Benjamini-Hochberg
Figure 4:
Figure 4:. Pathway analyses plots
Pathway enrichment analysis was performed on WikiPathways for significant proteins (FDR ≤ 0.05) in each exposure. Heatmaps were made based on negative log10 transformed adjusted p values for the top 5 most enriched pathways mapped with at least 5 significant proteins in each exposure. Rows represent pathways and columns represent exposures and the white to red colors in the heatmap represents the level of enrichment. Grey color means none of the significant proteins in the exposure can be mapped to the pathway.
Figure 5:
Figure 5:. Relations of protein scores with cardiometabolic and respiratory phenotypes, and outcomes in FHS and JHS.
(A) Representative protein scores (predictors) from each exposure category were examined in FHS and JHS for their relations with cardiometabolic and respiratory phenotypes (outcomes) in linear models adjusted for age, sex, BMI, smoking, diabetes, use of anti-hypertensive medications, systolic blood pressure, total cholesterol, and HDL. (B) Protein scores were entered into Cox regression models for incident CVD (left) and incident CVD plus all-cause death (right). The CDC Social Vulnerability Index (SVI) protein score was consistently related to outcomes in both FHS and JHS, robust to adjustment for traditional CVD risk factors. Definitions of incident CVD for FHS and JHS are reported in Methods. Model 1 is adjusted for age and sex. Model 2 is further adjusted for BMI, smoking, diabetes, use of anti-hypertensive medication, systolic blood pressure, total cholesterol, and HDL. Protein score composition is reported in Data Supplement SD08, and full Cox model results are reported in Supplemental Table 5. CDC = Centers for Disease Control and Prevention; dist. = distance; avg. = average; temp. = temperature; LV = left ventricular; CAC = coronary artery calcification; AAC = abdominal aortic calcification; BMI = body mass index; VAT = visceral abdominal tissue; SAT = subcutaneous abdominal tissue; HDL = high-density lipoprotein; FEV1 = forced expiratory volume in 1 second; FVC = forced vital capacity; PCE = pooled cohort equation. *false discovery rate <5% (Benjamini-Hochberg)
Figure 6:
Figure 6:. Relations of neighborhood factors with the protein score of CDC Social Vulnerability Index.
Provided the relation of SVI protein score with incident CVD and death, we further explored the relationship between the protein score and neighborhood factors available in JHS. The figure presents beta coefficients from models where the SVI protein score is the outcome and the neighborhood factor is the predictor, adjusted for age and sex. Dot size reflects the variance explained in the SVI protein score by the neighborhood factor using a type 1 ANOVA test with age and sex having priority in accounting for variance. Error bars are 1.96 x the standard error of the beta estimate. Faded items have a p value ≥0.05.

References

    1. Papas MA, Alberg AJ, Ewing R, Helzlsouer KJ, Gary TL, Klassen AC. The built environment and obesity. Epidemiol Rev. 2007;29:129–143. doi: 10.1093/epirev/mxm009 - DOI - PubMed
    1. Auchincloss AH, Diez Roux AV, Brown DG, Erdmann CA, Bertoni AG. Neighborhood resources for physical activity and healthy foods and their association with insulin resistance. Epidemiology. 2008;19:146–157. doi: 10.1097/EDE.0b013e31815c480 - DOI - PubMed
    1. Li F, Harmer P, Cardinal BJ, Bosworth M, Johnson-Shelton D, Moore JM, Acock A, Vongjaturapat N. Built environment and 1-year change in weight and waist circumference in middle-aged and older adults: Portland Neighborhood Environment and Health Study. Am J Epidemiol. 2009;169:401–408. doi: 10.1093/aje/kwn398 - DOI - PMC - PubMed
    1. Li F, Harmer P, Cardinal BJ, Bosworth M, Johnson-Shelton D. Obesity and the built environment: does the density of neighborhood fast-food outlets matter? Am J Health Promot. 2009;23:203–209. doi: 10.4278/ajhp.071214133 - DOI - PMC - PubMed
    1. Bhatnagar A Environmental cardiology: studying mechanistic links between pollution and heart disease. Circ Res. 2006;99:692–705. doi: 10.1161/01.RES.0000243586.99701.cf - DOI - PubMed

Publication types