. 2024 Jun 6;31(6):803-817.e6.
doi: 10.1016/j.stem.2024.03.018. Epub 2024 Apr 24.

Human anti-PSCA CAR macrophages possess potent antitumor activity against pancreatic cancer

Affiliations

Human anti-PSCA CAR macrophages possess potent antitumor activity against pancreatic cancer

Zahir Shah et al. Cell Stem Cell. .

Abstract

Due to the limitations of autologous chimeric antigen receptor (CAR)-T cells, alternative sources of cellular immunotherapy, including CAR macrophages, are emerging for solid tumors. Human induced pluripotent stem cells (iPSCs) offer an unlimited source for immune cell generation. Here, we develop human iPSC-derived CAR macrophages targeting prostate stem cell antigen (PSCA) (CAR-iMacs), which express membrane-bound interleukin (IL)-15 and truncated epidermal growth factor receptor (EGFR) for immune cell activation and a suicide switch, respectively. These allogeneic CAR-iMacs exhibit strong antitumor activity against human pancreatic solid tumors in vitro and in vivo, leading to reduced tumor burden and improved survival in a pancreatic cancer mouse model. CAR-iMacs appear safe and do not exhibit signs of cytokine release syndrome or other in vivo toxicities. We optimized the cryopreservation of CAR-iMac progenitors that remain functional upon thawing, providing an off-the-shelf, allogeneic cell product that can be developed into CAR-iMacs. Overall, our preclinical data strongly support the potential clinical translation of this human iPSC-derived platform for solid tumors, including pancreatic cancer.

Keywords: cancer immunotherapy; chimeric antigen receptor; cytokine release syndrome; human induced pluripotent stem cells; macrophages; off-the-shelf; pancreatic cancer; prostate stem cell antigen; solid tumor.


Conflict of interest statement

Declaration of interests J.Y., M.A.C., and Z.S. are in the process of a patent application at City of Hope.

Figures

Figure 1.
Figure 1.. Reprogramming and differentiation of human cord blood CD34 HSCPs into iPSCs and subsequent differentiation into macrophages
(A) Schematics for cord blood (CB) CD34+ isolated cells, purified by cell-sorting and expanded for 3 days in an expansion medium, followed by reprogramming into CB-34 iPSCs from day 1 to day 21. (B) Reprogrammed CB-34 iPSCs were analyzed by flow cytometric analysis to detect expression of the pluripotency markers CDH1, SSEA4, TRA-1–60, and the differentiation marker CD34. (C) In vivo differentiation potential of CB-34 iPSCs into the three germ layers, including ectoderm, mesoderm, and endoderm, was investigated via a teratoma assay in which we determined the expression of PAX1, VIMENTIN, and SOX17, respectively, for the three germ layers. (D) Harvest of non-adherent CD45+ myeloid progenitors during iPSCs differentiation into macrophages at different time points (n = 2). Cell yield at each harvest is reflected in the y-axis. (E) A line graph showing expansion folds of progenitors generated from three clones of CB-34 iPSCs during macrophage differentiation. (F) Comparative analysis of primitive versus definitive hematopoietic cell surface markers between CB-34 iPSC-derived macrophages and PBMC-derived macrophages (PBMC-Macs) by flow cytometric analysis (left). Bar graphs display the percentage (%) of positive cells expressing CCR2 and CSF-1R (right). Data are represented as mean ± SD. N = 3. Statistical analysis was performed using Tukey’s multiple comparisons test in one-way ANOVA: ** p = 0.0080, * p = 0.0100, ns, no significance. (G) Comparative characterization of CB-34 iPSC-derived macrophages and PBMC-Macs by assessing standard macrophage cell surface markers using flow cytometric analysis. Solid blue and red peaks on flow graphs represent isotype and surface marker intensity, respectively. See also Figure S1.
Figure 2.
Figure 2.. Phagocytosis and antigen-presentation of iPSC-derived CAR-macrophages
(A) Schematic representation of the mock (top) and CAR (bottom) molecule constructs. (B) Expression of the mock or CAR constructs (represented by tEGFR expression) in undifferentiated CB-34 iPSCs was determined in bulk-sorted CAR+ iPSCs by flow cytometry. (C) Flow cytometry-based assay to determine phagocytosis of the PSCAhigh (Capan-1 and MIA PaCa-2) and PSCAlow (PANC-1) tumor cells by unsorted mock (mock-iMacs) and CAR macrophages (CAR-iMacs). Left panels: representative data. Right panels: summary data. The percentage of macrophage phagocytosis against CFSE-labeled tumor cells (CD45+CFSE+) was assessed by flow cytometry. N = 3. Data are represented as mean ± SD. Statistical analysis was performed using t test: ** p = 0.0019, * p = 0.0118, ns, no significance. (D) The 3D z-stack images of Far-red labeled tumor cells phagocytosed/under phagocytosis by GFP+ CAR-iMacs (left), with an overview of the 3D z-stack images over a 360° rotation (bottom). The images for tumor cells (Capan-1) alone and CAR-iMac alone are provided in the top left corner for reference. Data represent one of two experiments with similar results. (E) Untrasduced macrophages (UT-iMacs) or CAR-iMacs were cocultured with Capan-1 cells at an effector (E) to target (T) ratio of 2:1 for 20 hours. Naïve T cells (n = 3 donors) were added to the coculture at a ratio of 2:1:2 for macrophages: tumor cells: naïve T cells and incubated for an additional 5 days. Activation of naïve T cells was determined by flow cytometry and represented by the percentage of CD3+CD8+CD69+ (CD69 as an activation marker). Data are represented as mean ± SD. Statistical analysis was performed using Tukey’s multiple comparisons test in one-way ANOVA: **** p <0.0001, ns, no significance. (F) UT-iMacs or CAR-iMacs were cocultured with Capan-1 cells at an effector (E) to target (T) ratio of 2:1 for 20 hours as in (E). Naïve T cells (n = 3 donors) were added to the coculture at a ratio of 2:1:2 for macrophages: tumor cells: T cells and incubated for an additional 5 days. Cell surface expression of HLA-I molecules on macrophages was analyzed by flow cytometry. Data are represented as mean ± SD. Statistical analysis was performed using Tukey’s multiple comparisons test in one-way ANOVA: *** p = 0.0005, ns, no significance. MFI: Median fluorescence intensity. (G) Allogeneic NK cells from healthy donors (n = 3 donors) were cocultured with UT-iMacs or CAR-iMacs for 2–3 hours. Activation of NK cells is represented by the percentage of CD3CD56+CD69+ determined by flow cytometry. The statistical data illustrating the percentage of activated NK cells (CD3CD56+CD69+) among different groups are shown. Data are represented as mean ± SD. Statistical analysis was performed using Tukey’s multiple comparisons test in one-way ANOVA: **** p <0.0001, ns, no significance. (H) UT-iMacs or CAR-iMacs were cocultured overnight with Capan-1 cells. UT-iMacs or CAR-iMacs were sorted as CD45+ cells, and total protein was extracted. Immunoblotting was performed to measure the levels of total and phosphorylated AKT. Densitometric analysis was performed using ImageJ software. GAPDH was used as a loading control. (I-J) UT-iMacs or CAR-iMacs were cocultured with Capan-1 cells at an effector (E) to target (T) ratio of 2:1 for 6 hours. Macrophages were gated as CD45+ cells, and expression of the indicated cell surface markers was analyzed by flow cytometry (n = 3). Data are represented as mean ± SD. Statistical analysis was performed using student t test: **** p <0.0001, *** p =0.0005, ** p =0.0025. MFI: median fluorescence intensity. See also Figures S2–S3.
Figure 3.
Figure 3.. CAR-iMacs potently suppress tumor growth in pancreatic cancer mouse models
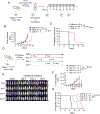
(A) Schematics of the Capan-1Luc-ZsGreen tumor model establishment and treatment strategy of CAR-iMacs administration into NSG-SGM3 mice. (B) Quantification of the bioluminescence images from (A) up to day 57. Data are represented as mean ± SD. Statistical analysis was performed on day 35 using Tukey’s multiple comparisons test in one-way ANOVA: ** p = 0.0018, * p = 0.021, ns, no significance. (C) Kaplan-Meier survival analysis of mice in the indicated groups from (B) as analyzed using the log-rank test: *** p = 0.0006 comparing the CAR-iMac-treated group with the saline- or mock-treated groups, ns, no significance. (D) Schematics of the Capan-1Luc-ZsGreen tumor model establishment and treatment strategy of CAR-iMacs injection at different time points into NOD/SCIDIl2rg−/− (NSG) immunodeficient mice. (E) Time-lapse luciferase imaging of the metastatic pancreatic cancer mouse model after indicated treatments in (D). (F) Quantification of the bioluminescence images from (E) up to day 49. Data are represented as mean ± SD. Statistical analysis was performed on day 42 using Tukey’s multiple comparisons test in one-way ANOVA: **** p < 0.0001, *** p = 0.0005, ns, no significance. (G) Kaplan-Meier survival analysis of mice in the indicated groups from (F) as analyzed using the log-rank test: ** p = 0.0013, ns, no significance. See also Figure S4.
Figure 4.
Figure 4.. CAR-iMacs possess low toxicity and minimum tissue damage in vivo
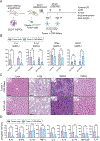
(A) A humanized mouse model was established by injecting LinCD34+ cord blood (CB) cells after being expanded in vitro for 3 days. Three months after engraftment with human CB HSPCs, blood draws were conducted to confirm the successful engraftment by flow cytometric analysis. Mice with successful engraftment were implanted with 1 × 10⁶ Capan-1Luc-ZsGreen cells. Upon confirmation of a high tumor burden, CAR-iMacs were administered to the mice. (B) Quantitative data for CRS-related factors in the sera from the HuSGM3 model. Sera were collected two days after each CAR-iMacs infusion as described in (A). Data are represented as mean ± SD. N = 3 mice per group. Statistical analysis was performed using student t test: ns, no significance. (C) Mice from (B) were euthanized at the same time in all groups, i.e., on day 16 or 2 days after the second infusion of CAR-iMacs, and organs were collected for immune toxicity analysis. Slides from the indicated tissues isolated from experimental mice were subjected to H&E staining. (D) Assessment of the CRS-cytokines in the ascites of the mice as described in (A). n = 3 mice per group. Data are represented as mean ± SD. Statistical analysis was performed using student t test: ns, no significance. See also Figure S4.
Figure 5.
Figure 5.. Generation, differentiation, freezing, and functional analysis of the monoclonal cryopreserved CAR-iMac frozen progenitors (FP)
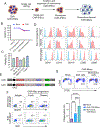
(A) Stepwise procedure for isolation of monoclonal CAR+ iPSCs (monoCAR+ iPSCs). (B) Persistence of CAR expression on monoCAR+ iPSCs during hematopoietic differentiation into CAR-iMacs. (C) Day 10 differentiated progenitors were cryopreserved and thawed two months later and cultured in a macrophage differentiation medium at 37°C for 3 hours. The viability of progenitors was tested by flow cytometry for fresh (before freezing) (Fresh) and thawed (after freezing) (Thawed). N = 3. Data are represented as mean ± SD. (D) Cell surface markers were analyzed by flow cytometry for both fresh- and thawed-iPSC-derived myeloid progenitors, with mature iMacs serving as controls. These markers are indicated on the X-axis. (E-F) CAR expression on monoclonal CAR-iMac progenitors (CAR-iMacP) and bulk CAR-iMacP was tested before cryopreservation and post-thawing two months later (F). Two different CAR cells featuring the same PSCA CAR part but with different tags (tEGFR or GFP), as depicted in (E), were examined. Fresh and cryopreserved cells were assessed under the same conditions. Data in (F) are from one of three experiments with similar results. (G) Bulk or monoclonal cryopreserved CAR-iMac progenitors were thawed and differentiated into bulk CAR-iMacs and monoclonal CAR-iMacs, respectively. Phagocytosis was assessed after coculturing CFSE-labeled Capan-1 cells with bulk CAR-iMacs or monoclonal CAR-iMacs. The percentage of CAR-iMacs phagocytosis against Capan-1 cells (CD45+CFSE+) was assayed by flow cytometry (n = 3). Data are represented as mean ± SD. Statistical analysis was performed using Tukey’s multiple comparisons test in one-way ANOVA: **** p < 0.0001, *** p = 0.0007. See also Figure S5.

References

    1. Majzner RG, and Mackall CL (2019). Clinical lessons learned from the first leg of the CAR T cell journey. Nature medicine 25, 1341–1355. 10.1038/s41591-019-0564-6. - DOI - PubMed
    1. Xiang X, Wang J, Lu D, and Xu X (2021). Targeting tumor-associated macrophages to synergize tumor immunotherapy. Signal Transduction and Targeted Therapy 6, 75. 10.1038/s41392-021-00484-9. - DOI - PMC - PubMed
    1. Mantovani A, Biswas SK, Galdiero MR, Sica A, and Locati M (2013). Macrophage plasticity and polarization in tissue repair and remodelling. The Journal of pathology 229, 176–185. 10.1002/path.4133. - DOI - PubMed
    1. Minutti CM, Knipper JA, Allen JE, and Zaiss DMW (2017). Tissue-specific contribution of macrophages to wound healing. Seminars in Cell & Developmental Biology 61, 3–11. 10.1016/j.semcdb.2016.08.006. - DOI - PubMed
    1. Epelman S, Lavine KJ, and Randolph GJ (2014). Origin and functions of tissue macrophages. Immunity 41, 21–35. 10.1016/j.immuni.2014.06.013. - DOI - PMC - PubMed

MeSH terms