. 2024 Apr 25;15(1):3365.
doi: 10.1038/s41467-024-47244-1.

Numb positively regulates Hedgehog signaling at the ciliary pocket

Affiliations

Numb positively regulates Hedgehog signaling at the ciliary pocket

Xiaoliang Liu et al. Nat Commun. .

Abstract

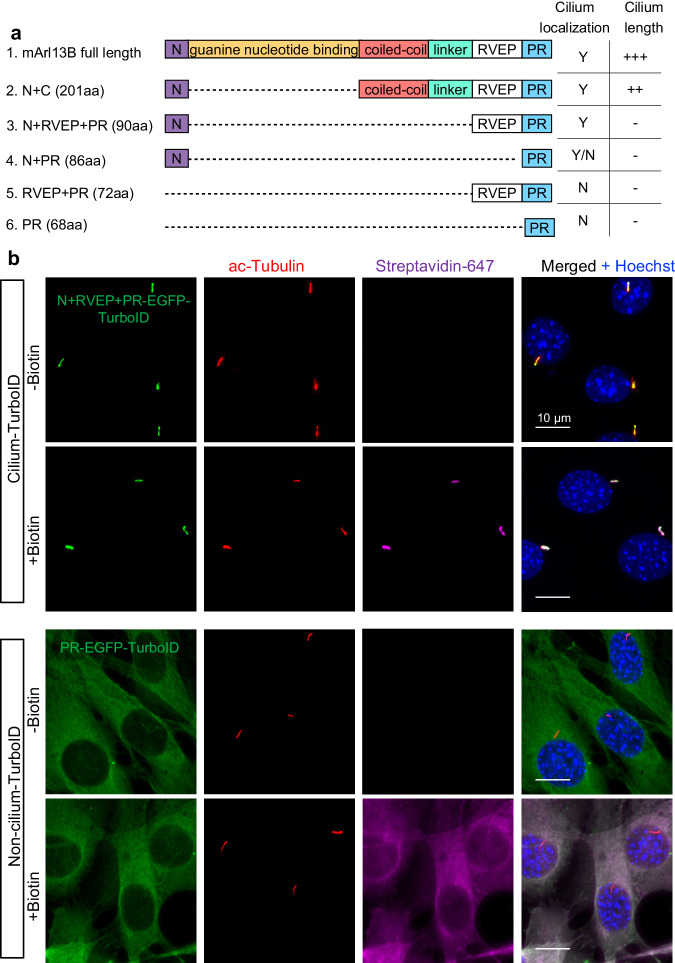
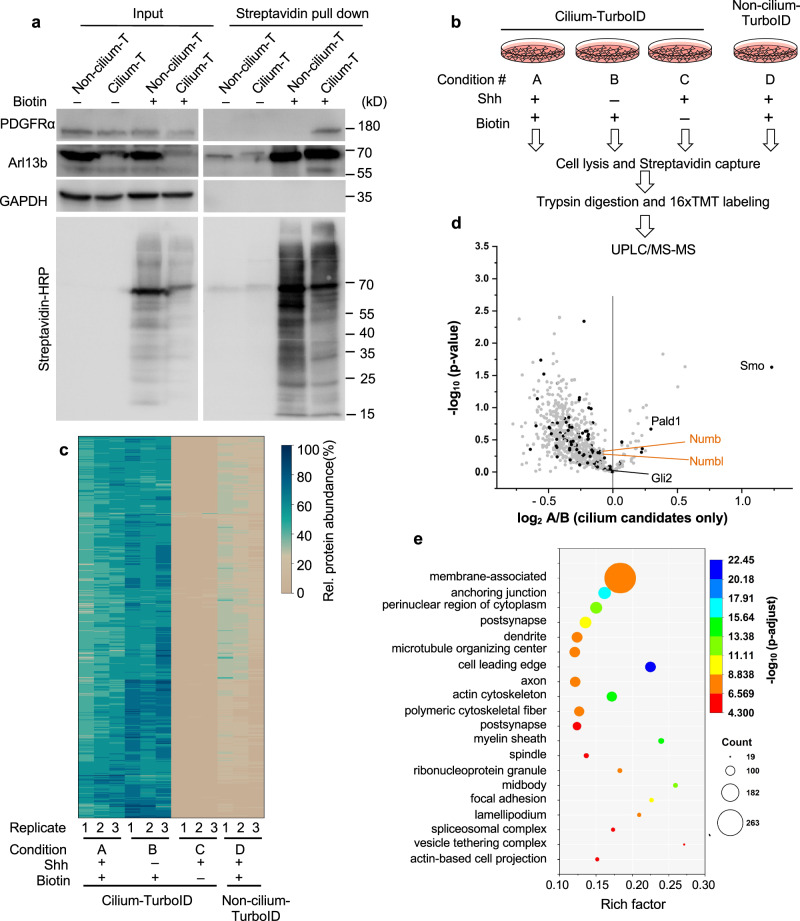
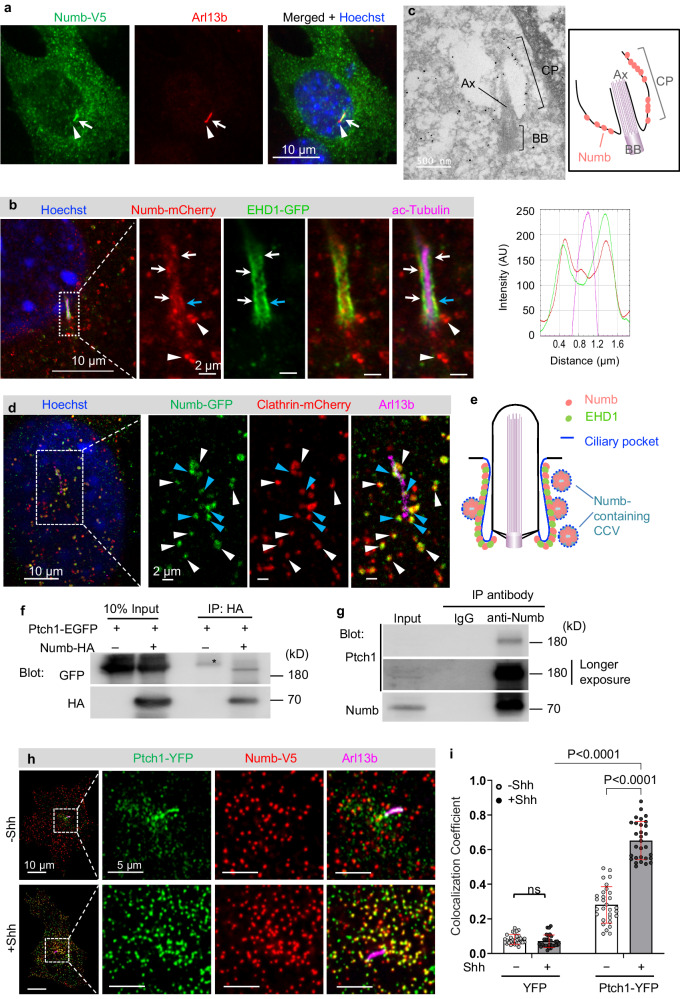
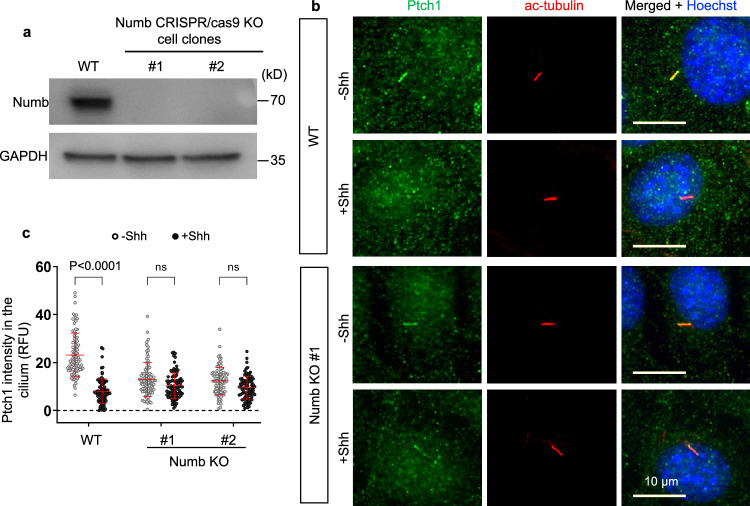
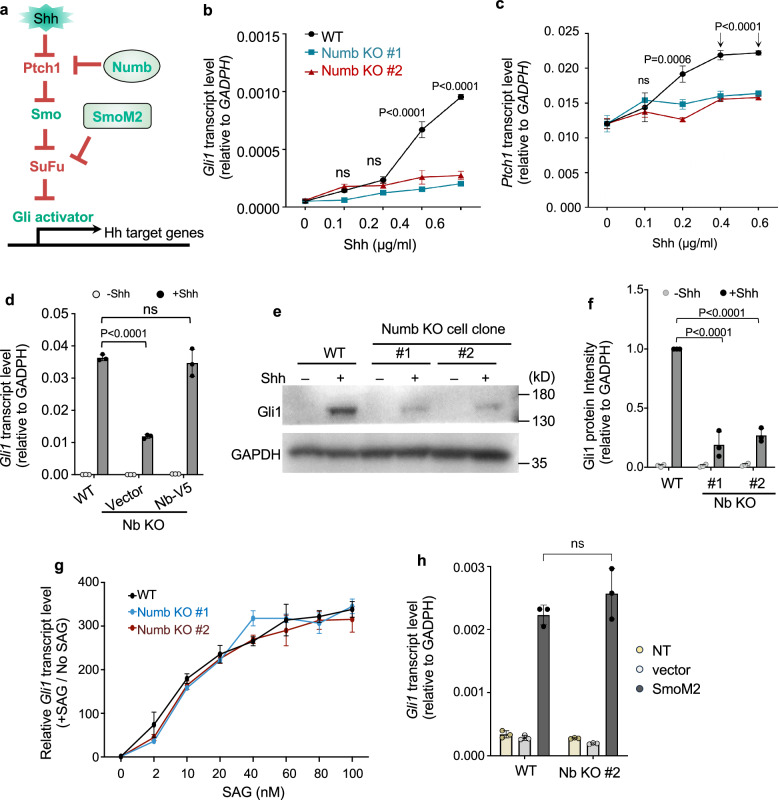
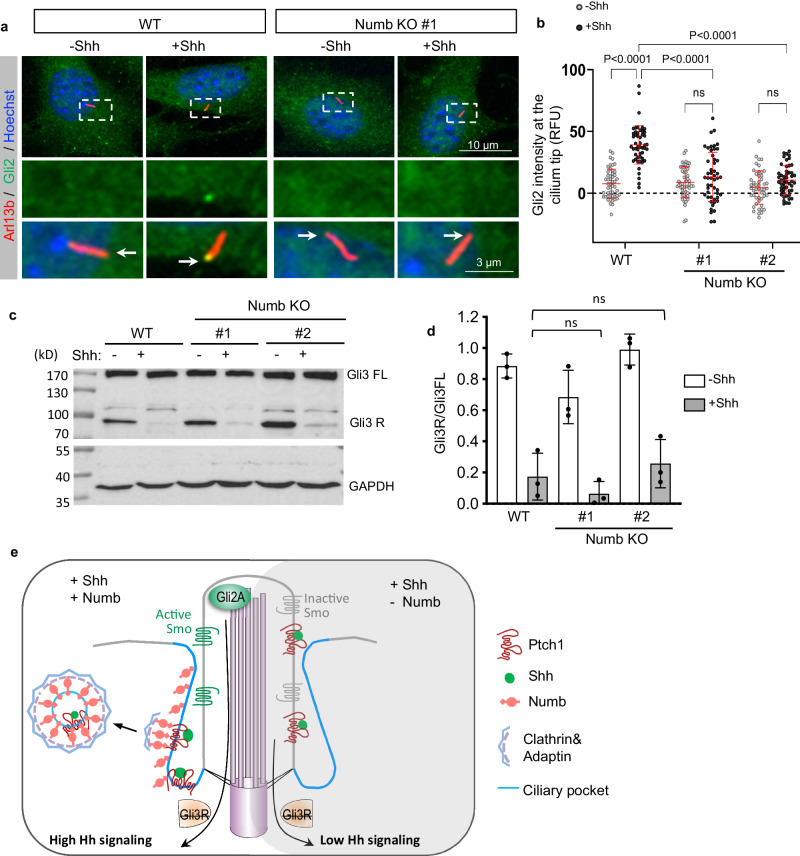
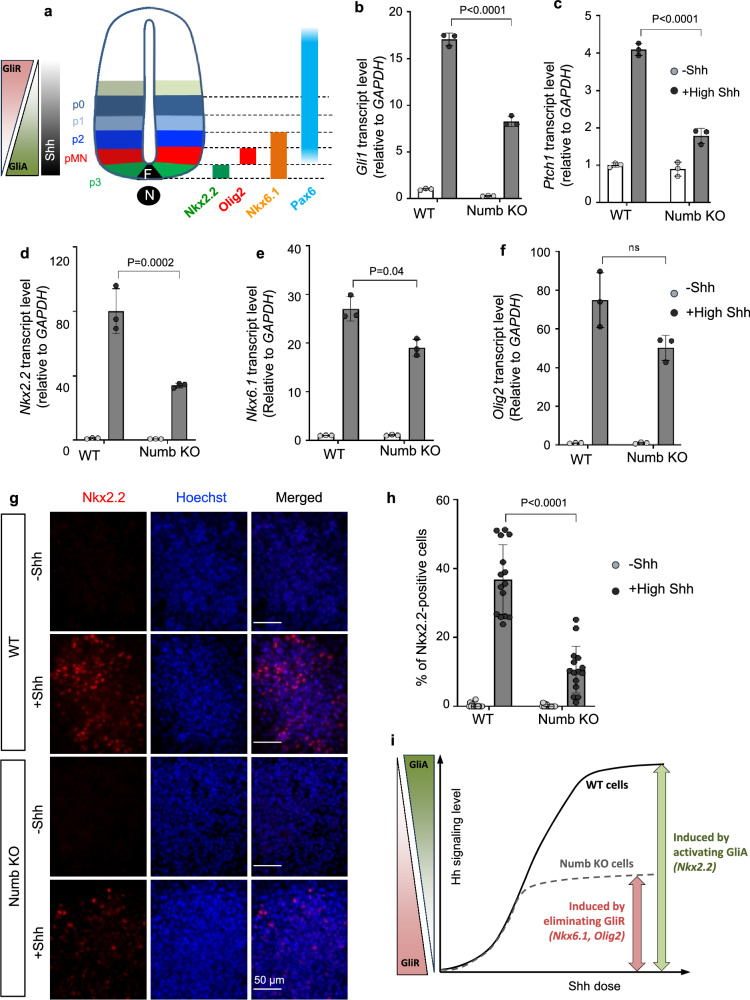
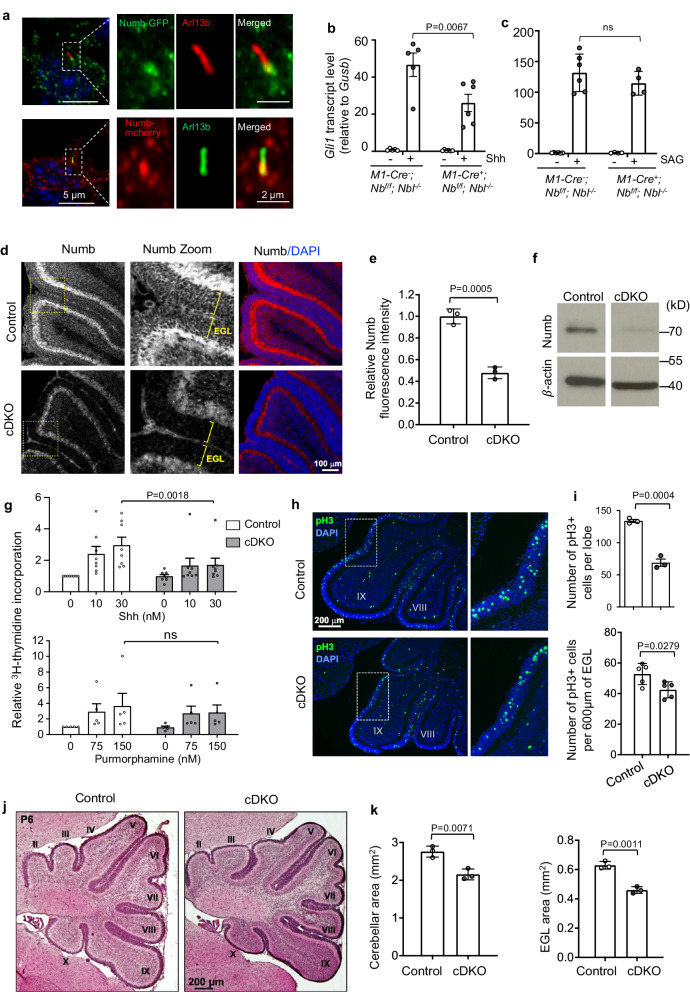
Hedgehog (Hh) signaling relies on the primary cilium, a cell surface organelle that serves as a signaling hub for the cell. Using proximity labeling and quantitative proteomics, we identify Numb as a ciliary protein that positively regulates Hh signaling. Numb localizes to the ciliary pocket and acts as an endocytic adaptor to incorporate Ptch1 into clathrin-coated vesicles, thereby promoting Ptch1 exit from the cilium, a key step in Hh signaling activation. Numb loss impedes Sonic hedgehog (Shh)-induced Ptch1 exit from the cilium, resulting in reduced Hh signaling. Numb loss in spinal neural progenitors reduces Shh-induced differentiation into cell fates reliant on high Hh activity. Genetic ablation of Numb in the developing cerebellum impairs the proliferation of granule cell precursors, a Hh-dependent process, resulting in reduced cerebellar size. This study highlights Numb as a regulator of ciliary Ptch1 levels during Hh signal activation and demonstrates the key role of ciliary pocket-mediated endocytosis in cell signaling.


Conflict of interest statement

Tess C. Branon is an employee of Interline Therapeutics, South San Francisco, CA, USA. The remaining authors declare no competing interests.

Figures

Fig. 1
Fig. 1. Cilium-TurboID selectively biotinylates ciliary proteins.
a Schematics of the truncated Arl13b constructs used. Y and N indicate whether the corresponding construct localizes to the cilium or not, respectively. Y/N: this construct localizes to both the cilium and the cytosol. “+”: the degree of cilium elongation in NIH3T3 cells transiently transfected with the corresponding constructs. “-”: cilium length is not impacted. b Immunofluorescence of stable NIH3T3 cell lines expressing cilium-TurboID (N + RVEP-PR-EGFP-TurboID) or non-cilium-TurboID (PR-EGFP-TurboID) before and after biotin labeling. Cells were serum-starved for 24 h, incubated with 50 μΜ biotin for 10 min at 37 °C, and fixed for immunostaining. The cilium is labeled by immunostaining for acetylated-tubulin (red, ac-tubulin), and the biotinylated proteins were detected via streptavidin-Alexa Fluor 647 (magenta). Cilium-TurboID and non-cilium TurboID were detected by immunostaining for EGFP (green). Scale bars, 10 µm in all panels. Experiments were performed three times with similar results.
Fig. 2
Fig. 2. Quantitative proteomics with cilium-TurboID identified novel ciliary proteins.
a Biotinylated proteins from cell lysates of cilium-TurboID and non-cilium-TurboID cells were isolated by streptavidin beads and analyzed by Western blotting. The overall biotinylated proteins were detected by streptavidin-HRP. PDGFRα is a receptor known to localize to the cilium. In the Arl13b blot, the bands at 70kD represent the transgene, and the bands at 55 kD represent endogenous Arl13b. Experiments were performed three times with similar results. b Design and workflow of the cilium proteomics experiment. Samples were prepared in triplicate. After TMT labeling, all samples were pooled together before being fractionated by UPLC and analyzed by mass spectrometry. c Heatmap of the ciliary abundance of the 800 ciliary candidates. Clustering of the relative abundances of each identified protein (rows) in individual samples (columns) was performed based on Ward’s minimum variance method. The relative abundance was calculated within one set of samples that contains all four conditions. For example, A1, B1, C1, D1 belong to one set, and the relative abundance is calculated as A1/(A1 + B1 + C1 + D1) etc. The panel on the right side indicates the color scheme of relative abundances (percentage). d Volcano plot of statistical significance versus the average ratio of protein enrichment for all ciliary candidates. The ratio was calculated as TMT signal intensity of Shh-treated samples (A) compared to non-Shh treated samples (B) in the presence of biotin labeling. The analytical procedure for identifying ciliary candidates from the mass spectrometry results is described in supplementary Fig. 3. The previously reported ciliary proteins are highlighted as black dots. e GO enrichment analysis of cellular components was plotted according to the rich factor in Metascape. The top 20 enriched cellular components are represented in the scatter plot. The p values in (d) and (e) were adjusted for multiple testing via the Benjamini-Hochberg procedure. Source data are provided as a Source Data file.
Fig. 3
Fig. 3. Numb localizes to the ciliary pocket and incorporates Ptch1 into clathrin-coated vesicles.
a Numb localizes to the lower section of the primary cilium when expressed in NIH3T3 cells. Cilium is highlighted by Arl13b staining. White arrow points to the lower section of the cilium; white triangle points to the ciliary tip where Numb immunofluorescence is absent. b NIH3T3 cells were co-transfected with Numb-mCherry and EHD1-GFP, and subjected to expansion microscopy. The displayed image corresponds to a single focal plane encompassing the lower segment of the cilium axoneme. Arrows point to the ciliary pocket where Numb and EHD1 exhibit colocalization; white triangles indicate Numb-containing puncta located adjacent to the cilium. The right panel shows the results of the linescan at the position marked by the cyan arrow. c Representative image of ImmunoEM on NIH3T3 cells expressing Numb-HA. CP Ciliary pocket, Ax axoneme, BB basal body. d NIH3T3 cells were co-transfected with Numb-GFP and clathrin-mCherry, and subjected to expansion microscopy. The displayed image corresponds to a single focal plane. White triangles point to the Numb-containing CCVs. Cyan triangles point to Numb-containing CCVs still in conjunction with the ciliary pocket. e Diagram illustrating Numb’s localization to the ciliary pocket and to CCVs situated in proximity to the ciliary pocket. f Co-immunoprecipitation results from 293 T cells transfected with Ptch1-EGFP and Numb-HA. Asterisk indicates a non-specific band. g Co-immunoprecipitation results from NIH3T3 cells treated with Shh. h Representative images showing that Ptch1 is incorporated into Numb-containing CCVs near the ciliary pocket. i Colocalization coefficient of Numb-V5 and Ptch1-YFP or YFP. A total of 30 cells were quantified for each experimental condition. All experiments in (ah) were performed three times with similar results. Data in (i) are presented as mean ± SD. Statistics: Two-way ANOVA with multiple comparisons (Tukey test), ns not significant. Source data are provided as a Source Data file.
Fig. 4
Fig. 4. Numb is required for Shh-induced Ptch1 exit from the cilium.
a Western blot analysis showing the absence of Numb protein in the Numb CRISPR/Cas9 knockout cell clones. Experiments were performed three times with similar results. b Wild type (WT) or Numb KO cells were pre-treated with SAG for 24 h to induce Ptch1 expression and cilium accumulation, followed by Shh stimulation for 1 h, and subsequently fixed for immunofluorescence staining. The cilia were marked by acetylated-tubulin (red). c Quantification of Ptch1 intensity in the cilium. Data are shown as mean ± SD. A total of 87 cells were quantified for each experimental condition. Statistics: Two-way ANOVA with multiple comparisons (Tukey test). ns not significant. Source data are provided as a Source Data file.
Fig. 5
Fig. 5. Numb is required for maximal activation of Hh signaling.
a Diagram of the Hh signaling cascade. Numb regulates Hh signaling at the level of Ptch1; SmoM2 actives Hh signaling independent of Shh. b, c Hh signaling levels in WT or Numb KO cells were assessed by the transcript levels of the Hh-target genes, Gli1 and Ptch1, via qPCR. d Hh signaling levels in WT cells and Numb KO cells that express Numb-V5 or the blank vector. Hh activity was assessed by Gli1 transcript levels. e, f Western blot analysis and quantification of Gli1 protein levels in WT and Numb KO cells. Prior to harvesting, cells were stimulated with 1 μg/ml Shh in the low serum culture medium for 24 h. g SAG-induced Hh signaling levels in WT cells and Numb KO cells. Prior to harvesting, cells were treated with the indicated doses of SAG in the low serum culture medium for 24 h. h Hh signaling activity in WT cells and Numb KO cells infected with lentiviruses that express SmoM2. All experiments were repeated three to four times with similar results. Data are shown as mean ± SD. Statistics in (b, c, d, f, g, h): Two-way ANOVA with multiple comparisons (Tukey test). ns not significant. Source data are provided as a Source Data file.
Fig. 6
Fig. 6. Numb loss blocks the activation of Gli transcription activator.
a Immunofluorescence staining of endogenous Gli2 in the cilia of WT or Numb KO cells. The cells were treated in low serum medium for 24 h, with or without Shh. Enlarged views of highlighted areas are displayed at the bottom. Arrows point to Gli2 fluorescence signal at the cilium tips. b Quantification of Gli2 fluorescence intensity at the cilium tips. A total of 50 cilia were quantified per condition. RFU, relative fluorescence unit. c, d Western blot results and quantification of Gli3 processing in WT and Numb KO cells. Cells were stimulated with Shh for 24 h prior to harvest. e Schematic of Numb’s role during the activation of Hh signaling. Upon Shh binding to Ptch1, Numb in the ciliary pocket (blue lines) recruits Ptch1-Shh complex into clathrin-coated vesicles, thereby facilitating the removal of Ptch1 from the cilium. Ptch1’s efficient clearance from the cilium sets the stage for the complete activation of Smo and Gli2 transcription factors. This activation ultimately culminates in the maximal activation of Hh signaling. In the absence of Numb, Ptch1 remains in the cilium even after it binds to Shh. This leads to only a partial activation of Smo, which ceases Gli3R production but is insufficient to activate Gli2. As a result, Hh signaling is only moderately activated. Results from three independent experiments are analyzed. Data are shown as mean ± SD. Statistics in (b, d): Two-way ANOVA with multiple comparisons (Tukey test). ns, not significant. Source data are provided as a Source Data file.
Fig. 7
Fig. 7. Numb is required for high-level Hh responses in mouse spinal cord neural progenitor cells (NPCs).
a Diagram illustrating embryonic spinal cord progenitors and their associated markers (adapted from Ribes et al. ). The bars on the right side depict the specific transcription factors in their respective domains. N notochord, FP floor plate, pMN motor neuron progenitors; p0, p1, p2, and p3, ventral interneuron progenitors. b, c Hh signaling activity was assessed by the transcript levels of Hh-target genes, Gli1 and Ptch1, in WT and Numb KO mouse spinal cord NPCs. NPCs underwent differentiation in two conditions: either retinoic acid (RA) without Shh, or RA with 100 nM Shh (+High Shh) for 3 days. df Transcription levels of specific transcription factors induced by high Shh in WT and Numb KO NPCs. Cells were differentiated in RA-containing medium without or with 100 nM Shh for 3 days. Three independent differentiation experiments were performed with similar results. n = 3 biological replicates. Statistics in (bf): Two-way ANOVA with multiple comparisons (Tukey test). Data are shown as mean ± SD. g Representative images of NPC differentiation into Nkx2.2-positive NPCs after 3 days of induction. h The percentage of cells positive for Nkx2.2 in WT or Numb KO NPCs. n = 15 images from three independent experiments were quantified for each condition. Each image represents one NPC colony consisting of approximately 200–300 cells. Data are shown as mean ± SD. Statistics: Two-way ANOVA with multiple comparisons (Tukey test). i Schematics of Hh signaling and NPC differentiation. NPC cell fate in the spinal cord is ultimately determined by the opposing gradient of Gli activator (GliA) and Gli repressor (GliR). In Numb-null ES cells, even with high Hh stimulation, GliA activation is impeded, but cells are still able to curb Gli3R production. Consequently, Numb-null ES cells fail to differentiate into cell fates that depend on GliA (Nkx2.2-positive NPC) but are able to differentiate into cell fates that are reliant on Gli3R elimination (Olig2- or Nkx6.1-positive NPCs). Source data are provided as a Source Data file.
Fig. 8
Fig. 8. Numb is required for Hh signaling and Shh-induced proliferation in GCPs.
a Numb localizes to the bottom section of the primary cilium in cultured GCPs. GCPs infected with lentivirus expressing Numb-GFP or Numb-mCherry were co-stained with Arl13b. Experiments were performed three times with similar results. b, c Hh signaling activity in GCPs isolated from P6 mice. GCPs were cultured in the presence of 1 nM Shh (b) or 150 nM SAG (c) for 20 h. mRNA was isolated and Gli1 mRNA levels were measured by qRT-PCR. n = 4–6 animals per condition. M1-Cre, Math1-Cre; Nb, Numb; Nbl, Numblike. d Sagittal sections of cerebellum from P6 control and Numb;Numbl cDKO mice immunostained for Numb. The immunofluorescence intensity of Numb in the EGL of cDKO cerebellum is lower than the control cerebellum. Boxes indicate the zoomed regions. Brackets denote the EGL. e Quantification of the mean Numb fluorescence intensity in the EGL. n = 3 cerebella per group. f Western blotting showing that Numb protein is reduced in GCPs isolated from cDKO cerebellum. g GCPs isolated from P6 cerebellum were cultured for 48 h in the presence of Shh or Purmorphamine. GCP proliferation was measured by 3H-thymidine incorporation. n = 8 experiments (Shh) and 5 experiments (Purmorphamine), and each condition included 1–5 animals. h Sagittal sections of cerebellum at the same mediolateral levels from P6 control and cDKO mice immunostained for the mitotic marker pH3. Boxes indicate zoomed regions. i Quantification of the number of pH3-positive cells in the EGL in one lobe of the cerebellum, and pH3-positive cells per 600 μm of the EGL. n = 3 or 5 cerebella per group. j Sagittal sections of cerebellum at the same mediolateral levels from P6 control and cDKO mice, stained with H&E. Roman numerals indicate lobules. k Quantification of the cerebellar area and EGL area in P6 mice measured at the same mediolateral level. n = 3 cerebella per group. All results are shown as mean ± SEM. Statistics in (e, i, k): two-tailed Student’s t-test. Statistics in (b, c, g): Two-way ANOVA. ns not significant. Source data are provided as a Source Data file.

References

    1. Eggenschwiler JT, Anderson KV. Cilia and developmental signaling. Annu. Rev. Cell Dev. Biol. 2007;23:345–373. doi: 10.1146/annurev.cellbio.23.090506.123249. - DOI - PMC - PubMed
    1. Goetz SC, Anderson KV. The primary cilium: a signalling centre during vertebrate development. Nat. Rev. Genet. 2010;11:331–344. doi: 10.1038/nrg2774. - DOI - PMC - PubMed
    1. Huangfu D, et al. Hedgehog signalling in the mouse requires intraflagellar transport proteins. Nature. 2003;426:83–87. doi: 10.1038/nature02061. - DOI - PubMed
    1. Rohatgi R, Milenkovic L, Scott MP. Patched1 regulates hedgehog signaling at the primary cilium. Science. 2007;317:372–376. doi: 10.1126/science.1139740. - DOI - PubMed
    1. Kim J, Kato M, Beachy PA. Gli2 trafficking links Hedgehog-dependent activation of smoothened in the primary cilium to transcriptional activation in the nucleus. Proc. Natl Acad. Sci. 2009;106:21666–21671. doi: 10.1073/pnas.0912180106. - DOI - PMC - PubMed

Publication types

MeSH terms