. 2024 Apr 25;15(1):3508.
doi: 10.1038/s41467-024-47774-8.

Travel surveillance uncovers dengue virus dynamics and introductions in the Caribbean

Affiliations

Travel surveillance uncovers dengue virus dynamics and introductions in the Caribbean

Emma Taylor-Salmon et al. Nat Commun. .

Abstract

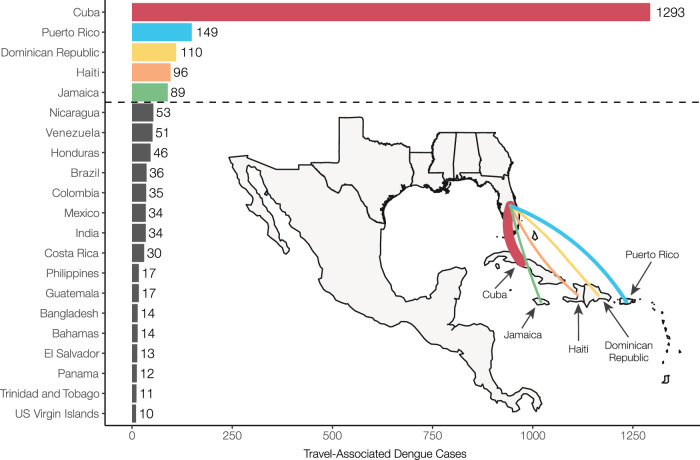
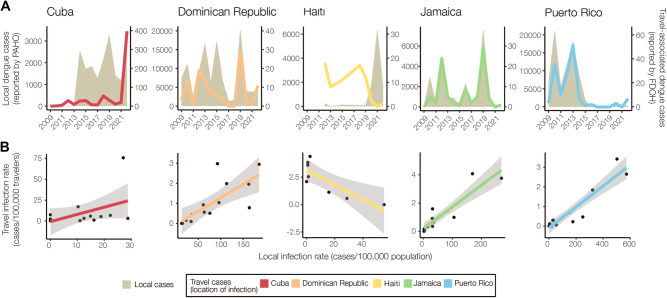
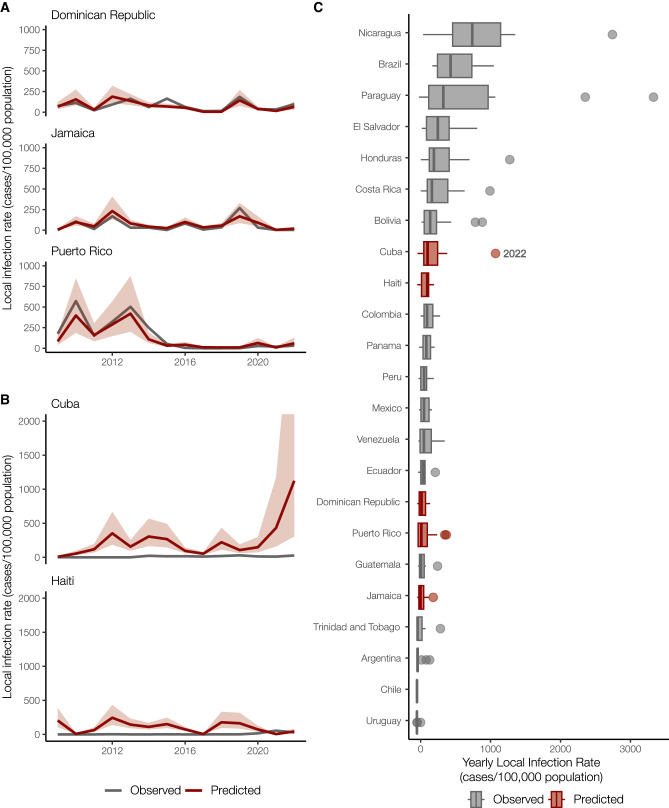
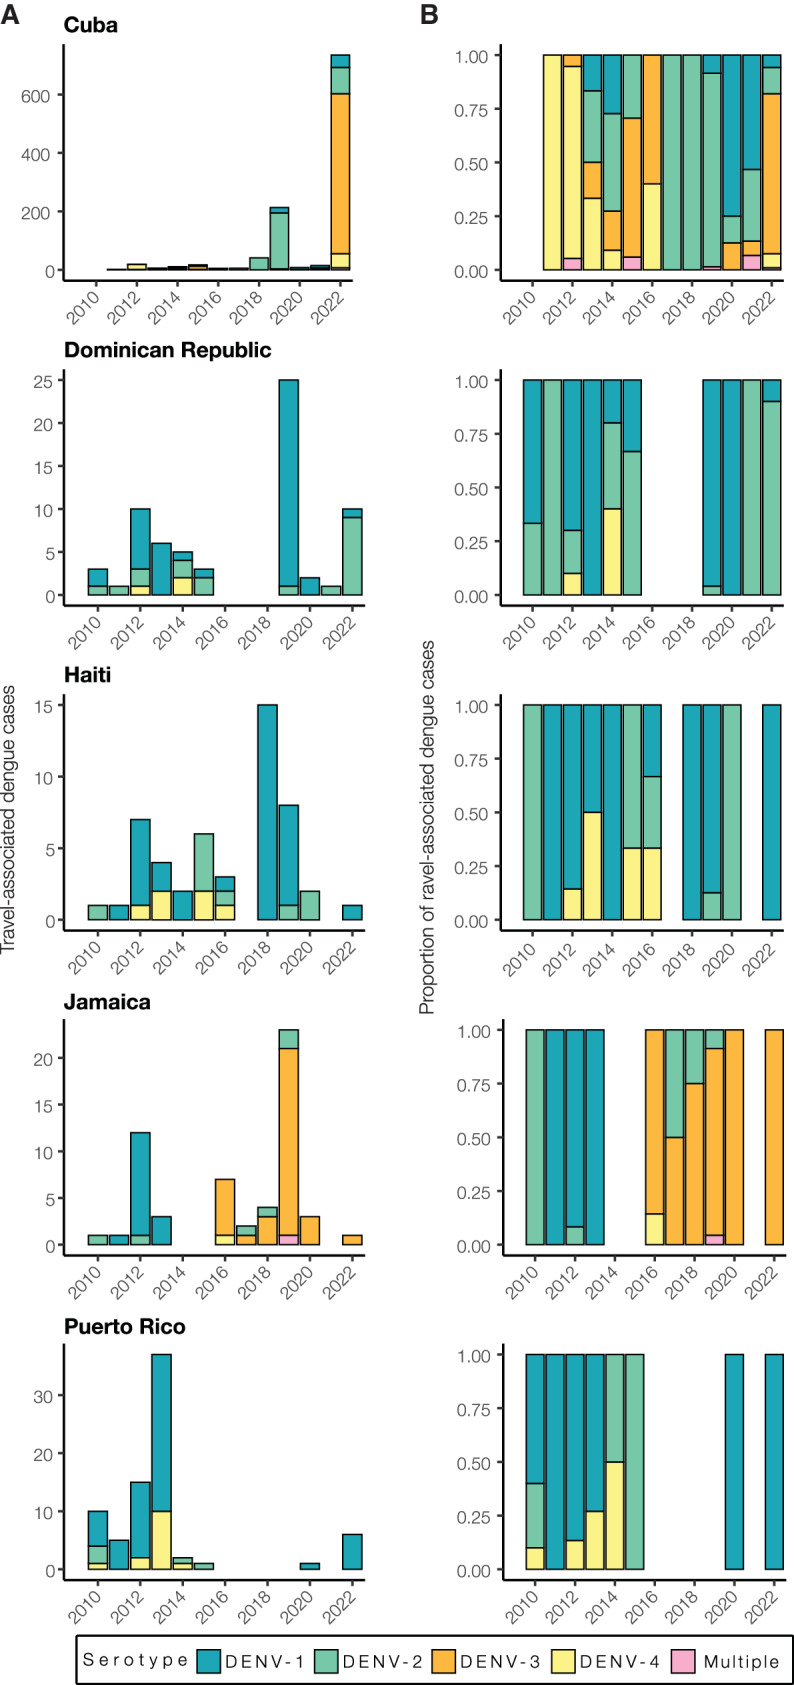
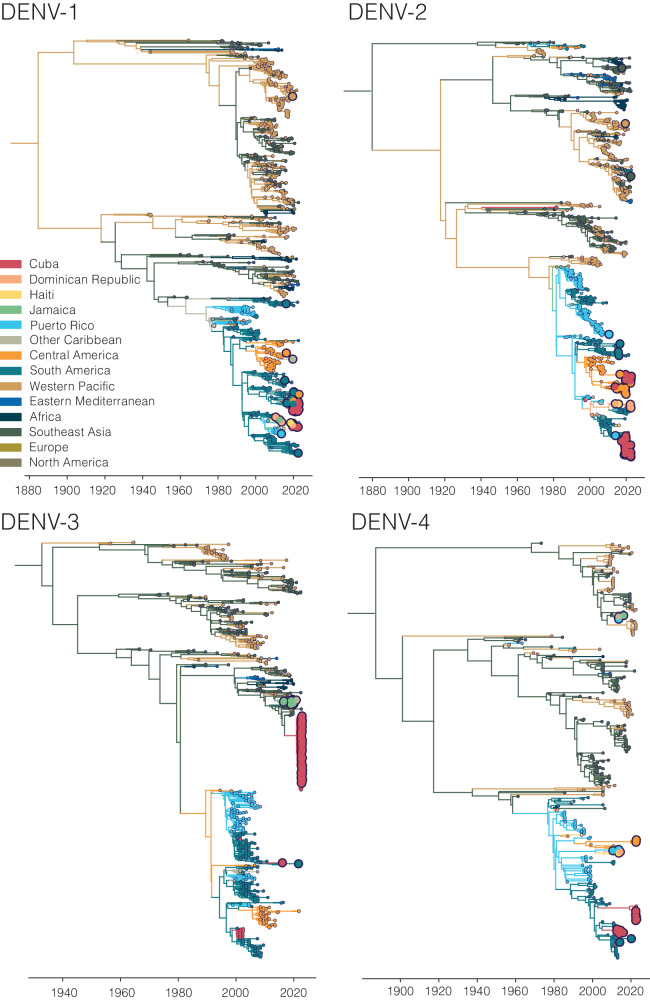
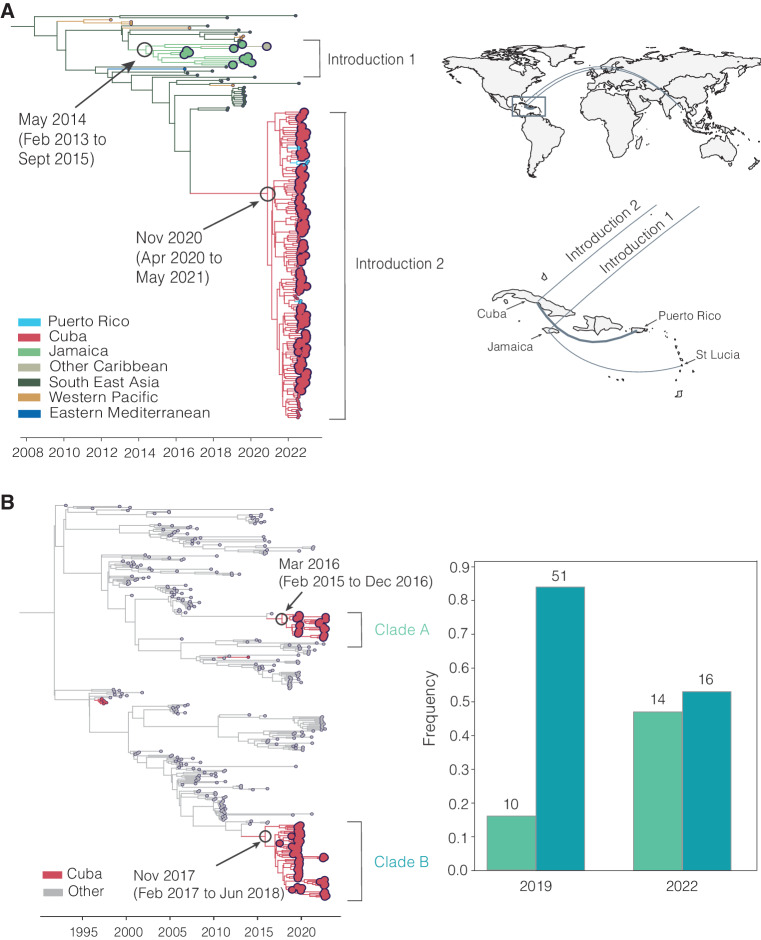
Dengue is the most prevalent mosquito-borne viral disease in humans, and cases are continuing to rise globally. In particular, islands in the Caribbean have experienced more frequent outbreaks, and all four dengue virus (DENV) serotypes have been reported in the region, leading to hyperendemicity and increased rates of severe disease. However, there is significant variability regarding virus surveillance and reporting between islands, making it difficult to obtain an accurate understanding of the epidemiological patterns in the Caribbean. To investigate this, we used travel surveillance and genomic epidemiology to reconstruct outbreak dynamics, DENV serotype turnover, and patterns of spread within the region from 2009-2022. We uncovered two recent DENV-3 introductions from Asia, one of which resulted in a large outbreak in Cuba, which was previously under-reported. We also show that while outbreaks can be synchronized between islands, they are often caused by different serotypes. Our study highlights the importance of surveillance of infected travelers to provide a snapshot of local introductions and transmission in areas with limited local surveillance and suggests that the recent DENV-3 introductions may pose a major public health threat in the region.


Conflict of interest statement

N.D.G. is a paid consultant for BioNTech for work unrelated to this manuscript. All other authors declare no competing interests.

Figures

Fig. 1
Fig. 1. Cuba, Dominican Republic, Haiti, Jamaica, and Puerto Rico make up the majority of travel-associated dengue cases reported in Florida from 2009 to 2022.
Countries and territories are listed by total number of travel cases for each inferred origin of infection based on travel history, in descending order. Only countries or territories with at least 10 associated travel infections are shown. The complete data can be found in Supplementary Table S1. The inset shows a map of the location of the top 5 associated country origins of travel cases reported in Florida, with the line width proportional to the number of travel cases.
Fig. 2
Fig. 2. Travel surveillance from Florida correlates with local dengue infection rates in endemic countries and territories with robust local surveillance and case reporting.
A Yearly local dengue cases (left y-axis, gray shaded area) reported by PAHO and yearly travel-associated dengue cases (right y-axis, colored lines) reported by FDOH were sorted by the origin of exposure. The datasets were compared using Pearson’s correlation coefficient. There were strong positive correlations between travel and local cases for the Dominican Republic (Pearson r = 0.764, p = 0.001), Jamaica (r = 0.960, p < 0.001), and Puerto Rico (r = 0.911, p < 0.001), with no significant correlation for Cuba (r = 0.498, p = 0.070) and a negative correlation for Haiti (r = −0.694, p = 0.056). B The local dengue virus incidence rates for each country or territory were calculated by the number of locally reported cases per month per 100,000 population. The travel dengue virus incidence rates for each country or territory of presumed exposure were calculated by the number of travel-associated cases per month per 100,000 air passenger journeys entering Florida from endemic locations. Colored lines represent a two-sided linear regression model with local infection rate as the predictor variable and travel infection rate as the outcome variable. Gray shaded area represents standard error. There were strong positive correlations between travel and local incidence for the Dominican Republic (Pearson r = 0.750, p = 0.002), Jamaica (r = 0.912, p < 0.001), and Puerto Rico (r = 0.935, p < 0.001), with no significant correlation for Cuba (r = 0.458, p = 0.100) and a negative correlation for Haiti (r = −0.825, p = 0.012). The negative correlation between the local and travel infection rates may have been driven by a decreased travel volume to Florida from 2020 to 2022 (Supplementary Fig. S2).
Fig. 3
Fig. 3. Travel infection rates provide an estimate of local dengue infections.
A Local and travel-associated dengue infection rates from the Dominican Republic, Jamaica, and Puerto Rico were used as predictors in a negative binomial regression model due to the strong correlations between local and travel-associated cases. The red lines indicate the predicted mean infection rates, and the shaded area indicates the 95% confidence interval, while the gray lines indicate the local dengue cases as reported to PAHO. B Local dengue infection rates in Cuba and Haiti from 2009 to 2022 were predicted using the model from panel A. The colored lines indicate the predicted mean infection rates, and the shaded area indicates the 95% prediction interval, while the gray lines indicate the local dengue cases as reported to PAHO. C Observed and predicted local infection rates for South American and Caribbean countries and territories with populations over one million inhabitants from 2009 to 2023. Within each box, thick vertical lines denote median values (50th percentile); boxes extend from the 25th to the 75th percentile; horizontal lines extending from boxes denote mark the 5th and 95th percentiles, and the dots denote outliers, representing large outbreaks from any year. Locations in gray with observed cases were not included in our model.
Fig. 4
Fig. 4. Dengue outbreaks in the Caribbean are due to different serotypes, even during the same year.
A Yearly travel-associated dengue cases by serotype were reported by FDOH and sorted by country or territory of likely exposure. B The relative proportions of yearly travel-associated dengue cases by serotype per year and per country or territory of likely exposure, normalized to account for the number of infected travelers.
Fig. 5
Fig. 5. Sequencing travel-associated dengue cases reveals genomic diversity within the Caribbean.
Time-resolved phylogenies of each serotype, with the branches and tips colored by inferred and sampled locations respectively. Larger dots represent those DENV samples sequenced for this study.
Fig. 6
Fig. 6. Phylogenetic patterns of dengue virus emergence, spread, and transmission in the Caribbean.
A Time-revolved phylogeny showing global spread of DENV-3 genotype III. The times of the most common ancestor of the clades are taken conservatively as introduction times, with 95% HPDs indicated in parentheses, and are indicated by circles. The map shows the transitions from Southeast Asia to Cuba and Jamaica and within the Caribbean. Countries or territories involved are indicated on the map, and virus transitions are indicated by lines going counter-clockwise, with thickness indicating a number of movements. B Time-resolved phylogeny shows two co-circulating DENV-2 (genotype III) clades in Cuba, which are colored in red, with 95% HPDs indicated in parentheses. The bar chart shows the frequencies of each clade in 2019 and 2022.

Update of

  • Travel surveillance uncovers dengue virus dynamics and introductions in the Caribbean.
    Taylor-Salmon E, Hill V, Paul LM, Koch RT, Breban MI, Chaguza C, Sodeinde A, Warren JL, Bunch S, Cano N, Cone M, Eysoldt S, Garcia A, Gilles N, Hagy A, Heberlein L, Jaber R, Kassens E, Colarusso P, Davis A, Baudin S, Rico E, Mejía-Echeverri Á, Scott B, Stanek D, Zimler R, Muñoz-Jordán JL, Santiago GA, Adams LE, Paz-Bailey G, Spillane M, Katebi V, Paulino-Ramírez R, Mueses S, Peguero A, Sánchez N, Norman FF, Galán JC, Huits R, Hamer DH, Vogels CBF, Morrison A, Michael SF, Grubaugh ND. Taylor-Salmon E, et al. medRxiv [Preprint]. 2023 Nov 12:2023.11.11.23298412. doi: 10.1101/2023.11.11.23298412. medRxiv. 2023. Update in: Nat Commun. 2024 Apr 25;15(1):3508. doi: 10.1038/s41467-024-47774-8. PMID: 37986857 Free PMC article. Updated. Preprint.

References

    1. Kimberlin, D. W., Barnett, E., Lynfield, R. & Sawyer, M. H. Red Book 2021: Report of the Committee on Infectious Diseases. (American Academy of Pediatrics, 2021).
    1. Guzman MG, Harris E. Dengue. Lancet. 2015;385:453–465. doi: 10.1016/S0140-6736(14)60572-9. - DOI - PubMed
    1. Bhatt S, et al. The global distribution and burden of dengue. Nature. 2013;496:504–507. doi: 10.1038/nature12060. - DOI - PMC - PubMed
    1. Waggoner JJ, et al. Homotypic Dengue Virus Reinfections in Nicaraguan Children. J. Infect. Dis. 2016;214:986–993. doi: 10.1093/infdis/jiw099. - DOI - PMC - PubMed
    1. Christie CDC, Lue AM, Melbourne-Chambers RH. Dengue, chikungunya and zika arbovirus infections in Caribbean children. Curr. Opin. Pediatr. 2023;35:155–165. doi: 10.1097/MOP.0000000000001229. - DOI - PMC - PubMed

Publication types