. 2024 Apr 25;15(1):3520.
doi: 10.1038/s41467-024-47773-9.

Purines enrich root-associated Pseudomonas and improve wild soybean growth under salt stress

Affiliations

Purines enrich root-associated Pseudomonas and improve wild soybean growth under salt stress

Yanfen Zheng et al. Nat Commun. .

Abstract

The root-associated microbiota plays an important role in the response to environmental stress. However, the underlying mechanisms controlling the interaction between salt-stressed plants and microbiota are poorly understood. Here, by focusing on a salt-tolerant plant wild soybean (Glycine soja), we demonstrate that highly conserved microbes dominated by Pseudomonas are enriched in the root and rhizosphere microbiota of salt-stressed plant. Two corresponding Pseudomonas isolates are confirmed to enhance the salt tolerance of wild soybean. Shotgun metagenomic and metatranscriptomic sequencing reveal that motility-associated genes, mainly chemotaxis and flagellar assembly, are significantly enriched and expressed in salt-treated samples. We further find that roots of salt stressed plants secreted purines, especially xanthine, which induce motility of the Pseudomonas isolates. Moreover, exogenous application for xanthine to non-stressed plants results in Pseudomonas enrichment, reproducing the microbiota shift in salt-stressed root. Finally, Pseudomonas mutant analysis shows that the motility related gene cheW is required for chemotaxis toward xanthine and for enhancing plant salt tolerance. Our study proposes that wild soybean recruits beneficial Pseudomonas species by exudating key metabolites (i.e., purine) against salt stress.


Conflict of interest statement

The authors declare no competing interests.

Figures

Fig. 1
Fig. 1. The soil physicochemical properties and wild soybean growth affected by salt stress.
a Soil EC of control (0 mM NaCl) and salt treatments (100, 200 and 300 mM NaCl) after 1, 7 and 14 days of salt stress (n = 4 biologically independent samples). Abbreviation: EC, electrical conductivity. b Soil total nitrogen of control and salt treatments after 14 days of salt stress (n = 4 biologically independent samples). c Soil total carbon of control and salt treatments after 14 days of salt stress (n = 4 biologically independent samples). d The growth of wild soybean under control and different salt treatments. e Root length, plant height, leaf size, root weight and shoot weight of wild soybean in control and different salt treatments. The number of samples per treatment in (e) is as follows: control (n = 35), 100 mM (n = 36), 200 mM (n = 34), and 300 mM (n = 27). All data in this figure are mean ± SEM. Different letters above the bars in figures (b, c, e) indicate a significant difference at P < 0.05 (one-way ANOVA with correction by Tukey’s HSD test, P-values are shown in source data). Source data are provided as a Source Data file.
Fig. 2
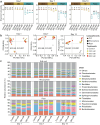
Fig. 2. The impacts of salt stress on bacterial diversity and composition of wild soybean based on 16S rRNA gene amplicon data.
a The impacts of salt stress on bacterial diversity (Shannon index) of bulk soil, rhizosphere soil and root after 1, 7 and 14 days of salt stress (n = 4 biologically independent samples, mean ± SEM). Different letters above the boxes of each compartment indicate a significant difference at P < 0.05 (one-way ANOVA with correction by Tukey’s HSD test, P-values are shown in source data). Abbreviation: Rh, rhizosphere. b PCoA ordination of the Bray-Curtis dissimilarity matrix (OTU level) for control and salt treatments across bulk soil, rhizosphere soil and root after 1, 7 and 14 days of salt stress. Statistical analysis was performed using ANOSIM (analysis of similarities). c Percent relative abundance of the top 15 most abundant orders for bulk soil, rhizosphere soil, and root across control and different levels of salt stress. Different significance levels between control and each salt treatment are marked with asterisks (*P < 0.05, **P < 0.01 and ***P < 0.001, two-sided Student’s t-test, P-values are shown in source data). Low abundance orders (< 1.5%) with significant difference are not marked with asterisks. White asterisks indicate the relative abundance of this order is lower in salt treatments than that in control group. Dark asterisks indicate the relative abundance of this order is higher in salt treatments than that in control group. Source data are provided as a Source Data file.
Fig. 3
Fig. 3. Pseudomonas enriched in salt-treated root and rhizosphere samples.
ac The enriched or depleted genera by different levels of salt stress across root (a), rhizosphere (b) and bulk soil (c) are visualized with dot plot (left). The relative abundance of each genus in different treatments is shown with bar plot (right). Blue word indicates the most abundant taxon among all enriched genera. The “_n” prefix in figures (ac) indicate the taxonomic assignment was unknown at the genus level. d The relative abundance of Pseudomonas in the rhizosphere soil based on 16S rRNA gene amplicon data. e The relative abundance of Pseudomonas in the rhizosphere soil based on metagenomic data. f The relative abundance of Pseudomonas in the rhizosphere soil based on metatranscriptomic data. Values are means ± SEM for (d) (n = 4 biologically independent samples), (e) (n = 4 biologically independent samples), and (f) (n = 3 biologically independent samples). Significance between control and each treatment are determined by two-sided Student’s t-test. g Neighbor-Joining tree of all Pseudomonas OTUs and their relative abundance in control and salt treated samples across root and rhizosphere compartments. The predominant OTUs are labled in blue words. Source data are provided as a Source Data file.
Fig. 4
Fig. 4. Plant phenotypes after Pseudomonas inoculation.
Root length (a), plant height (b), root fresh weight (c) and shoot fresh weight (d) of wild soybean inoculated without (Mock) or with strains XN05-1 and YE17 under control and salt stress condition. Tops and bottoms of boxes represent 25th and 75th percentiles, respectively. Horizontal bars within boxes denote medians, and the upper and lower whiskers represent the range of non-outlier data values. All plots are mean ± SEM (n = 20 plants). P-values are calculated by two-sided Student’s t-test. ns, not significant. Source data are provided as a Source Data file.
Fig. 5
Fig. 5. The salt induced functional shift of rhizosphere microbiota.
a The fold change (left) and gene abundance (right) of COG categories in the control and salt treated rhizosphere soil determined by metagenomic analysis. b The fold change (left) and expression level (right) of differentially expressed genes (DEGs) in the control and salt treated rhizosphere soil determined by metatranscriptomic analysis. Low abundance categories in all samples, i.e., extracellular structures (COG W) and nuclear structure (COG Y), were not shown. P-values were calculated by two-sided Student’s t-test (*adjusted P < 0.05 by Benjamini and Hochberg method). c, d The top 15 highest expression levels of DEGs annotated as bacterial chemotaxis (c) and flagellar assembly subcategories (d). e, f The taxonomic annotation of bacterial chemotaxis (e) and flagellar assembly DEGs (f). Source data are provided as a Source Data file.
Fig. 6
Fig. 6. The application of root exudate component xanthine enriched Pseudomonas.
a The Pearson’s correlation of Pseudomonas genus (from 16S rRNA gene amplicon data) and root exudates. The inner lines indicate a statistically significant (Student asymptotic p-value < 0.01) correlation with coefficient < −0.9 (negative correlation: blue lines) or > 0.9 (positive correlation: other lines). The inner colored ring represents the classification of each compound. The middle heatmap is the abundance of compound in three control (inside) and salt-treated roots (200 mM NaCl; outside). The outer ring of bars indicates the log2-fold enrichment (brown bars) or depletion (green bars) of each compound within salt-treated samples compared with control samples. b PCoA ordination of root and rhizosphere soil microbiota between control and xanthine applications (1 and 10 mM). Statistical analysis was performed using ANOSIM (analysis of similarities). c The relative abundance of Pseudomonas genus in root and rhizosphere soil between control and xanthine applications (1 and 10 mM). n = 6 biologically independent samples. d Fresh weight between control, xanthine application alone, Pseudomonas inoculation alone and xanthine applications in presence of Pseudomonas. n = 22 plants per treatment except for 1 mM Xan.+Pse and 10 mM Xan. (n = 23 plants), and for 10 mM Xan.+Pse (n = 21 plants). e, f The chemotaxis of wild-type strains and cheW mutants of strains XN05-1 (e) and YE17 (f) response to 1 mM xanthine. n = 6 biologically independent samples. g Fresh weight of wild soybean inoculated with wild-type strains or cheW mutants of strains XN05-1 and YE17. n = 45 plants for strain XN05-1 and n = 41 plants for strain YE17. Values are means ± SEM for (cg). Significance (cg) was determined using two-sided Student’s t-test P < 0.05. ns, not significant. Source data are provided as a Source Data file.
Fig. 7
Fig. 7. Schematic drawing illustrating the recruitment of Pseudomonas by wild soybean under salt stress.
Soil Pseudomonas was attracted by xanthine secreted by stressed plant, and moved toward rhizosphere through chemotactic motility.

References

    1. Golldack D, Li C, Mohan H, Probst N. Tolerance to drought and salt stress in plants: unraveling the signaling networks. Front. Plant Sci. 2014;5:151. doi: 10.3389/fpls.2014.00151. - DOI - PMC - PubMed
    1. Yuan F, Leng B, Wang B. Progress in studying salt secretion from the salt glands in recretohalophytes: how do plants secrete salt? Front. Plant Sci. 2016;7:977. - PMC - PubMed
    1. Zhou, H. et al. Insights into plant salt stress signaling and tolerance. J. Genet. Genomic. 10.1016/j.jgg.2023.08.007 (2023). - PubMed
    1. Wang Z, Song Y. Toward understanding the genetic bases underlying plant‐mediated “cry for help” to the microbiota. iMeta. 2022;1:e8. doi: 10.1002/imt2.8. - DOI - PMC - PubMed
    1. Zheng Y, et al. Patterns in the microbial community of salt-tolerant plants and the functional genes associated with salt stress alleviation. Microbiol. Spectr. 2021;9:e00767–00721. doi: 10.1128/Spectrum.00767-21. - DOI - PMC - PubMed

Publication types