. 2024 Apr 25;15(1):3483.
doi: 10.1038/s41467-024-47102-0.

Group 3 medulloblastoma transcriptional networks collapse under domain specific EP300/CBP inhibition

Affiliations

Group 3 medulloblastoma transcriptional networks collapse under domain specific EP300/CBP inhibition

Noha A M Shendy et al. Nat Commun. .

Abstract

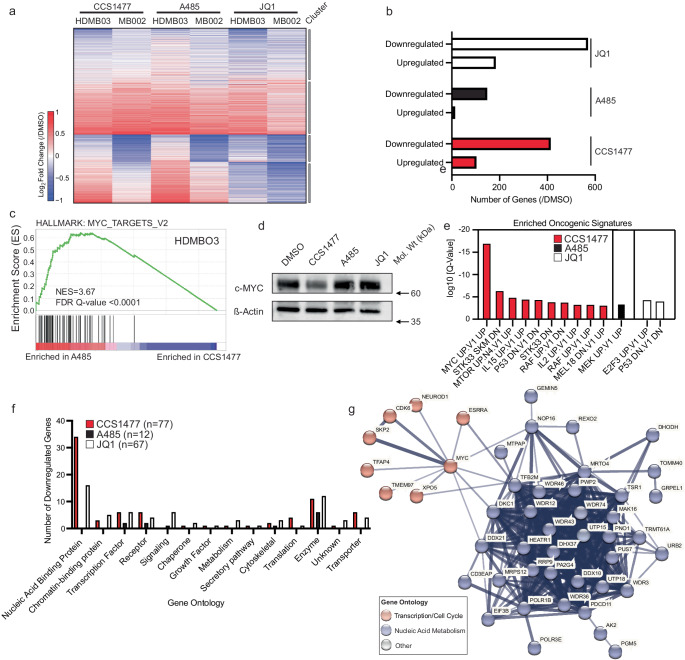
Chemical discovery efforts commonly target individual protein domains. Many proteins, including the EP300/CBP histone acetyltransferases (HATs), contain several targetable domains. EP300/CBP are critical gene-regulatory targets in cancer, with existing high potency inhibitors of either the catalytic HAT domain or protein-binding bromodomain (BRD). A domain-specific inhibitory approach to multidomain-containing proteins may identify exceptional-responding tumor types, thereby expanding a therapeutic index. Here, we discover that targeting EP300/CBP using the domain-specific inhibitors, A485 (HAT) or CCS1477 (BRD) have different effects in select tumor types. Group 3 medulloblastoma (G3MB) cells are especially sensitive to BRD, compared with HAT inhibition. Structurally, these effects are mediated by the difluorophenyl group in the catalytic core of CCS1477. Mechanistically, bromodomain inhibition causes rapid disruption of genetic dependency networks that are required for G3MB growth. These studies provide a domain-specific structural foundation for drug discovery efforts targeting EP300/CBP and identify a selective role for the EP300/CBP bromodomain in maintaining genetic dependency networks in G3MB.


Conflict of interest statement

J.Q. declares other support from Epiphanes and Talus outside the submitted work. B.J.A. is a shareholder of Syros Pharmaceuticals. A.D.D. is a shareholder of Syros Pharmaceuticals and Foghorn Therapeutics. A.D.D., J.Q., Q.L., N.A.M.S. and L.H.S. declare a related patent for small-molecule inhibitors of EP300/CBP and uses thereof. The remaining authors declare no other competing interests.

Figures

Fig. 1
Fig. 1. Chemical targeting of the bromodomains of EP300/CBP causes reduced cell growth in medulloblastoma cells, compared with HAT domain targeting.
a Schematic of compound targeting of EP300 and CBP proteins by either CCS1477 (bromodomain) or A485 (HAT domain)-targeted compounds. Figure created in Biorender.com. EP300 catalytic core structure retrieved from PDB: 6K4N (PDB 10.2210/pdb6K4N/pdb). be TE617T (b), NCIH2122 (c), RhJT (d), and NCIH650 (e) cells were tested for dose-response effects of CCS1477 and A485 after 6 days by Cell-Titer Glo assay. n = 3 independent biological replicates for each dose. Error bars represent S.E.M. Ratio = median normalized AUC ratio. Source data are provided in Source Data file. f Distribution of 454 cancer cell lines subjected to PRISM screening with either CCS1477 or A485. g Normalized AUC ratio values for 454 cell lines tested for CCS1477 or A485 effects in dose response after 5 days. Dots reflect individual cell lines. Dotted line indicates normalized AUC value of 1, where normalized effect of CCS1477 is equal to A485. Arrows denote higher or lower AUC values, representing increased relative effects of A485 (higher) or CCS1477 (lower). Red bars indicate median value of lineages. n = 454 cell lines, 31 tumor types. Source data are provided in Source Data file. h, i HDMBO3 (h) and MB002 (i) group 3 medulloblastoma cell lines were tested for dose-response effects of CCS1477 and A485 after 6 days by Cell-Titer Glo assay. n = 3 independent biological replicates for each dose. Error bars represent S.E.M. Source data are provided in Source Data file.
Fig. 2
Fig. 2. CCS1477 preferentially targets the bromodomains of EP300 and CBP.
a Profiling of CCS1477 (1 µM) against human bromodomains demonstrates preferential interaction of CCS1477 with CBP and EP300, and additional interactions with BD1 of the BET proteins BRD2, BRD3, BRD4 and BRDT (BromoScan by DiscoverX). Tabulated data are shown in Supplementary Table 3. b Representative melting curves from DSF studies of the bromodomains of EP300, CBP and BRD4-BD1 in the presence of CCS1477 or SGC-CBP30 along with a summary graph (n = 3, error bars represent standard deviation, SD). Source data are provided in Source Data file. c Isothermal titration calorimetry (ITC) analysis of the interaction of CCS1477 with the bromodomains of EP300, CBP and BRD4-BD1; Kd values were 25.5 ± 46.3, 4.0 ± 6.7, and 403 ± 137 nM, respectively (n = 1; error represents standard error of mean of technical replicates, SEM). See also Table 1. Source data are provided in Source Data file. d Cocrystal structures of CCS1477 (yellow) bound to CBP (beige, PDB code 8FV2), EP300 (grey, PDB code 8FVF), or BRD4-BD1 (green, PDB code 8FVK). Black dotted lines indicate hydrogen bonding interactions, the critical asparagine residue is highlighted in magenta, water molecules are shown as pink spheres. Crystallographic data and refinement statistics are in Supplementary Tables 5 and 6, the electron density maps of bound inhibitor are in Supplementary Fig. 4. e Mixed H-bonding and Pi-cation interactions (green dotted lines) between the side chain of R1137 and the difluorophenyl-piperidone moiety of CCS1477 in EP300. The same interaction pattern is seen in CBP with R1173, while BRD4-1 lacks an equivalent arginine residue in this region of the binding site. f CCS1477 adopts different conformational states in CBP (beige) and BRD4-BD1 (green), reflecting differences in shape complementarity with the respective KAc sites. g Biotinylated-CCS1477 pulldowns in HDMB03 cell lysates demonstrates pulldown of EP300 and CBP, but not BRD4 at low concentrations, and interaction with EP300, CBP and BRD4 at higher concentrations of compound. Data is representative of n = 3 independent lysates and reactions.
Fig. 3
Fig. 3. Structure-activity relationship (SAR) studies of CCS1477 analogues reveal the importance of compound engagement with R1173 (CBP) or R1137 (EP300) for inhibitory activity.
a Graphical representation of the binding affinity of CCS1477 and analogues thereof for CBP, EP300 and BRD4-BD1 as assessed by DSF. Bars represent the mean and standard deviation for each protein across all inhibitors (n = 3). Source data are provided in Source Data file. b Correlation of ΔTm values for the bromodomains of CBP and EP300. The Pearson’s r and statistical significance P values (two-tailed) are indicated. Error bars represent SD of each DSF experiment (n = 3). Source data are provided in Source Data file. c Correlation of ΔTm and Kd values from MST experiments for compound interaction with CBP. The Pearson’s r and statistical significance p values (two-tailed) are indicated. Error bars represent the standard deviation of each DSF (n = 3) and MST (n = 3) experiment). Tabulated ΔTm and Kd values are shown in Table 1. Source data are provided in Source Data file. dh Co-crystal structures of CBP with compounds 1 (PDB 8FVS), 4 (PDB 8FXA), 5 (PDB 8GA2), 6 (PDB 8FXE), and 7 (PDB 8FXO). Compound structures are shown below co-crystal structures. 2D diagrams of the binding interactions are shown in Supplementary Fig. 5. i Biotinylated-CCS1477 pulldowns in HDMBO3 medulloblastoma cell lysates demonstrates pulldown of EP300 but not BRD4 at low concentrations of CCS1477, and interaction with EP300 and BRD4 at higher concentrations of CCS1477. CCS1477-int1 fails to interact with either EP300 or BRD4 at either concentration. Data is representative of n = 3 independent lysates and reactions. j, k HDMBO3 (j) and MB002 (k) cells were tested for dose-response effects of CCS1477 and CCS1477-int1 after 6 days by Cell-Titer Glo assay. n = 3 independent biological replicates for each dose. Error bars represent S.E.M. CCS1477 data as demonstrated in Fig. 1g, h. Source data are provided in Source Data file.
Fig. 4
Fig. 4. CCS1477 selectively disrupts an interlinked transcriptional genetic dependency network in group 3 medulloblastoma cells including MYC.
a HDMBO3 and MB002 cells were treated with d3 IC50 of CCS1477 (HDMBO3 = 39 nM, MB002 = 1280 nM), A485 (HDMBO3 = 400 nM, MB002 = 1970nM), JQ1 (HDMBO3 = 100 nM, MB002 = 107 nM) or matched concentration of DMSO control for 6 h, followed by ERCC-controlled spike-in RNAseq analysis. DESEQ2 analysis was performed to detect significantly changed transcripts (adjusted p < 0.05 comparing treatment and DMSO). Transcripts that are significant in any treatment or cell line are shown (n = 5092). Heatmap displays k-means ranked clusters of significantly different genes found in HDMBO3 and MBOO2 cells (k = 4, grey bars indicate clusters). b Union of statistically significant up and downregulated transcripts, relative to DMSO controls from (a) found in both HDMB03 and MB002 cells. n = 3 independent biological replicates per treatment. c Gene set enrichment analysis comparing ERCC spike-in normalized transcriptomes of A485 or CCS1477 treated HDMBO3 samples, using the Hallmarks dataset identified the top differentially regulated gene set to be “Hallmarks_MYC_Targets_V2” with an NES = 3.67 and FDR q-value of 0. d HDMBO3 cells were treated with A485 (400 nM), CCS1477 (39 nM) or JQ1 (100 nM) for 6 h followed by lysis for western blotting for c-MYC proteins. β-actin is demonstrated as a loading control. Data is representative of three independent biological replicates and blots. e Metascape analysis using the MSigDB gene set “Oncogenic Signatures” database, demonstrating the log10 q-value of oncogenic signatures lost in genes downregulated by either CCS1477, A485 or JQ1 treatment. f Gene annotations from PANTHER analysis of genetic dependencies in 7 medulloblastoma cell lines that are downregulated by treatment with CCS1477, A485 or JQ1. g String-database analysis of high-stringency CCS1477-downregulated gene dependencies in medulloblastoma cell lines demonstrates a highly interlinked dependency network centered on transcriptional regulation. Line width indicates strength of known protein-protein interactions. Red indicates proteins involved in control of mRNA transcription/cell cycle, blue indicates proteins involved in RNA metabolism.

References

    1. Wimalasena VK, Wang T, Sigua LH, Durbin AD, Qi J. Using chemical epigenetics to target cancer. Mol Cell. 2020;78:1086–1095. doi: 10.1016/j.molcel.2020.04.023. - DOI - PMC - PubMed
    1. Henriques T, et al. Widespread transcriptional pausing and elongation control at enhancers. Genes Dev. 2018;32:26–41. doi: 10.1101/gad.309351.117. - DOI - PMC - PubMed
    1. Scruggs BS, Adelman K. The importance of controlling transcription elongation at coding and noncoding RNA Loci. Cold Spring Harb. Symp. Quant. Biol. 2015;80:33–44. doi: 10.1101/sqb.2015.80.027235. - DOI - PMC - PubMed
    1. Arany Z, Sellers WR, Livingston DM, Eckner R. E1A-associated p300 and CREB-associated CBP belong to a conserved family of coactivators. Cell. 1994;77:799–800. doi: 10.1016/0092-8674(94)90127-9. - DOI - PubMed
    1. Welti J, et al. Targeting the p300/CBP axis in lethal prostate cancer. Cancer Discov. 2021;11:1118–1137. doi: 10.1158/2159-8290.CD-20-0751. - DOI - PMC - PubMed

Publication types

MeSH terms

Substances