

Estimating SARS-CoV-2 infection probabilities with serological data and a Bayesian mixture model
- PMID: 38664455
- PMCID: PMC11045781
- DOI: 10.1038/s41598-024-60060-3
Estimating SARS-CoV-2 infection probabilities with serological data and a Bayesian mixture model
Abstract
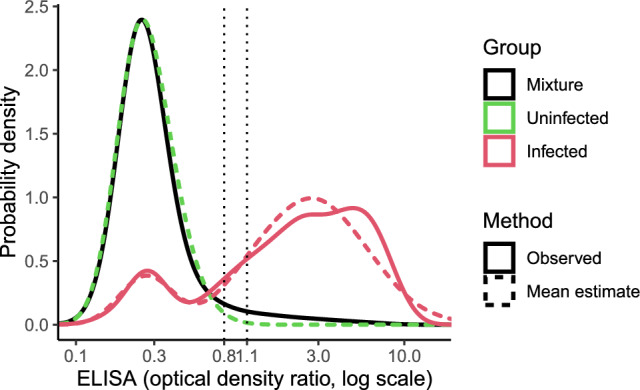
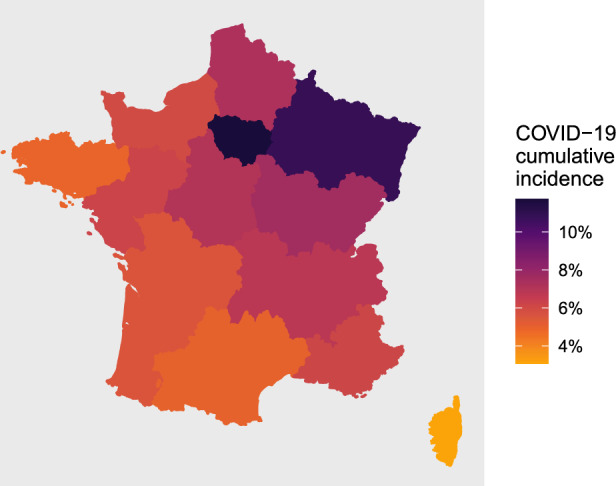
The individual results of SARS-CoV-2 serological tests measured after the first pandemic wave of 2020 cannot be directly interpreted as a probability of having been infected. Plus, these results are usually returned as a binary or ternary variable, relying on predefined cut-offs. We propose a Bayesian mixture model to estimate individual infection probabilities, based on 81,797 continuous anti-spike IgG tests from Euroimmun collected in France after the first wave. This approach used serological results as a continuous variable, and was therefore not based on diagnostic cut-offs. Cumulative incidence, which is necessary to compute infection probabilities, was estimated according to age and administrative region. In France, we found that a "negative" or a "positive" test, as classified by the manufacturer, could correspond to a probability of infection as high as 61.8% or as low as 67.7%, respectively. "Indeterminate" tests encompassed probabilities of infection ranging from 10.8 to 96.6%. Our model estimated tailored individual probabilities of SARS-CoV-2 infection based on age, region, and serological result. It can be applied in other contexts, if estimates of cumulative incidence are available.
Keywords: Bayes’ theorem; COVID-19; Mixture model; SARS-CoV-2.
© 2024. The Author(s).
Conflict of interest statement
The authors declare no competing interests.
Figures

References
Publication types
MeSH terms
Substances
Grants and funding
LinkOut - more resources
Full Text Sources
Medical
Miscellaneous
