. 2024 Sep;31(9):1331-1340.
doi: 10.1038/s41594-024-01290-x. Epub 2024 Apr 25.

ISWI catalyzes nucleosome sliding in condensed nucleosome arrays

Affiliations

ISWI catalyzes nucleosome sliding in condensed nucleosome arrays

Petra Vizjak et al. Nat Struct Mol Biol. 2024 Sep.

Abstract

How chromatin enzymes work in condensed chromatin and how they maintain diffusional mobility inside remains unexplored. Here we investigated these challenges using the Drosophila ISWI remodeling ATPase, which slides nucleosomes along DNA. Folding of chromatin fibers did not affect sliding in vitro. Catalytic rates were also comparable in- and outside of chromatin condensates. ISWI cross-links and thereby stiffens condensates, except when ATP hydrolysis is possible. Active hydrolysis is also required for ISWI's mobility in condensates. Energy from ATP hydrolysis therefore fuels ISWI's diffusion through chromatin and prevents ISWI from cross-linking chromatin. Molecular dynamics simulations of a 'monkey-bar' model in which ISWI grabs onto neighboring nucleosomes, then withdraws from one before rebinding another in an ATP hydrolysis-dependent manner, qualitatively agree with our data. We speculate that monkey-bar mechanisms could be shared with other chromatin factors and that changes in chromatin dynamics caused by mutations in remodelers could contribute to pathologies.


Conflict of interest statement

Competing Interests Statement

We declare no competing interest.

Figures

Extended Data Fig. 1
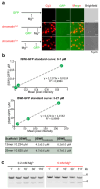
Extended Data Fig. 1. Catalytic activity of ISWI for varying Mg-concentrations.
a, Quality controls for 25mer nucleosome arrays. Left: agarose gel after magnesium precipitation of assembled arrays and the resolubilized pellet. IN, input; SN, supernatant; P, pellet. Competitor DNA derived from the plasmid backbone (< 1 kb) was excluded from P. Middle: Not1 digestion (a Not1 site is present in each linker) liberated mostly mononucleosomes, running around 400 bp, but little 197 bp fragments, confirming saturation of most 601 repeats with octamers. Right: BsiWI digestion (all nucleosomes occlude a BsiWI restriction site) for arrays assembled with different octamer amounts. As 601 sites become saturated, digestion is hindered. Arrays were reconstituted 16 times with similar results. b, Increasing Mg2+-concentrations reduce mononucleosome-stimulated ATP hydrolysis rates. Saturating concentrations of ATP (1 mM) and mononucleosomes were used (1.33 μM). Control experiments with three times lower mononucleosome concentrations gave the analogous results. c, Nucleosome array as in Fig. 1a but with different orientation of restriction sites such that the BamHI site is now more peripheral. d, BamHI accessibility assay as in Fig. 1f but for the array shown in c. e, Left: quantification of gel in d and exponential fits of time courses. Right: rate coefficients from single exponential fits. Bars in b and e are mean values of two independent experiments (dots).
Extended Data Fig. 2
Extended Data Fig. 2. ISWI-GFP partitions into condensates.
a, GST-labeled GFP does not partition into chromatin condensates. The colocalization experiment was performed with 40 nM of unlabeled 25mer, 10 nM of 25mer-Cy3 and 1.125 μM of GFP-GST. N = 2, with similar results. b, ISWI-GFP concentrations were determined inside condensates and, after centrifugation, in the surrounding solution (bottom) from fluorescence intensities using calibration curves with ISWI-GFP dilutions (top). Two different microscope settings were used to image lower and higher dilutions. Means and SD of two independent replicates are shown. c, Nucleosome sliding time courses as in Fig. 2d. Conditions were identical except that reactions were started by addition of Mg-ATP, not by enzyme. N = 1.
Extended Data Fig. 3
Extended Data Fig. 3. FLIM-FRET controls.
a, Enrichment of labeled 0N60 mononucleosomes in chromatin condensates. N = 3 biological replicates; bars are averages. The mononucleosome concentration in solution was determined from z-plane above the condensates. b, Whole condensate FRAP of FRET-0N60 nucleosomes to assess their exchange between condensate and solution. Line is an average and shadow SD of eight bleached condensates. One of two independent replicates with similar results is shown. c, Phasor representation of data in Fig. 3b. Upon introduction of the acceptor, the donor’s lifetime distribution moves away from the universal circle line (single exponential lifetimes), consistent with at least two donor populations in different FRET states. The phasor representation makes no assumptions on the number of decay rates nor on specific decay model . d, Acceptor bleaching enhances donor fluorescence and lifetime, indicative of FRET. Imaging of FRET-0N60 nucleosomes in chromatin condensates. The acceptor fluorophore was bleached in the left half of the field of view, leading to an increase in donor fluorescence and donor lifetime (right most panel). N = 1. e, FLIM-FRET measurements as in Fig. 3d, but with 5 mM Mg-ATP. Bars are averages of three independent experiments (dots).
Extended Data Fig. 4
Extended Data Fig. 4. ISWI and nucleosome array mobility inside condensates.
a, Intra-condensate mobility of ISWI-GFP measured by partial-condensate FRAP. Half of a condensate was bleached in presence and absence of Mg-ATP (1 mM). Line is an average and shadow SD of 15 bleached condensates for each condition. N = 4 biological replicates. b, Independent replicate of Fig. 4b. Partial-condensate FRAP of ISWI-GFP in presence of indicated nucleotides (all 0.77 mM), at 50% of total chromatin and ISWI concentration as compared to Fig. 4b. c, ISWI-GFP is more mobile than chromatin in condensates. Dual FRAP of ISWI-GFP and Cy3-labeled condensates formed by 25mer arrays in presence of Mg-ATP (1 mM) and ISWI (100 nM). Four independent replicates show similar results.
Extended Data Fig. 5
Extended Data Fig. 5. ISWI and Mg2+ affect biophysical properties of condensates.
a, Optical tweezer force readout during condensate fusion. The fusion velocity was determined as the slope of the normalized force data at the inflection point. Incurred forces during fusion were on the order of 1 pN (see Methods). b, Fraction of successful fusion events in 1 mM MgCl2 (orange) and 5 mM MgCl2 (red). Nucleosome concentration: 1170 nM. c, ISWI increased viscosity of condensates as reported by enhanced fluorescence of the molecular rotor thioflavin T (ThT). In a high viscosity medium, rotation around the C-C bond (green arrow) is constrained, and the excitation energy is released as fluorescence. Bars: average ThT fluorescence intensities relative to outside medium; error: SD. Six condensates were analyzed for 0 nM and 293 nM ISWI, five for 1170 nM ISWI red circles). One of two independent replicates with similar results is shown. d, Fusion velocities of condensates measured by optical tweezers containing indicated ISWI concentrations. Data was obtained from the indicated number of independent condensates measured in one experiment. Statistical significance was determined by two-sided t-test (p-values: 293 nM: 0.02, 1170 nM: 9.8e-7). e, Fusion between condensates without ISWI measured by optical tweezers. Nucleotides (1 mM) and 2 mM instead of 1 mM free Mg2+ show only modest effects on fusion velocities compared to ISWI-AMPPNP. Data were obtained from the indicated number of independent condensates derived from two experiments conducted on different days. Statistical significance was determined by two-sided t-test (p-values: UTP: 3.5e-4, AD: 0.053, AMPPNP: 4.6e-4, 2 mM MgCl2: 1.4e-12, AMPPNP + ISWI: 2.3e-14). Box plots in d and e show medians and the 25th/75th percentiles, whiskers the 9th and 91st percentiles; asterisks indicate significance levels (n.s.: p > 0.05, *: p ≤ 0.05, **: p ≤ 0.01, ***: p ≤ 0.001, ****: p ≤ 1e-4).
Extended Data Fig. 6
Extended Data Fig. 6. Mechanistic details of the simulated monkey bar mechanism.
a, A model for the independent switching of the strengths of the two nucleosome interaction sites during ISWI´s ATPase cycle. Escape rates (black) and transition rates (red) in timestep-1 are indicated. b, Schematic representation of the implementation of the model in Fig. 6a for molecular dynamics simulations. c, Modified Lennard-Jones potential used in simulations. Below distances of 2R0 a regular Lennard-Jones potential is used. Between 2R0 and 3R0 the potential is described using a linear approximation, while interactions with range above 3R0 are set to 0. d, Conversion of the strength of the modified Lennard-Jones potential to escape rates based on the mean first passage time of potential escape .
Figure 1
Figure 1. Intramolecular chromatin fiber folding does not impede remodeling.
a, A 25mer nucleosome array assembled on 25 repeats of 197 bp long Widom-601 DNA derivatives. 13 repeats contain unique restriction enzymes sites. b, Sedimentation velocity analysis of 25mer arrays in a buffer supplemented with 0.2 mM (black; peak at 42.4 S) or 1.7 mM MgCl2 (red; peak at 51.3 S). The larger S value at the higher Mg2+-concentration indicated stronger compaction of arrays without substantial oligomer formation (arrows). c, Representative micrographs of 25mer arrays from negative stain electron microscopy dissolved in a buffer supplemented with indicated MgCl2 concentrations. d, e, Single-particle analysis of negative stain EM micrographs. N = 67 (0.2 mM MgCl2); N = 107 (1.7 mM MgCl2). Outlines of single particles (red line) were determined with a trainable Weka segmentation in ImageJ. Feret´s diameter (the maximum distance between two parallel tangential lines, yellow line) and circularity were calculated for all outlines. f, Top: Schematic of the BamHI accessibility assay. Bottom: Gel analysis of remodeling time courses. Reactions contained 4 nM arrays and 5 μM Mg-ATP and were started by addition of 200 nM ISWI. g, Left: quantification of gel in f and exponential fits of the time courses. Right: rate coefficients from single exponential fits. Bars are mean values of two independent experiments (dots).
Figure 2
Figure 2. ISWI partitions into condensates and slides nucleosomes under condensate-forming conditions.
a, Condensate formation depends on nucleosome and MgCl2 concentrations. Left: Condensate formation for different MgCl2 and 25mer array concentrations. Right: Percentage of the field of view occupied by condensates. The experiment was independently repeated twice with similar results. b, Partition coefficient of FITC-labeled dextrans of indicated molecular weights. Bars are averages from six condensates for each dextran, errors are SD. c, Colocalization experiments with GFP-ISWI (1.1 μM) and Cy3-labeled condensates (0.05 μM 25mers). Condensates were induced by addition of Mg2+ (5 mM) either before or after addition of GFP-ISWI. The experiment was independently repeated twice with similar results. d, Nucleosome sliding time courses (top and bottom left) in absence and presence of condensates (bottom right). Sliding was measured by KpnI accessibility of 25mer arrays (15 nM) with 1 mM Mg-ATP. Reactions were started by addition of 750 nM ISWI. Bars are mean values of two independent experiments (dots).
Figure 3
Figure 3. Nucleosome sliding in condensates visualized by FLIM-FRET.
a, Principle of the FLIM-FRET sliding assay. FRET nucleosomes with a donor dye (atto565) coupled to H2A K119C and an acceptor dye (atto647) attached to the octamer-proximal end of 207 bp Widom-601 DNA were spiked to array condensates. Upon nucleosome sliding, the FRET efficiency decreases, prolonging the donor fluorescence lifetime. b, The donor lifetime of FRET-nucleosomes in condensates increased after addition of ISWI and Mg-ATP but not in negative controls (donor-only nucleosomes, or without Mg-ATP). One out of two independent replicates with similar results is shown. Averages and SD of lifetimes across ten fields of view of the same sample, with each field of view imaged 30 times, totaling 300 images per condition. Reactions contained 45 nM 25mers, 125 nM FRET nucleosomes, 625 nM ISWI and were imaged four hours after addition of Mg-ATP. c, FLIM time lapse microscopy. Mg-ATP or Mg-AMPPNP (both 1 mM) were flown into the imaging chamber at t = 0. Individual condensates are pictured. One of two independent replicates with similar results is displayed. d, Left: FLIM-FRET time courses in condensates and solution from N=3 and N=2 independent experiments, respectively. Condensate reactions contained 45 nM 25mers, 125 nM FRET nucleosomes, and 625 nM ISWI and were started with 1 mM Mg-ATP. Solution reactions contained 1125 nM unlabeled 0N60 nucleosomes instead of arrays under otherwise identical conditions. Right: Initial velocities of time courses obtained from linear fits of the time courses on the left. Bars are mean values of independent experiments (dots).
Figure 4
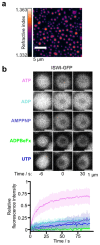
Figure 4. ATP hydrolysis powers mobility of ISWI in condensates.
a, Holotomogram of chromatin condensates. The average nucleosome concentration (225 ± 59 μM) was determined from the refractive index. One of two independent replicates is depicted. b, Top: Partial-condensate FRAP of ISWI-GFP in presence of indicated nucleotides (all 0.77 mM). Only addition of ATP allowed a fast recovery. Bottom: Quantification of FRAP time courses. Lines are averages, shaded areas SD of 20 condensates for AMPPNP and UTP, 15 for ADP, 25 for ADP-BeFx and 30 for ATP.
Figure 5
Figure 5. ATP hydrolysis prevents ISWI-mediated hardening of condensates.
a, Schematic of condensate fusion experiments with optical tweezers. b, Fusion velocities of condensates measured by optical trapping. ISWI in presence of non-hydrolysable nucleotides but not of ATP slowed down fusion. p-values of pairwise two-sided t-tests with the chromatin only condition: nucleotide-free: 3e-4, ATP: 0.12, ADP: 1.3e-14, AMPPNP: 1.3e-14, ADP-BeFx: 1.3e-14. c, AMPPNP did not slow down fusion when ISWI lacked its HSS domain. p-values of pairwise two-sided t-tests with the chromatin only condition: ISWI-ATP: 0.21, ISWIΔHSS-AMPPNP: 0.5, ISWI-AMPPNP: 4.5e-7. d, Addition of ATP to an ATPase-dead mutant (E257Q) but not to wild-type ISWI slowed down condensate fusion. p-values of pairwise two-sided t-tests with the chromatin only condition: ISWI: 0.70, ISWI + 0.3 mM ATP: 0.14, ISWI + 1 mM ATP: 0.34, ISWI + 3 mM ATP: 0.46, ISWIE257Q: 0.003, ISWIE257Q + 0.3 mM ATP: 1.4e-6, ISWIE257Q + 1 mM ATP: 1.9e-4, ISWIE257Q + 3 mM ATP: 8.4e-9. Data are changes in velocities relative to the mean of the chromatin only condition. Box plots in b–d show medians and the 25th/75th percentiles, whiskers the 9th and 91st percentiles. Asterisks indicate significance levels (n.s.: p > 0.05, *: p ≤ 0.05, **: p ≤ 0.01, ***: p ≤ 0.001, ****: p ≤ 1e-4). Data are from the indicated number of independent condensates (n). Chromatin-only and nucleotide-free ISWI datapoints in b came from three, all others from two experiments conducted on different days.
Figure 6
Figure 6. A simple model qualitatively explains experimental observations.
a, ISWI possesses two nucleosome-interacting domains, which can bridge neighboring nucleosomes in dense chromatin. Via large nucleotide-induced conformational changes (not depicted), the domains cycle through high and low affinity states towards nucleosomes, allowing ISWI to actively translocate through chromatin. b, Representation of a molecular dynamics simulation of ISWI FRAP in a chromatin condensate. ISWI particles on one side of an equilibrated condensate are switched to a bleached state at t=0 (square). Particle dynamics are then simulated to observe mixing of the two ISWI populations. c, ISWI FRAP was simulated as in b for 2.25*107 timesteps in different nucleotide conditions with three independent simulations per condition. Left: Averaged traces of ISWI FRAP in different nucleotide conditions with SD derived from three replicates. Right: Rate constants of the simulated FRAP traces. d, Representation of simulated fusion experiments. Two equilibrated condensates were brought into proximity and allowed to fuse. For visual clarity only nucleosomes are shown here. e, Simulations of three independent fusion events for each nucleotide condition. Left: Averaged fusion traces with SD. Right: Relative fusion velocities of the simulated traces. Boxplots in c and e show medians and the 25th/75th percentiles, whiskers the standard deviation.

Update of

References

    1. Burak Y, Ariel G, Andelman D. Onset of DNA aggregation in presence of monovalent and multivalent counterions. Biophys J. 2003;85:2100–2110. doi: 10.1016/s0006-3495(03)74638-4. - DOI - PMC - PubMed
    1. Post CB, Zimm BH. Theory of DNA condensation: Collapse versus aggregation. Biopolymers. 1982;21:2123–2137. - PubMed
    1. Woodcock CLF. Ultrastructure of inactive chromatin. Journal of Cell Biology. 1973;59:A368
    1. Olins AL, Olins DE. Spheroid chromatin units (v bodies) Science (1979) 1974;183:330–332. - PubMed
    1. Finch JT, Klug A. Solenoidal model for superstructure in chromatin. Proc Natl Acad Sci U S A. 1976;73:1897. doi: 10.1073/pnas.73.6.1897. - DOI - PMC - PubMed

MeSH terms

LinkOut - more resources