. 2024 May;4(5):625-637.
doi: 10.1038/s43587-024-00626-y. Epub 2024 Apr 25.

Spatiotemporal patterns of locus coeruleus integrity predict cortical tau and cognition

Affiliations

Spatiotemporal patterns of locus coeruleus integrity predict cortical tau and cognition

Elisenda Bueichekú et al. Nat Aging. 2024 May.

Abstract

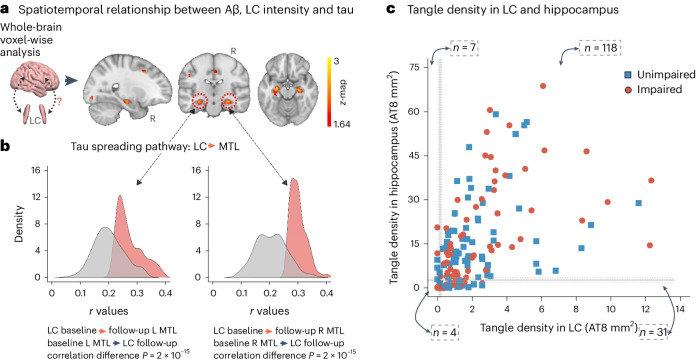
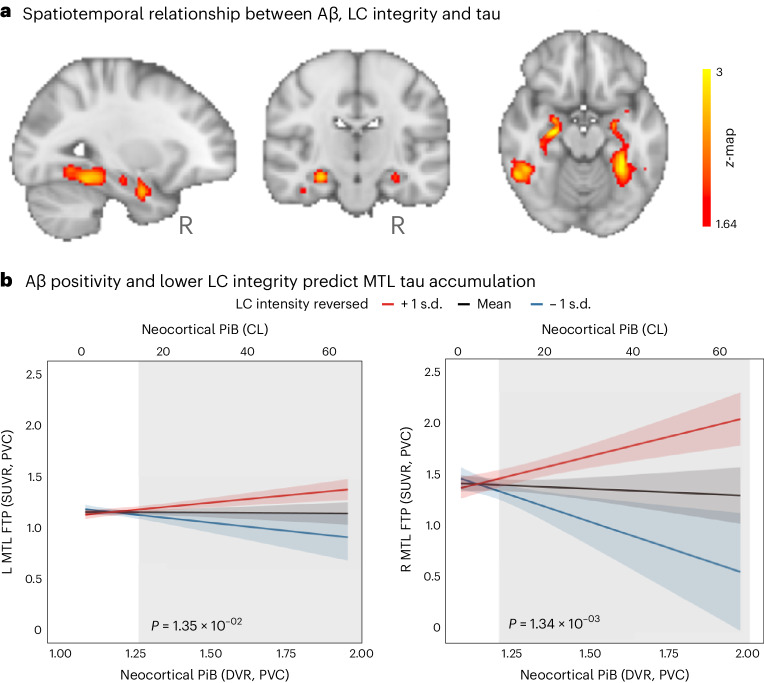
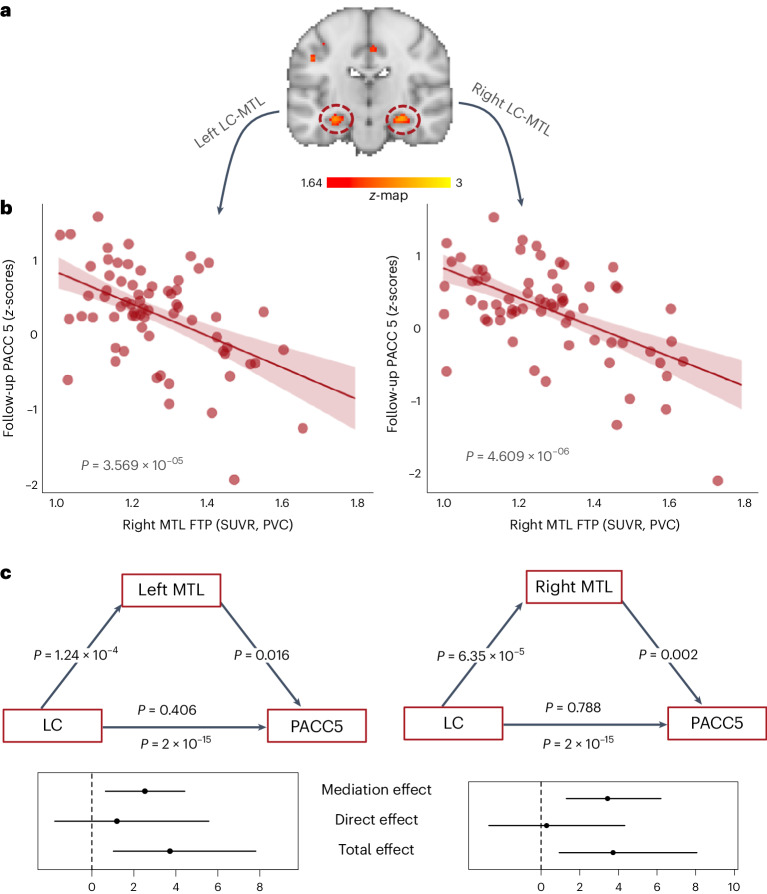
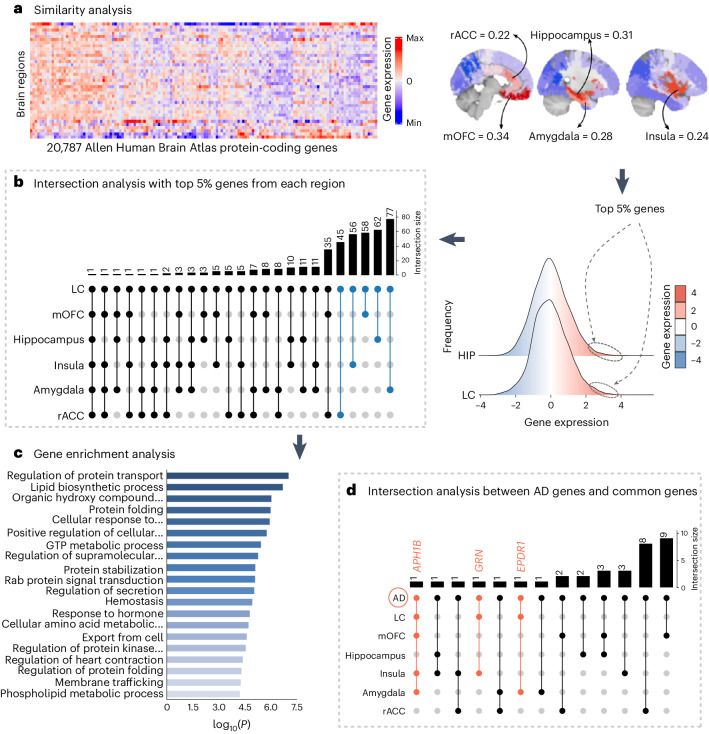
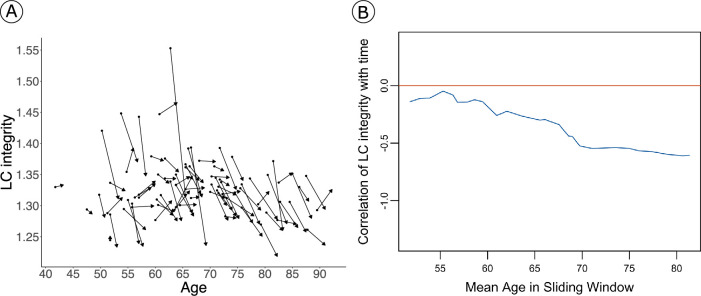
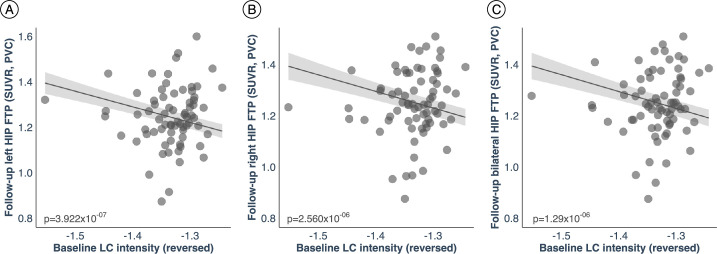
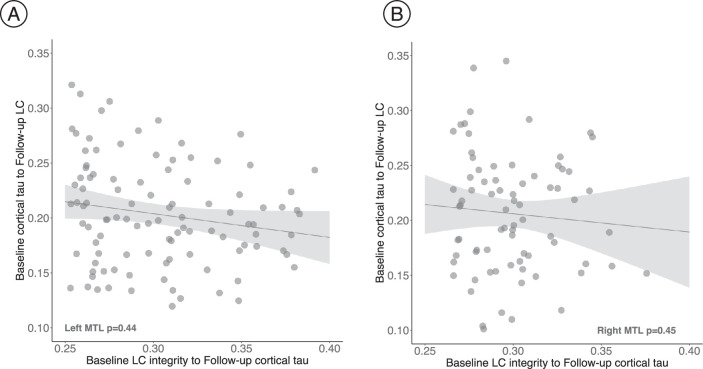
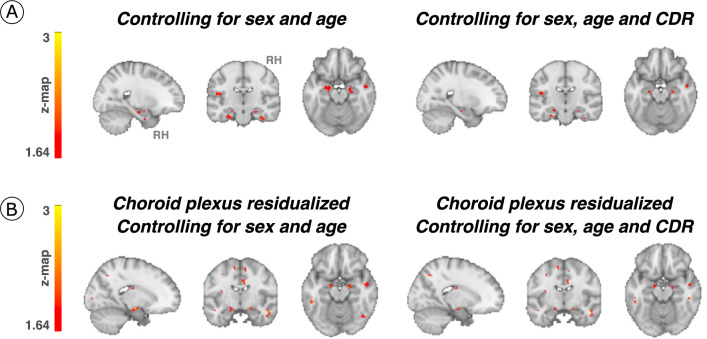
Autopsy studies indicated that the locus coeruleus (LC) accumulates hyperphosphorylated tau before allocortical regions in Alzheimer's disease. By combining in vivo longitudinal magnetic resonance imaging measures of LC integrity, tau positron emission tomography imaging and cognition with autopsy data and transcriptomic information, we examined whether LC changes precede allocortical tau deposition and whether specific genetic features underlie LC's selective vulnerability to tau. We found that LC integrity changes preceded medial temporal lobe tau accumulation, and together these processes were associated with lower cognitive performance. Common gene expression profiles between LC-medial temporal lobe-limbic regions map to biological functions in protein transport regulation. These findings advance our understanding of the spatiotemporal patterns of initial tau spreading from the LC and LC's selective vulnerability to Alzheimer's disease pathology. LC integrity measures can be a promising indicator for identifying the time window when individuals are at risk of disease progression and underscore the importance of interventions mitigating initial tau spread.


Conflict of interest statement

The authors declare no competing interests.

Figures

Fig. 1
Fig. 1. LC integrity predicts tau spreading in subsequent years.
a, A schematic representation of the neuroimaging analysis between LC integrity (inverted signal) and tau PET images (brain mesh rendered using SurfIce; https://www.nitrc.org/projects/surfice/) (left). Baseline LC integrity (inverted signal) was associated with longitudinal bilateral hippocampus and left amygdala tau (P < 0.05 cluster-corrected for multiple comparisons) using whole-brain voxel-wise level GLM analysis (n = 77 independent individuals) (right). The brain projection shows one-tailed results (z-score > 1.64; the color bar shows the z-statistics; cooler colors represent a stronger association). The results are displayed on sagittal, coronal and axial brain views using FSLeyes (FSL, FMRIB). b, Each distribution represents the longitudinal relationship between LC integrity (inverted signal) and the tau signal from the voxels within the left or the right MTL clusters surviving the multiple comparisons correction from the previous analysis. These distributions were compared using pairwise t-statistics (left cluster, n = 186 voxels; right cluster, n = 77 voxels). Distributions in red correspond to the tau pathway from baseline LC integrity to follow-up MTL tau; distributions in gray correspond to the pathway from baseline MTL tau to follow-up LC integrity. c, Using ex vivo data (n = 160 independent individuals), the proportion of low versus high tangle density in LC was tested against the proportion of having low versus high hippocampal tangles (for calculation of the threshold, see Methods; blue dots represent unimpaired participants and red dots represent impaired (MCI and AD) participants). L, left; R, right. Source data
Fig. 2
Fig. 2. Aβ facilitates LC-related tau spreading beyond MTL regions.
a, Baseline LC integrity (inverted signal) and Aβ deposition (PiB binding) were synergistically associated with longitudinal bilateral MTL, medial inferior occipito-temporal and posterior occipital tau accumulation (FTP binding) (P < 0.05 cluster-corrected for multiple comparisons) using whole-brain voxel-wise level GLM analysis (n = 77 independent individuals). The brain projection shows one-tailed results (z-score > 1.64; the color bar shows the z-statistics; cooler colors represent a stronger association). The results are displayed on sagittal, coronal and axial brain views using FSLeyes (FSL, FMRIB). b, Lower LC integrity was related to higher Aβ-related tau accumulation in the MTL approximately 3 years later using robust linear regression analysis (n = 75 independent individuals; two-tailed analysis). Then, we used Johnson–Neyman analysis to define the range of PiB values at which the LC–tau association is significant: PiB DVR PVC = 1.26 or 13.94 CL for the left cluster; PiB DVR PVC = 1.20 or 9.67 CL for the right cluster (ranges are indicated by the gray rectangular shadow). Black fit lines represent mean LC integrity, red fit lines indicate +1 × s.d., blue fit lines indicate −1 × s.d. and shaded areas around the fit lines show 95% CI. Source data
Fig. 3
Fig. 3. Cognitive outcomes are predicted by the biological link between LC and MTL tau burden.
a, The individuals’ LC-related follow-up MTL tau values were used as predictors of cognitive performance (averaged voxel FTP values (SUVR and PVC) extracted from the clusters surviving multiple comparison correction after conducting whole-brain voxel-wise level GLM analysis (n = 77 independent individuals). The brain projection shows one-tailed results of the whole-brain (z-score > 1.64; P < 0.05, cluster-corrected for multiple comparisons; the color bar shows the z-statistics, where cooler colors represent a stronger association). The results are displayed on a coronal brain view using FSLeyes (FSL, FMRIB). b, Higher LC-related MTL tau accumulation was associated with lower cognitive performance as measured by the PACC5 approximately 3 years later (n = 74 independent individuals). The plots reflect the relationship between tau accumulation and PACC5 z-scores adjusted by age, sex, years of education and CDR (robust linear regression and two-tailed analysis). Dots represent the individual predicted values of the relationship tested and the shaded areas around the fit lines show 95% CI. c, Follow-up MTL tau (FTP, SUVR and PVC) mediated the relationship between baseline LC intensityr and follow-up PACC5 performance (z-scores) 3 years later (two-tailed mediation analysis). The graphical representation of the mediated relationship displays the p-values of the estimates, while the forest plots depict the β-coefficients along with the 95% CI (n = 74 independent individuals). Source data
Fig. 4
Fig. 4. Neurogenetic approach exploring common genetic background across the brain.
a, A whole-brain region-wise phenotypic-transcriptomic similarity analysis using the AHBA was conducted correlating LC to 68 regions from the Desikan–Killiany neocortical parcellation, the hippocampus and the amygdala. The sagittal brain slices (FSLeyes; FSL, FMRIB) show LC’s gene expression profile similarity to that of the hippocampus, amygdala, insula, mOFC and rACC (warmer colors indicate higher similarity). The genes with the highest genetic expression (top 5%) within these six regions were selected for subsequent analysis (the distribution corresponding to the genetic expression of protein-coding genes colocated at the LC and the hippocampus are shown). b, An intersection analysis was used to define common protein-coding genes between LC and each of the other regions, aggregating genes involving LC plus one region (n = 298 protein-coding genes). c, GO enrichment analysis revealed that among the biological functions related to these genes, which are highly expressed in early AD-affected regions, regulation of protein transport was found to be the main term (thresholds for terms, P < 0.01, count > 3 and enrichment factor > 1.5; P values, log10(P) are calculated based on the cumulative hypergeometric). d, An intersection analysis was used to find, within the common gene expression profiles (n = 298 protein-coding genes), genes related to AD (n = 75 genes). The APH1B, GRN and EPDR1 genes were found within the AD-related genes and our neurogenetic approach results. GTP, guanosine triphosphate; HIPP, hippocampus.
Extended Data Fig. 1
Extended Data Fig. 1. Change in LC integrity signal as a function of age.
a) Decreases in LC integrity are observed across all ages. Every pair of dots represents one individual (n = 77), and arrows represent the direction of the change. b) The sliding window correlation plot also demonstrates that LC integrity decreases over time across all ages (blue line=correlation between LC integrity and time across age (binned by 15 years)).
Extended Data Fig. 2
Extended Data Fig. 2. The hypothesized pathological spreading pathway from LC to MTL is supported when adopting a ROI-based approach.
a) Left hippocampus ROI (n = 77 independent individuals); b) Right hippocampus ROI (n = 77 independent individuals); c) Bilateral hippocampus (averaged left and right hippocampus ROIs) (n = 77 independent individuals). The scatter plots reflect the association between baseline LC intensityr and tau accumulation in hippocampus at follow-up (robust linear regression, p < 0.05 two-tailed analysis, uncorrected for multiple comparisons). Plots are adjusted for age, sex, CDR and neocortical PiB burden. In all plots, dots represent the individual predicted values of the relationships tested and the shaded areas around the fit lines show 95% CI. Abbreviations: FTP = 18-flortaucipir PET; HIP=hippocampus; p = p value; PVC=partial volume corrected; SUVR=standardized uptake value ratio. Source data
Extended Data Fig. 3
Extended Data Fig. 3. No association was found between our hypothesized tau spreading pathway from LC to MTL, and the reverse model from MTL to LC.
a) Left MTL (n = 186 voxels). b) Right MTL (n = 77 voxels). The scatter plots reflect the association values extracted from the voxels forming the cluster that survived the correction for multiple comparisons when we tested our model (baseline LC integrity to follow-up cortical tau (FTP, SUVR, PVC); robust linear regression, p < 0.05 two-tailed analysis, uncorrected for multiple comparisons). The voxels were kept constant for the reversed model. In all plots, dots represent the estimates (beta-coefficients) of the relationships tested and the shaded areas around the fit lines show 95% CI. Abbreviations: p = p value; LC=locus coeruleus; MTL=medial temporal lobe. Source data
Extended Data Fig. 4
Extended Data Fig. 4. Associations between LC integrity and cortical tau accumulation after controlling for the effect of covariates of no interest.
(a) Baseline LC integrity (inverted signal) was used as a predictor of longitudinal tau accumulation at the whole-brain voxel-wise GLM level controlling for sex and age or sex, age, CDR (n = 77 independent individuals). The associations between LC integrity and medial temporal lobe regions (for example, hippocampus) were smaller in cluster size but remained significant. (b) The choroid plexus FTP-signal was residualized from tau-PET images and added to our associations between LC integrity and cortical tau; then, the additional covariates (sex, age, CDR) were added (whole-brain voxel-wise level GLM analysis) (n = 77 independent individuals). Although the cluster extension was reduced, the associations remained significant. Results are p value < 0.05 cluster-corrected. The brain projection shows one-tailed results (z-score > 1.64; the color bar shows the z-statistics; cooler colors represent a stronger association). In (A) and (B), The results are displayed on sagittal, coronal and axial brain views using FSLeyes (FSL, FMRIB, Oxford, UK). Abbreviations: CDR=Clinical Dementia Rating; RH=Right hemisphere.
Extended Data Fig. 5
Extended Data Fig. 5. Associations between LC integrity and cortical tau accumulation moderated by neocortical PiB burden after controlling for the effect of covariates of no interest.
(a) The interaction between baseline LC integrity (inverted signal) and neocortical PiB burden (Aβ) as predictor of longitudinal tau accumulation at the whole-brain voxel-wise level GLM analysis controlling for sex and age or sex, age, and CDR (n = 75 independent individuals). The associations between LC integrity and medial temporal lobe regions (for example, hippocampus) and posterior occipital regions were similar when controlling for age and sex and were smaller in cluster size when controlling for CDR but remained significant. (b) The choroid plexus FTP-signal was residualized from tau-PET images and added to our associations between Aβ and LC integrity predicting cortical tau; then, the additional covariates (age, sex, and CDR) were added (whole-brain voxel-wise level GLM analysis) (n = 75 independent individuals). Although the cluster extension was reduced, the associations remained significant. Results are p value < 0.05 cluster-corrected). The brain projection shows one-tailed results (z-score > 1.64; the color bar shows the z-statistics; cooler colors represent a stronger association). In (A) and (B), the results are displayed on sagittal, coronal and axial brain views using FSLeyes (FSL, FMRIB, Oxford, UK). Abbreviations: CDR=Clinical Dementia Rating; RH=Right hemisphere.
Extended Data Fig. 6
Extended Data Fig. 6. LC tangle density is related to tangles in MTL areas.
In unimpaired participants (EC, N = 65; Hippocampus, N = 66; IT, N = 66; LC, N = 66 independent individuals represented by dots), LC tangle density is related to tangles in MTL structures, such as the hippocampus (upper plot) and the entorhinal cortex (middle plot), and the inferior temporal cortex (lower plot). These associations are consistent with the pattern observed in impaired (EC, N = 93; Hippocampus, N = 94; IT, N = 94; LC, N = 94 independent individuals with mild cognitive impairment or AD; represented by triangles) participants. Lines in the scatter plots represent linear trends. LC tangle density histogram appears on the upper part of the plots, while hippocampus, entorhinal cortex, or inferior temporal cortex tangle density histograms appear on the right-side of the respective plots.
Extended Data Fig. 7
Extended Data Fig. 7. Tangle density in LC is associated with early affected tau cortical regions.
(a) Tangle density distribution in the MAP dataset. In both unimpaired and impaired (MCI/AD) individuals, tangle density is higher in the MTL (EC and hippocampus) compared to other regions (the boxplots covers the interquartile range (IQR): the centerline of the boxplot corresponds to the median (Q2), the lower and upper bound of the boxplots correspond to the 25th percentile (Q1) and the 75th percentile (Q3) respectively, the error bar minimum value is the minimum value in the data (Q1–1.5*IQR) and the maximum value is the maximum value in the data (Q3 + 1.5*IQR). (b) Tangle density in LC is strongly related to tangle density in MTL (that is, hippocampus and entorhinal cortex), and in IT (restricted robust linear regression with age, sex and postmortem interval as covariates, two-tailed analysis, all p < 0.05; regression lines represent slope between the relationships tested and the shaded areas around the fit lines show 95% CI). Sample size for (A) and (B) (unimpaired | impaired): AG = 65|94 individuals; CALC = 66|94 individuals; CG = 66|94 individuals; EC = 65|93 individuals; HIP = 66|94 individuals; IT = 66|94 individuals; MF = 66|94 individuals; SF = 66|94 individuals; LC = 66|94 individuals. Abbreviations: AG=angular gyrus; CALC= calcarine; CG=cingulate cortex; EC=entorhinal cortex; HIP=hippocampus; IT=inferior temporal cortex; LC=locus coeruleus; MF=midfrontal gyrus; SF=superior frontal gyrus.
Extended Data Fig. 8
Extended Data Fig. 8. Cognitive outcomes are predicted by the biological link between LC and MTL tau burden.
A higher correlation between LC-related - MTL tau accumulation was associated with lower cognitive performance as measured by the PACC 5 (z-scores) approximately three years later (n = 77 independent individuals). The plot reflects the relationship between the averaged left and right MTL tau deposition and PACC5 z-scores adjusted by age, sex, years of education and CDR (robust linear regression, two-tailed analysis). Dots represent the estimates (beta-coefficients) of the relationships tested and the shaded areas around the fit lines show 95% CI Abbreviations: FTP = 18-flortaucipir PET; LC=locus coeruleus; MTL=medial temporal lobe; PACC5=Preclinical Alzheimer’s disease Cognitive Composite 5; p = p value; PVC=partial volume corrected; SUVR=standardized uptake value ratio. Source data
Extended Data Fig. 9
Extended Data Fig. 9. Cognitive outcomes are not associated with the reverse hypothesized pathway ‘follow-up LC-related – baseline MTL tau deposition’.
(A) Left MTL (n = 74 independent individuals). (B) Right MTL (n = 74 independent individuals). The possible association between tau deposition in the MTL at baseline with LC integrity (inverted signal) years later does not predict lower cognitive performance on the PACC5 (z-scores). The plots are adjusted by age, sex, years of education and CDR (robust linear regression, two-tailed analysis). In all plots, dots represent the estimates (beta-coefficients) of the relationships tested and the shaded areas around the fit lines show 95% CI. Abbreviations: FTP = 18-flortaucipir PET; MTL=medial temporal lobe; p = p value; PACC5=Preclinical Alzheimer’s Cognitive Composite 5; PVC=partial volume correction; SUVR=standardized uptake value ratio. Source data
Extended Data Fig. 10
Extended Data Fig. 10. The relationship between the genetic profile of the locus coeruleus and the top 5 most correlated brain regions remained robust after permutation analysis.
The vertical solid red line represents the r-value corresponding to 1.96 standard deviation. Abbreviations: LC=locus coeruleus; mOFC=medial orbitofrontal cortex; r = r-value; rACC=rostral anterior cingulate cortex; SD=standard deviation.

References

    1. Sperling RA, et al. Toward defining the preclinical stages of Alzheimer’s disease: Recommendations from the National Institute on Aging‐Alzheimer’s Association workgroups on diagnostic guidelines for Alzheimer’s disease. Alzheimers Dement. 2011;7:280–292. doi: 10.1016/j.jalz.2011.03.003. - DOI - PMC - PubMed
    1. Ehrenberg, A. J. et al. Priorities for research on neuromodulatory subcortical systems in Alzheimer’s disease: position paper from the NSS PIA of ISTAART. Alzheimers Dement. 10.1002/alz.12937 (2023). - PMC - PubMed
    1. Braak H, Thal DR, Ghebremedhin E, Del Tredici K. Stages of the pathologic process in Alzheimer disease: age categories from 1 to 100 years. J. Neuropathol. Exp. Neurol. 2011;70:960–969. doi: 10.1097/NEN.0b013e318232a379. - DOI - PubMed
    1. Braak H, Braak E. Evolution of the neuropathology of Alzheimer’s disease. Acta Neurol. Scand. Suppl. 1996;165:3–12. doi: 10.1111/j.1600-0404.1996.tb05866.x. - DOI - PubMed
    1. Braak H, Del Tredici K. The pathological process underlying Alzheimer’s disease in individuals under thirty. Acta Neuropathol. 2011;121:171–181. doi: 10.1007/s00401-010-0789-4. - DOI - PubMed

MeSH terms

Grants and funding