. 2024 Apr;6(4):741-763.
doi: 10.1038/s42255-024-01019-6. Epub 2024 Apr 25.

Fatty acid binding protein 5 suppression attenuates obesity-induced hepatocellular carcinoma by promoting ferroptosis and intratumoral immune rewiring

Affiliations

Fatty acid binding protein 5 suppression attenuates obesity-induced hepatocellular carcinoma by promoting ferroptosis and intratumoral immune rewiring

Jonathan Sun et al. Nat Metab. 2024 Apr.

Abstract

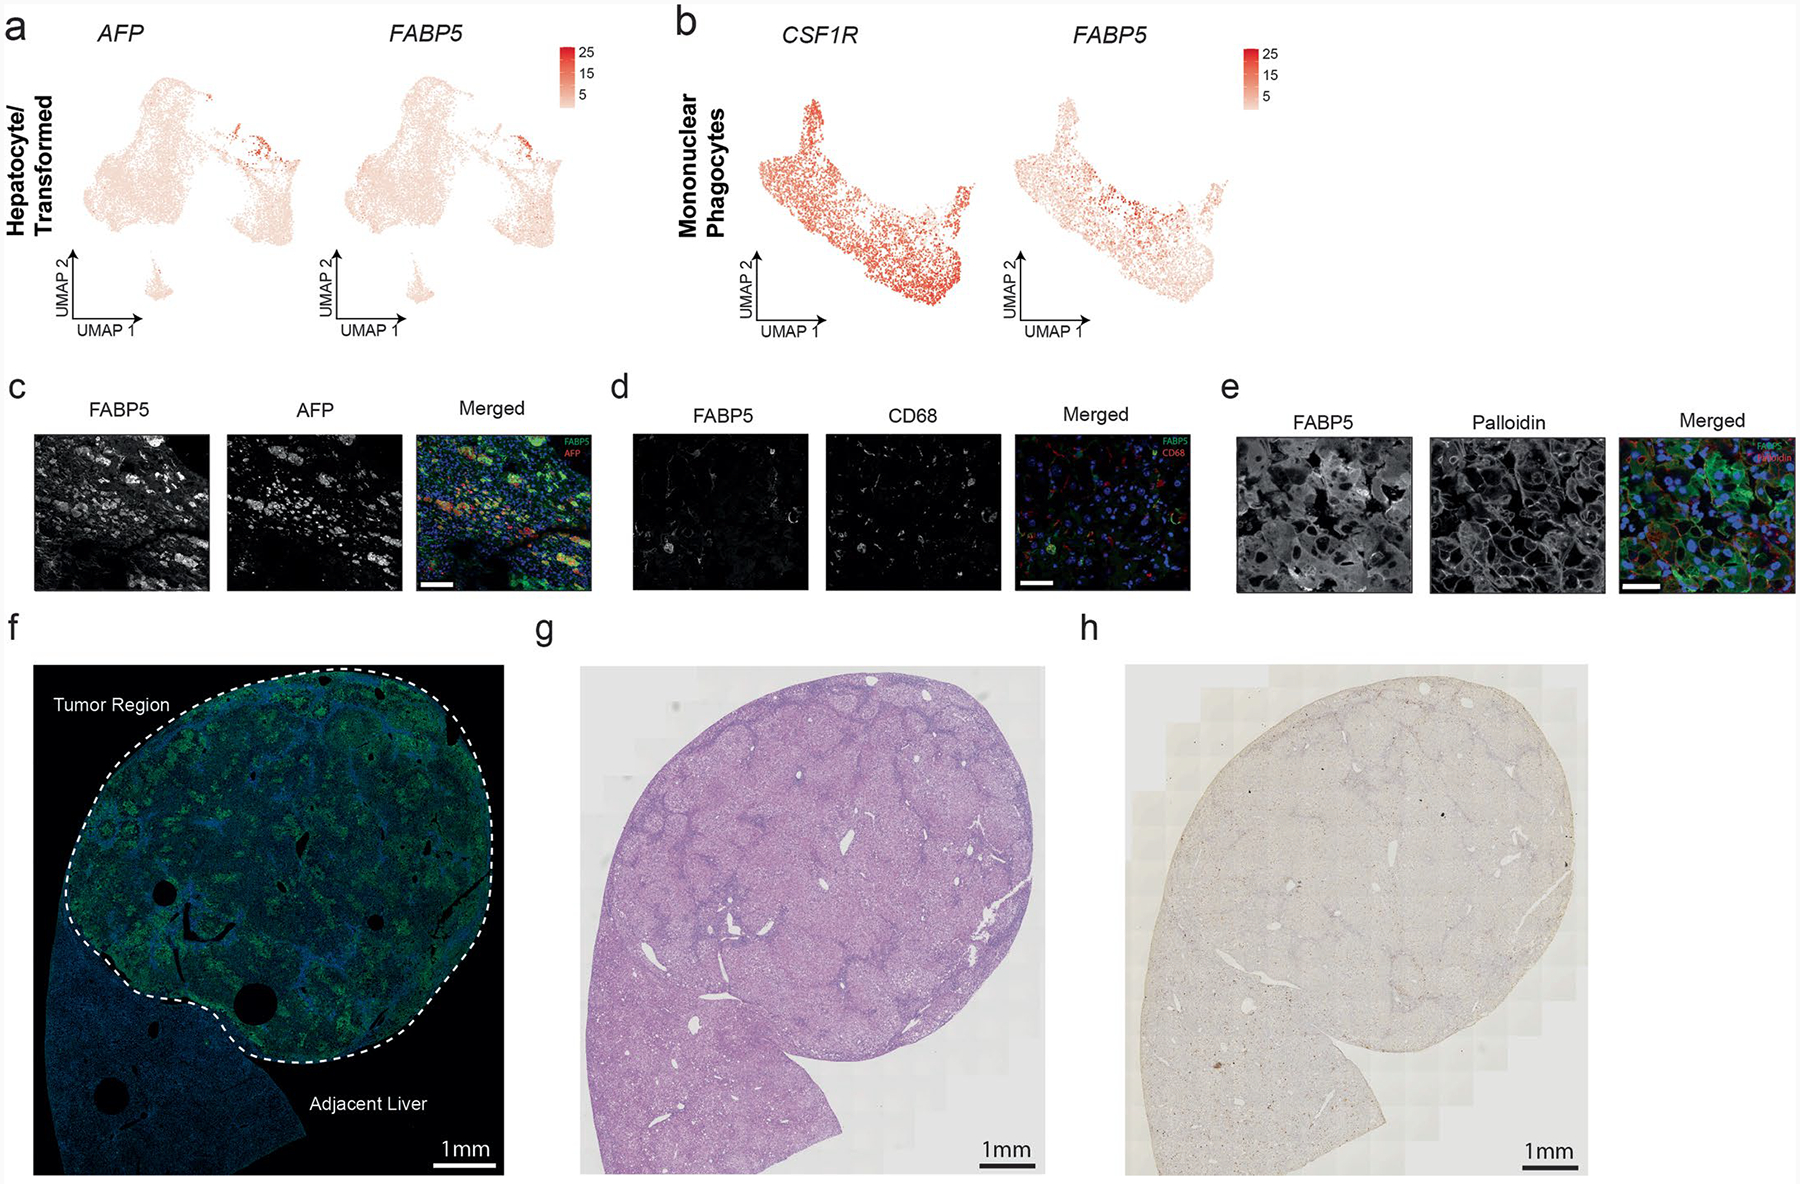
Due to the rise in overnutrition, the incidence of obesity-induced hepatocellular carcinoma (HCC) will continue to escalate; however, our understanding of the obesity to HCC developmental axis is limited. We constructed a single-cell atlas to interrogate the dynamic transcriptomic changes during hepatocarcinogenesis in mice. Here we identify fatty acid binding protein 5 (FABP5) as a driver of obesity-induced HCC. Analysis of transformed cells reveals that FABP5 inhibition and silencing predispose cancer cells to lipid peroxidation and ferroptosis-induced cell death. Pharmacological inhibition and genetic ablation of FABP5 ameliorates the HCC burden in male mice, corresponding to enhanced ferroptosis in the tumour. Moreover, FABP5 inhibition induces a pro-inflammatory tumour microenvironment characterized by tumour-associated macrophages with increased expression of the co-stimulatory molecules CD80 and CD86 and increased CD8+ T cell activation. Our work unravels the dual functional role of FABP5 in diet-induced HCC, inducing the transformation of hepatocytes and an immunosuppressive phenotype of tumour-associated macrophages and illustrates FABP5 inhibition as a potential therapeutic approach.


Conflict of interest statement

I.O. and M.K. declare financial support from Artelo Biosciences. I.O. and M.K. have patents issued to the Research Foundation of the State University of New York. The other authors declare no competing interests.

Figures

Extended Data Fig. 1 |
Extended Data Fig. 1 |. Long-term CD-HFD feeding induces metabolic abnormalities, hepatic inflammation, fibrosis, and HCC.
(A) Developmental timeline of obesity-induced HCC in the CD-HFD model outlining key experiments to examine metabolic, transcriptomic, and pathogenic phenotypes. (B) Body weight in C57BL/6 mice fed with CD-HFD or control diet. N = 20 for ND-fed mice and N = 40 for CD-HFD-fed mice. (C) Body composition analysis by MRI of fat mass from 3-, 6-, and 12-months CD-HFD fed C57BL/6 mice. N = 6 for each ND-fed and CD-HFD-fed mice at 3 months, CD-HFD-fed mice at 6 months. N = 8 for ND-fed mice at 6 months, ND-fed and CD-HFD-fed mice at 12 months. (D) Representative H&E staining of 3- and 6-month CD-HFD fed mice demonstrating steatosis and inflammation. (E) Representative Oil Red O staining illustrates lipid accumulation in 3- and 6-month CD-HFD-fed mice. (F) Quantification of liver triglyceride content in 3- and 6-month CD-HFD fed mice. N = 6 for each experimental condition. (G) Quantification of liver cholesterol esters (CE) content in 3- and 6-month CD-HFD fed mice. N = 6 for each experimental condition. (H) Quantification of circulating total cholesterol in 3-, 6-, 12-, and 15-months CD-HFD fed mice. N = 8 for each experimental condition. (I) Cholesterol content of FPLC-fractionated lipoproteins from pooled plasma of 6 months of CD-HFD or control diet. Plasma samples were pooled from 4 mice for each condition. (J) Fasting glucose measured from 3-, 6-, 12-, and 15-months CD-HFD fed mice. N = 6 for experimental conditions at 3 months, N = 10 for experimental conditions at 6 months, N = 8 for experimental conditions at 12 and 15 months. (K) Glucose tolerance test performed with 6-month CD-HFD-fed mice with Area Under Curve (AUC) shown (top right). N = 8 for each experimental condition. (L) Insulin tolerance test (left) performed with 6-month CD-HFD-fed mice with Area Under Curve (AUC) shown (top right). N = 8 for each experimental condition. (M) Flow cytometry quantification of hepatic CD45+ population in C57BL/6 mice after 6 months of CD-HFD feeding. N = 4 for ND-fed mice and N = 5 for CD-HFD-fed mice. (N) Flow cytometry quantification of hepatic CD11blow F480high Kupffer Cells (KCs), CD11bhigh F480low Monocyte-derived Macrophages (MoMPs) and CD44+, CD62L+ activated CD8+ T cell after 6 months of CD-HFD feeding. N = 4 for ND-fed mice and N = 5 for CD-HFD-fed mice. (O) Picosirius red staining analysis (left) and quantification (right) in the liver after 6 months of CD-HFD feeding. N = 4 for each experimental condition. (P) Representative gross images of High and Low AFP liver from 15 months CD-HFD and ND-fed mice. Total of 16 ND livers, 18 CD-HFD Low AFP livers and 14 CD-HFD High AFP livers. (Q) Representative H&E image from steatotic and non-steatotic HCC sections of 15 months CD-HFD fed mice. Scale bars: 200 μm in (d-e); 20 μm at highest magnification in (q). Statistical Analysis: (b) one-way ANOVA followed by Dunnett’s post hoc test; (c, f-h, j-o) non-parametric two-sided t-tests. P-value of < 0.05 considered statistically significant. For (c, f-h, j-o) each dot represents an individual animal and bar height indicates mean and SEM. Data (c, f-q) representation of 2 or more independent experiments.
Extended Data Fig. 2 |
Extended Data Fig. 2 |. Single-Cell RNA sequencing identifies distinctive inflammatory signatures in Mononuclear Phagocytes and T cells.
(A) UMAP representation of 29 discrete clusters from 15 months CD-HFD and ND-fed mice. (B) UMAP representation of G1, G2M and S cell cycle phase cells from 15 months CD-HFD and ND-fed mice. (C) Feature plot visualization of representative cell marker genes across all sequenced cells. (D) Heatmap showing top 3 differentially expressed markers across all identified cell types. (E) Composition of immune cell subtypes in total PTPRC+ immune cells for experimental conditions after 15 months CD-HFD and ND feeding. (F) UMAP representation of 6 distinctive cell clusters corresponding to Monocyte-derived Macrophages (MoMP) or Kupffer Cells (KC) after subsetting on Mononuclear Phagocytes (MPs). (G) Composition of MoMP and KC sub-clusters for experimental conditions after 15 months of CD-HFD and ND feeding. (H) Expression of pro-inflammatory and anti-inflammatory gene signatures in MPs across experimental conditions after 15 months of CD-HFD and ND feeding. (I) Flow cytometry analysis of CD11b+ Ly6C+ inflammatory MPs across experimental conditions after 15 months of CD-HFD and ND feeding. N = 3 for ND, Low AFP and HCC conditions. N = 4 for High AFP condition. (J) UMAP representation of 6 distinctive cell clusters corresponding to CD8+ T cells (CD8), CD4+ T cells (CD4), Natural Killer cells (NK) or Natural Killer T cells (NKT) after on CD3E+ lymphocytes. (K) Violet plot analysis of NR4A2, TOX and PDCD1 expression across experimental conditions after 15 months CD-HFD and ND feeding. N = 4 for all experimental conditions. (L) Flow cytometry quantification of CD8+ T cells across experimental conditions after 15 months of CD-HFD and ND feeding. N = 4 for all experimental conditions. (M) Flow cytometry analysis of TOX and PD1 in CD8+ T cells across experimental conditions after 15 months of CD-HFD and ND feeding. N = 4 for all experimental conditions. Statistical Analysis: (i, l-m) non-parametric two-sided t-tests. P-value of < 0.05 considered statistically significant. For (i, l-m) each dot represents an individual animal and the bar height indicates the mean and SEM. Data (i, l-m) representation of 2 or more independent experiments.
Extended Data Fig. 3 |
Extended Data Fig. 3 |. Single-cell RNA sequencing analysis of hepatocyte gene signatures by slingshot pseudotime analysis and comparison analysis in DEN + CCL4 model.
(A) UMAP representation of 4 experimental conditions in hepatocytes after 15 months CD-HFD or ND-fed mice. (B)Heatmap showing 5 periportal and central vein gene marker expression across hepatocyte subtypes (left). Feature plot representation of select periportal and central vein gene markers in hepatocytes (right). (C) Expression of upregulated genes ENO1, FBP1, GAPDH as a function of pseudotime value. (D) Expression of downregulated genes mt-CO1, mt-CYTB, mt-NO3 as a function of pseudotime value. (E) UMAP representation of 4 distinctive experimental conditions after re-clustering by slingshot from 15 months CD-HFD or ND-fed mice. (F) UMAP representation of 5 distinctive clusters after re-clustering by slingshot from 15 months CD-HFD or ND-fed mice. Identified trajectory shown by connecting central nodules between each cluster. (G) Pseudotime value visualization by slingshot across hepatocytes and cancer cells from 15-month CD-HFD and ND-fed mice. (H) GO ontology analysis of upregulated differentially expressed genes identified as a function of slingshot pseudotime progression. (I) GO ontology analysis of downregulated differentially expressed genes identified as a function of slingshot pseudotime progression. (J) UMAP representation of combined analysis including 15 months CD-HFD or ND-fed mice and WT mice treated with DEN + CCL4 sequenced at 3 days, 10 days and 30 days post-tumour initiation. (K) Expression of AFP in hepatocytes and cancer cells in diet-induced and carcinogenic HCC models by Feature plot. (L) Expression of FABP5 in hepatocytes and cancer cells in diet-induced and carcinogenic HCC models by Feature plot. (M) Dotplot expression of FABP5 and AFP from single-cell analysis from diet-induced and carcinogenic HCC models. (N) Dotplot expression of mt-Cytb, mt-Nd4 and mt-Co1 from single-cell analysis from diet-induced and carcinogenic HCC models.
Extended Data Fig. 4 |
Extended Data Fig. 4 |. Single-cell RNA sequencing identifies FABP5 upregulation during HCC progression.
(a) Feature plot representation of AFP and FABP5 expression in hepatocytes and transformed cancer cells. (b) Feature plot representation of CSF1R and FABP5 expression in Mononuclear Phagocytes. (c) Immunofluorescence (IF) imaging of FABP5 and AFP staining in the CD-HFD model. (d) IF imaging of FABP5 and CD68 staining in the CD-HFD model. (e) IF imaging of FABP5 and Phalloidin staining in the CD-HFD model. (f) Whole tumour IF imaging of FABP5 (green) in HCC and adjacent healthy liver. (g) Whole tumour H&E staining in HCC and adjacent healthy liver. (h) Whole tumour CD68 immunohistochemistry staining in HCC and adjacent healthy liver. Scale bars: 100 μm in (c); 50 μm in (d); 37 μm in (e) and 1 mm in (f), (g) and (h). Data (c-e, f-h) representation of 2 or more independent experiments.
Extended Data Fig. 5 |
Extended Data Fig. 5 |. FABP5 inhibition and silencing leads to lipid peroxidation, ER stress and ferroptosis.
(A) RT-PCR analysis of FABP5 mRNA expression in Huh7 cell lines treated with SBFI-103 for 48 hours. N = 3 for both experimental conditions. (B) Principle Complement Analysis (PCA) of SBFI-103 treated Huh7 cells for RNA sequencing analysis. N = 3 for both experimental conditions. (C) Volcano plot of differentially expressed genes in SBFI-103 treated Huh7 cell lines. Select upregulated and downregulated genes are indicated. (D) Top up- and downregulated GSEA pathways from differentially expressed genes in SBFI-103 treated Huh7 cells. (E) RT-PCR analysis of FABP5 mRNA expression in Huh7 cell lines treated with FABP5 siRNA for 48 hours. N = 3 for both experimental conditions. (F) PCA of FABP5 siRNA-treated Huh7 cells for RNA sequencing analysis. N = 3 for both experimental conditions. (G) Volcano plot of differentially expressed genes in FABP5 siRNA-treated Huh7 cell lines. Select upregulated and downregulated genes are indicated. (H) Top up- and downregulated GSEA pathways from differentially expressed genes in FABP5 siRNA-treated Huh7 cells. (I) Flow cytometry analysis of BODIPY C16 MFI in 5uM SBFI-103 and FABP siRNA-treated Huh7 cells. N = 3 for each experimental condition. (J) Flow cytometry analysis of 2-NBDG MFI in 5uM SBFI-103 and FABP5 siRNA-treated Huh7 cells. N = 3 for each experimental condition. (K) MDA concentration in FABP5 siRNA-treated Huh7 cells as measured through colorimetric assay. N = 3 for both experimental conditions. (L) Flow cytometry analysis of BODIPY 581/591 C11 MFI in FABP5 siRNA-treated Huh7 cells. N = 3 for both experimental conditions. (M) Flow cytometry analysis of CellRox MFI in FABP5 siRNA-treated Huh7 cells. N = 3 for both experimental conditions. (N) Western blot of PERK, ATF4, IRE1A and BIP in 5uM FABP5 and control siRNA-treated Huh7 cells. N = 3 for both experimental conditions. Statistical Analysis: (a, e, i-m) non-parametric two-sided t-tests. P-value of < 0.05 considered statistically significant. For (a, e, i-m) each dot represents an individual animal and bar height indicates mean and SEM. Data (i-m) representation of 2 or more independent experiments.
Extended Data Fig. 6 |
Extended Data Fig. 6 |. FABP5 inhibition and silencing promotes mitochondrial respiration and oxidation.
(A) Violin plot of FABP5, FABP1, and FABP2 expression in SBFI-103 and vehicle-treated cancer cells. (B) Downregulated GSEA pathways from differentially expressed genes in SBFI-103 treated cancer cells. (C) EM quantification of mitochondrial size from vehicle-treated liver, vehicle-treated HCC, and SBFI-103-treated HCC. N = 3 for each experimental condition. (D) Vcs flux and Vpc/Vcs ratio analysed by PINTA and ex vivo NMR in the vehicle-treated liver, vehicle-treated HCC and SBFI-103-treated HCC. N = 3 for each experimental condition. (E) Western blot analysis of electron transport complexes in the vehicle-treated liver, vehicle-treated HCC and SBFI-103-treated HCC. N = 3 for each experimental condition. (F) Schematic outlining FABP5 inhibition and silencing treatment conditions on Huh7 cell lines before metabolic analysis. (G) ATP production in Huh7 cells treated with SBFI-103 for 5 μM 24 hours. N = 3 for each experimental condition. (H) ATP production in Huh7 cells treated with FABP5 siRNA for 24 hours. N = 3 for each experimental condition. (a) Oxygen consumption rate (OCR) was measured after 24 hours of treatment with FABP5 siRNA in Huh7 cells in and without the presence of 20 μm Etoximir (Eto) by Seahorse extracellular flux analyser. Basal and spare respiratory capacity were quantified after adding 1 μm Oligomycin, 2 μm FCCP and 2.5 μm Rotenone + Antimycin. N = 6 for each experimental condition. Statistical Analysis: (c-d, g-i) non-parametric two-sided t-tests. P-value of < 0.05 considered statistically significant. For (d, g-i) each dot represents an individual animal and bar height indicates mean and SEM. Data (e-i) representation of 2 or more independent experiments.
Extended Data Fig. 7 |
Extended Data Fig. 7 |. Genetic ablation of FABP5 does not affect body weight, circulating glucose and cholesterol, and hepatic inflammation after 15 months of CD-HFD feeding.
(a) RT-PCR analysis of FABP5 mRNA expression in non-parenchymal cells (NPCs) and hepatocytes after tamoxifen administration in Fabp5HKO mice. N = 3 for both experimental conditions. (b) Body weight before and after 15 months of CD-HFD feeding in Fabp5HKO mice. N = 8 for WT mice before diet, N = 5 for Fabp5HKO mice before diet, N = 12 for WT mice after diet and N = 13 for Fabp5HKO mice after diet. (c) Fasting glucose in Fabp5HKO mice after 15 months of CD-HFD feeding. N = 10 for WT mice and N = 13 for Fabp5HKO mice. (d) Total cholesterol in Fabp5HKO mice after 15 months of CD-HFD feeding. N = 10 for WT mice and N = 13 for Fabp5HKO mice. (e) ALT activity in Fabp5HKO mice after 15 months of CD-HFD feeding. N = 9 for WT mice and N = 13 for Fabp5HKO mice. (f) AST activity in Fabp5HKO mice after 15 months of CD-HFD feeding. N = 9 for WT mice and N = 13 for Fabp5HKO mice. (g) UMAP representation of 7 distinctive immune cell types from Fabp5HKO or WT HCC. (h) UMAP representation showing immune cells belonging to Fabp5HKO or WT HCC (left). Quantification of percentage composition from each cell type is shown (right). (i) UMAP representation of 4 distinctive mononuclear phagocyte clusters from Fabp5HKO or WT HCC (left). Top 5 signature genes from each cluster are shown via heatmap (right). (j) Expression of infiltrating (CHIL3, CCR2) and resident markers (CLEC4F, CD5L) in Fabp5HKO and WT mononuclear phagocytes. (k) UMAP representation showing mononuclear phagocytes belonging to Fabp5HKO or WT HCC (left). Quantification of percentage composition from each mononuclear phagocyte cluster is shown (right). (l) Flow cytometry quantification of CD11b+ Ly6G Ly6C+ Infil MPs in Fabp5HKO HCCs. N = 3 for WT mice and N = 2 for Fabp5HKO mice. (m) Flow cytometry analysis of CD86 expression in CD11b+F4/80+ TAMs in Fabp5HKO HCCs. N = 3 for WT mice and N = 2 for Fabp5HKO mice. (n) Flow cytometry analysis of CD80 expression in CD11b+F4/80+ TAMs in Fabp5HKO HCCs. N = 3 for WT mice and N = 2 for Fabp5HKO mice. (o) Flow cytometry analysis of CD206 expression in CD11b+F4/80+ TAMs in Fabp5HKO HCCs. N = 3 for WT mice and N = 2 for Fabp5HKO mice. Statistical Analysis: (a-d) non-parametric two-sided t-tests. P-value of < 0.05 considered statistically significant. For (a-d) each dot represents an individual animal and the bar height indicates the mean and SEM.
Extended Data Fig. 8 |
Extended Data Fig. 8 |. FABP5 inhibition promotes macrophage costimulatory receptor expression and T cell proliferation in HCC and subcutaneous tumours.
(A) Expression of CD9 and TREM2 by Feature plot in SBFI-103 and vehicle-treated HCC. (B) Expression of CD9 and TREM2 by Vioin plot in SBFI-103 and vehicle-treated HCC. (C) Zoomed out RNAscope representation of CX3CR1 (green) and CLEC4F (red) mRNA expression in SBFI-103 or vehicle-treated HCC. (D) Flow cytometry quantification of CD11b+ F4/80+ TAMs in SBFI-103 treated HCC. N = 4 for vehicle-treated and N = 5 for SBFI-103-treated HCC. (E) Flow cytometry quantification of CD11b+ Ly6G Ly6C+ Infiltrating MPs in SBFI-103 treated HCC. N = 4 for vehicle-treated and N = 5 for SBFI-103-treated HCC. (F) Flow cytometry analysis of Ly6C expression in CD11b+F4/80+ TAMs upon SBFI-103 treatment. N = 4 for vehicle-treated and N = 5 for SBFI-103-treated HCC. (G) Flow cytometry analysis of CD206 expression in CD11b+F4/80+ TAMs upon SBFI-103 treatment. N = 4 for vehicle-treated and N = 5 for SBFI-103-treated HCC. (H) Flow cytometry quantification of CD44+, CD62L intratumoral CD8+ T cells upon SBFI-103 treatment. N = 4 for vehicle-treated and N = 5 for SBFI-103-treated HCC. (I) CD8 immunohistochemistry analysis (left) and quantification (right) in HCC after SBFI-103 treatment. N = 4 for each experimental condition. (J) Flow cytometry quantification of PD1+ intratumoral CD8+ (left) and CD4+ (right) T cells upon SBFI-103 treatment. N = 4 for vehicle-treated and N = 5 for SBFI-103-treated HCC. (K) Circos plot of upregulated secreted factors and downstream ligands from immune cells in SBFI-103 treated conditions identified by NicheNet analysis. Secreted factors are labelled in purple, blue or yellow while downstream signalling ligands are labelled in red. Scale bars: 60 μm in (c). Statistical Analysis: (d-i) non-parametric two-sided t-tests. P-value of < 0.05 considered statistically significant. For (d-i) each dot represents an individual animal and bar height indicates mean and SEM. Data (c-i) representation of 2 or more independent experiments.
Extended Data Fig. 9 |
Extended Data Fig. 9 |. FABP5 inhibition promotes macrophage costimulatory receptor expression and T cell proliferation in the subcutaneous MC38 tumour model.
(a) Schematic outlining induction of subcutaneous tumour by injection of MC38 syngeneic tumour cells in the flank and daily treatment with SBFI-103. (b) Quantification of MC38 tumour volume after one week of SBFI-103 treatment. N = 6 for both experimental conditions. (c) Quantification of MC38 tumour weight after one week of SBFI-103 treatment. N = 6 for both experimental conditions. (d) Flow cytometry quantification of CD11b+ Ly6C+ immune cells in SBFI-103 treated MC38 tumours. N = 6 for both experimental conditions. (e) Flow cytometry quantification of CD86 expression in TAMs from SBFI-103 treated MC38 tumours. N = 6 for both experimental conditions. (f) Flow cytometry quantification of CD8+ T cells in SBFI-103 treated MC38 tumours. N = 6 for both experimental conditions. (g) Flow cytometry quantification of Ki67 MFI in CD8+ T cells from SBFI-103 treated MC38 tumours. N = 6 for both experimental conditions. Statistical Analysis: (b) one-way ANOVA followed by Dunnett’s post hoc test; (c-g) non-parametric two-sided t-tests. P-value of < 0.05 considered statistically significant. For (c-g) each dot represents an individual animal and bar height indicates mean and SEM. Data (b-g) representation of 2 or more independent experiments.
Extended Data Fig. 10 |
Extended Data Fig. 10 |. FABP5 silencing in macrophages enhances CD8+ T cell co-stimulation to promote CD8 proliferation and cytotoxicity.
(A) RT-PCR analysis of ARG1, MRC1, RETNLA, and YM1 mRNA expression in FABP5 siRNA-treated IL-4 polarized BMDMs. N = 3 for both experimental conditions. (B) Arginase activity in FABP5 siRNA-treated IL-4 polarized BMDMs. N = 3 for both experimental conditions. (C) Flow cytometry gating strategy for the identification of monocultured BMDMs before subsequent analysis. (D) Flow cytometry gating strategy for identifying co-cultured OT-I+ CD8+ T cells before subsequent analysis. (E) Flow cytometry analysis of CD86 MFI in FABP5 siRNA-treated BMDMs in nonpolarized and IL-4-treated. N = 3 for each experimental condition. (F) Flow cytometry analysis of CD80 MFI in FABP5 siRNA-treated BMDMs in nonpolarized and IL-4-treated conditions. N = 3 for each experimental condition. (G) Flow cytometry analysis of CD69+, CD25+ OT-I+ CD8+ T cells after 48 hours of co-culture with FABP5 siRNA-treated BMDMs in nonpolarized and IL-4-treated conditions. N = 3 for each experimental condition. (H) Flow cytometry analysis of CellTrace Violet (CTV) in OT-I+ CD8+ T cells after 48 hours of co-culture with FABP5 siRNA-treated BMDMs in nonpolarized and IL-4-treated conditions. N = 3 for each experimental condition. (I) Flow cytometry analysis of interferon-gamma (IFNγ) OT-I+ CD8+ T cells after 48 hours of co-culture with FABP5 siRNA-treated BMDMs in nonpolarized and IL-4-treated conditions. N = 3 for each experimental condition. (J) Flow cytometry analysis of Caspase 3high, Live/Dead Aquahigh B16-OVA Cancer Cells after 24 hours of co-culture with OT-I+ CD8+ T cells previously activated in the presence of FABP5 or control siRNA-treated BMDMs. N = 3 for each experimental condition. Statistical Analysis: (a-b, e-j) non-parametric two-sided t-tests. P-value of < 0.05 considered statistically significant. For (a-b, e-j) each dot represents an individual animal and bar height indicates mean and SEM. Data (a-b, e-j) representation of 2 or more independent experiments.
Fig. 1 |
Fig. 1 |. scRNA-seq uncovers dynamic changes in TCA cycle metabolic flux in obesity-induced HCC.
a, Developmental timeline of obesity-induced HCC in the CD-HFD model. scRNA-seq was performed at the 15-month time point by (1) separating PC and NPC fractions; (2) enriching for live cells; and (3) combining at a 1:1 ratio and submitting for sequencing. b, Circulating AFP in C57BL/6 mice at 12 and 15 months of CD-HFD feeding. High AFP is defined as >100 ng dl−1 and low AFP is defined as <100 ng dl−1. n = 39 at 12 months and n = 32 at 15 months after CD-HFD feeding. c, UMAP representation of 13 distinctive cell types from 15-month CD-HFD or ND-fed mice. EC, endothelial cell; DC, dendritic cell. d, UMAP representation of four distinctive experimental conditions from 15-month CD-HFD or ND-fed mice. Low AFP corresponds to HCC-negative animals and high AFP corresponds to HCC-positive mice (liver and HCC were collected from the same high AFP mice). e, UMAP representation of five distinctive cell clusters from hepatocytes and cancer cells (left). The top five differentially expressed marker genes are shown for each cell cluster (right). hep, hepatocytes. f, Expression of AFP in hepatocytes and cancer cells by feature plot and violin plot (top right). g, Pseudotime value visualization by Monocle3 across hepatocytes and cancer cells from 15-month CD-HFD and ND-fed mice. Violin plot of pseudotime value in each experimental condition (top left). h, Differential genes as a function of pseudotime value were identified using Monocle3. Genes corresponding to mitochondrial metabolism are highlighted in red. i, GO analysis of upregulated and downregulated DEGs identified as a function of Monocle3 pseudotime progression. j, Schematic demonstrating metabolic flux measured by PINTA and ex vivo NMR. Vcs flux and Vpc to Vcs ratio were evaluated in ND-fed control livers, high AFP CD-HFD-fed tumour-adjacent livers and high AFP CD-HFD-fed HCC. n = 3 for each experimental group. k, Vfao flux analysed by PINTA and ex vivo NMR in ND-fed control livers, high AFP CD-HFD-fed tumour-adjacent livers and high AFP CD-HFD-fed HCC. n = 3 for each experimental group. Statistical analysis was conducted by non-parametric two-sided t-tests (j,k). P < 0.05 considered statistically significant. For b,j,k, each dot represents an individual animal and bar height indicates mean and s.e.m. Data represent two or more independent experiments (b,j,k). Vpdh, pyruvate dehydrogenase flux.
Fig. 2 |
Fig. 2 |. FABP5 is specifically upregulated and associated with worse survival in HCC.
a, Volcano plot of DEGs in AFP-positive cancer cells compared with AFP-negative hepatocytes after 15 months of CD-HFD feeding. Select upregulated and downregulated genes are indicated. b, GSEA of significantly upregulated and downregulated genes in AFP-positive cancer cells from 15-month CD-HFD fed mice. GAP, GTPase-activating-protein; IQGAP, Ras GTPase-activating-like protein. c, FABP5 mRNA expression in healthy human liver and liver HCC from TCGA database. Data points indicate human patients per group; n = 369 for the HCC group and n = 160 for the liver group. HCC group: minima, 1.499; maxima, 8.807; centre, 4.18; box, 3.402–4.829; whisker, 1.5–6.919. Control group: minima, 0.2667; maxima, 7.077; centre, 1.946; box, 1.528–2.767; whisker, 0.2667–3.964. d, Correlation of FABP5 expression with overall survival in patients with HCC from TCGA database. Data extracted from 369 patients with HCC with a 50% cutoff for high and low FABP5 expression. e, IF imaging of FABP5 and stratification of FABP5 expression patterns in 11 HCC tumours from 15-month CD-HFD fed mice. f, IHC imaging of FABP5 in 11 HCC tumours from 15-month CD-HFD fed mice. Scale bars, 57 μm (e) and 20 μm (f). Statistical analyses used were Wilcox test, no adjustments made (a); a two-sided Mann–Whitney U-test (c); and a log-rank Mantel–Cox test (d). P < 0.05 was considered statistically significant. Data in e,f represent two or more independent experiments.
Fig. 3 |
Fig. 3 |. FABP5 inhibition sensitizes cancer cells to lipid peroxidation, ER stress and ferroptosis.
a, Schematic outlining SBFI-103 and FABP5 siRNA treatment regimen on Huh7 cells before RNA sequencing. b, Overlap of 467 significantly upregulated genes and 524 downregulated genes from inhibitor-treated and siRNA-treated Huh7 cells. c, GO analysis of overlapping upregulated and downregulated DEGs identified by RNA sequencing of inhibitor-treated and siRNA-treated Huh7 cells. d, Heatmap showing cell-cycle phase transition genes in 5 μM SBFI-103-treated Huh7 cells. e, Heatmap showing PERK-mediated UPR genes in 5 μM SBFI-103-treated Huh7 cells. f, MDA concentration in SBFI-103-treated and vehicle-treated Huh7 cell lines as measured through colorimetric assay. n = 3 for both experimental groups. g, Flow cytometry analysis of BODIPY 581/591 C11 mean fluorescent intensity (MFI) in 5 μM SBFI-103-treated Huh7 cells. n = 3 for both experimental groups. h, Flow cytometry analysis of CellRox MFI in 5 μM SBFI-103-treated Huh7 cells. n = 3 for both experimental groups. i, Western blot of PERK, ATF4, IRE1A and BIP in 5 μM SBFI-103-treated and control Huh7 cells. n = 3 for both experimental groups. Statistical analysis was conducted with non-parametric two-sided t-tests (fh); P < 0.05 was considered statistically significant. For fh, each dot represents an individual animal and the bar height indicates the mean and s.e.m. Data (fi) represent two or more independent experiments.
Fig. 4 |
Fig. 4 |. FABP5 inhibition ameliorates HCC progression.
a, Schematic outlining inhibitor constant (Ki; μM) of SBFI-103 in FABPs and treatment regimen for FABP5 inhibition in CD-HFD induced HCC. i.p., intraperitoneal. b, Circulating AFP in CD-HFD fed mice before (12 months) and after (15 months) treatment with SBFI-103. Lines connect before- and after-treatment AFP values from the same animal. n = 13 for both experimental groups. c, Quantification of HCC-positive mice after 3 months of SBFI-103 treatment. n = 19 for vehicle-treated mice and n = 20 for SBFI-103-treated mice. d, Quantification of HCC nodules per liver in tumour-bearing mice after 3 months of SBFI-103 treatment. n = 10 for vehicle-treated mice and n = 6 for SBFI-103-treated mice. e, Quantification of HCC volume in tumour-bearing mice after 3 months of SBFI-103 treatment. n = 10 for vehicle-treated mice and n = 6 for SBFI-103-treated mice. f, IF imaging and quantification of FABP5 and TUNEL staining in control and SBFI-103-treated HCC. n = 4 for both experimental groups. g, Western blot analysis of AFP, YAP, P-YAP (Ser127), PTEN and RB in SBFI-103-treated HCC, control HCC and control liver region. n = 3 for each experimental group. h, Dot-plot expression of AFP, YAP1, FABP5 and YAP response genes from single-cell analysis from SBFI-103-treated and control HCC. Scale bars, 100 μm (f). Statistical analysis was carried out by non-parametric two-sided t-tests (df); P < 0.05 was considered statistically significant. For df, each dot represents an individual animal and the bar height indicates the mean and s.e.m. Data (f,g) represent two or more independent experiments.
Fig. 5 |
Fig. 5 |. FABP5 inhibition restores HCC FAO and promotes lipid peroxidation-induced ferroptosis.
a, UMAP representation of four distinctive cancer clusters from SBFI-103- or vehicle-treated HCC (left). The top five signature genes from each cluster are shown via heatmap (right). b, UMAP representation showing sequenced cancer cells belonging to SBFI-103- or vehicle-treated conditions. c, Volcano plot of DEGs in SBFI-103-treated cancer cells compared with vehicle-treated cancer cells. Select upregulated and downregulated genes are indicated. d, GSEA of significantly upregulated and downregulated genes in SBFI-103-treated cancer cells. e, EM analysis and quantification of mitochondria from the vehicle-treated liver, vehicle-treated HCC and SBFI-103-treated HCC (left). Probability curves depict the distribution of mitochondrial aspect ratio (right). n = 3 for each experimental group. f, Vfao flux analysed by PINTA and ex vivo NMR in vehicle-treated liver, vehicle-treated HCC and SBFI-103-treated HCC. n = 3 for each experimental group. g, OCR was measured after 8 h of treatment with 5 μM SBFI-103 in Huh7 cells with and without 20 μm etoximir (Eto) by Seahorse extracellular flux analyzer. Basal and spare respiratory capacity were quantified after adding 1 μm oligomycin, 2 μm FCCP and 2.5 μm rotenone + antimycin. n = 8 for each experimental condition. h, MDA concentration in SBFI-103-treated and vehicle-treated HCC as measured through colorimetric assay. n = 3 for each experimental group. i, Western blot of ACSL4, TFR1 and CHOP in SBFI-103-treated HCC, vehicle-treated HCC and vehicle-treated liver. n = 3 for each experimental group. j, RT–PCR analysis of PTGS2 and ASNS in SBFI-103-treated HCC, vehicle-treated HCC and vehicle-treated liver. n = 3 for each experimental group. k, RT–PCR analysis of unspliced (us) and spliced (s) forms of XBP1 in SBFI-103-treated and vehicle-treated HCC. n = 3 for each experimental group. l, Representative Perls Prussian blue staining of iron content in SBFI-103-treated HCC and vehicle-treated HCC. m, DHE staining (left) and quantification (right) of ROS content in SBFI-103-treated and vehicle-treated HCC. n = 3 for each experimental group. Scale bars, 2 μm (e), 40 μm (l) and 20 μm (m). Statistical analyses were non-parametric two-sided t-tests (eh,j,k,m) and a Wilcox test with no adjustments made (c); P < 0.05 was considered statistically significant. For eh,j,k, each dot represents an individual animal and the bar height indicates the mean and s.e.m. Data (gm,l) represent two or more independent experiments.
Fig. 6 |
Fig. 6 |. Genetic ablation of FABP5 reduces HCC burden by inducing lipid peroxidation and ferroptosis.
a, Schematic outlining induction of HCC by 15 months of CD-HFD feeding in tamoxifen-treated Fabp5HKO mice. b, Circulating AFP in CD-HFD-fed mice at 15 months after CD-HFD feeding in Fabp5HKO mice. n = 11 for WT mice and n = 13 for Fabp5HKO mice. c, Quantification of HCC-positive mice after 15 months of CD-HFD feeding in Fabp5HKO mice. n = 11 for WT mice and n = 13 for Fabp5HKO mice. d, Quantification of HCC nodules per liver in tumour-bearing mice after 15 months of CD-HFD feeding in Fabp5HKO mice. n = 4 for WT mice and n = 2 for Fabp5HKO mice. e, Quantification of HCC volume in tumour-bearing mice after 15 months of CD-HFD feeding in Fabp5HKO mice. n = 4 for WT mice and n = 2 for Fabp5HKO mice. f, UMAP representation of four distinctive cancer clusters Fabp5HKO or WT HCC (left). Top five signature genes from each cluster are shown via heatmap (right). g, UMAP representation showing sequenced cancer cells belonging to Fabp5HKO or WT conditions. h, Expression of AFP and FABP5 in hepatocytes and cancer cells treated with vehicle or SBFI-103 by Feature plot. i, Volcano plot of DEGs in Fabp5HKO cancer cells compared with WT cancer cells. Select upregulated and downregulated genes are indicated. KO, knockout. j, GO analysis of significantly upregulated and downregulated genes in Fabp5HKO cancer cells. k, MDA concentration in Fabp5HKO and WT HCC as measured through colorimetric assay. n = 3 for WT mice and n = 2 for Fabp5HKO mice. l, Western blot of ACSL4, TFR1, AFP, BIP and CHOP in Fabp5HKO HCC, WT HCC and WT liver. n = 3 for WT mice and n = 2 for Fabp5HKO mice. Statistical analysis was conducted by a Wilcox test with no adjustments made (i). For d,e,k, each dot represents an individual animal and the bar height indicates the mean and s.e.m.
Fig. 7 |
Fig. 7 |. SBFI-103 promotes the accumulation of pro-inflammatory macrophages and cytotoxic T cells.
a, UMAP representation of six distinctive immune cell types from SBFI-103 or vehicle-treated HCC. b, UMAP representation of four distinctive mononuclear phagocyte clusters from SBFI-103 or vehicle-treated HCC (left). Top four signature genes from each cluster are shown via heatmap (right). c, UMAP representation showing sequenced mononuclear phagocyte belonging to SBFI-103 or vehicle-treated conditions (left). Quantification of percentage composition from each mononuclear phagocyte cluster is shown (right). d, RNAscope representation (left) and quantification (right) of CX3CR1 (green) and CLEC4F (red) mRNA expression in SBFI-103 or vehicle-treated HCC. n = 4 for both experimental conditions. e, Flow cytometry analysis of CD86 expression in CD11b+F4/80+ TAMs upon SBFI-103 treatment. n = 4 for vehicle-treated and n = 5 for SBFI-103-treated HCC. f, Flow cytometry analysis of CD80 expression in CD11b+F4/80+ TAMs upon SBFI-103 treatment. n = 4 for vehicle-treated and n = 5 for SBFI-103-treated HCC. g, Flow cytometry quantification of intratumoral CD8+ T cells as a percentage of CD45+ immune cells upon SBFI-103 treatment. n = 4 for vehicle-treated and n = 5 for SBFI-103-treated HCC. h, Flow cytometry quantification of Ki67+ intratumoral CD8+ T cells upon SBFI-103 treatment. n = 4 for vehicle-treated and n = 5 for SBFI-103-treated HCC. i, Heatmap of upregulated secreted factors and downstream ligands from MPs and CD8+ T cells in SBFI-103-treated conditions identified by NicheNet analysis. Shown are (i) predicted regulatory ligands from MPs and CD8+ T cells based on DEGs; (ii) predicted ligand activity of each secreted factor based on the expression of downstream target; and (iii) the relative expression of secreted ligands in SBFI-103-treated as compared with control conditions. Scale bars, 12 μm (d). Statistical analysis was conducted by non-parametric two-sided t-tests (dh); P < 0.05 was considered statistically significant. For dh, each dot represents an individual animal and bar height indicates mean and s.e.m. Data (eh) represent two or more independent experiments.
Fig. 8 |
Fig. 8 |. FABP5 inhibition in macrophages enhances CD8+ T cell co-stimulation to promote CD8 proliferation and cytotoxicity.
a, Schematic outlining treatment co-culture setup of SBFI-103- or FABP5 siRNA-treated BMDMs with OT-I+ T cells or B16-OVA cancer cells. b, RT–PCR analysis of FABP5 mRNA expression in 15 ng ml−1 IL-4-treated and untreated BMDMs. n = 3 for both experimental conditions. Unpol, unpolarized. c, Western blot analysis (left) and quantification (right) of FABP5 in 15 ng ml−1 IL-4-treated and untreated BMDMs. n = 3 for both experimental conditions. d, RT–PCR analysis of ARG1, MRC1, RETNLA and YM1 mRNA expression in 10 μM SBFI-103-treated IL-4 polarized BMDMs. n = 3 for both experimental conditions. e, Arginase activity in 10 μM SBFI-103-treated IL-4 polarized BMDMs. n = 3 for both experimental conditions. f, Flow cytometry analysis of CD86 MFI in 10 μM SBFI-103-treated BMDMs in non-polarized and IL-4-treated conditions. n = 3 for each experimental condition. g, Flow cytometry analysis of CD80 MFI in 10 μM SBFI-103-treated BMDMs in non-polarized and IL-4-treated conditions. n = 3 for each experimental condition. h, Flow cytometry analysis of CD69+, CD25+ OT-I+CD8+ T cells after 48 h of co-culture with 10 μM SBFI-103-treated BMDMs in non-polarized and IL-4-treated conditions. n = 3 for each experimental condition. i, Flow cytometry analysis of CTV in OT-I+CD8+ T cells after 48 h of co-culture with 10 μM SBFI-103-treated BMDMs in non-polarized and IL-4-treated conditions. n = 3 for each experimental condition. j, Flow cytometry analysis of IFNγ OT-I+CD8+ T cells after 48 h of co-culture with 10 μM SBFI-103-treated BMDMs in non-polarized and IL-4-treated conditions. n = 4 for each experimental condition. k, Flow cytometry analysis of caspase 3highLIVE/DEAD Aquahigh B16-OVA cancer cells after 24 h of co-culture with OT-I+CD8+ T cells previously activated in the presence of SBFI-103- or vehicle-treated BMDMs. n = 4 for each experimental condition. Statistical analysis was carried out by non-parametric two-sided t-tests (bk); P < 0.05 considered statistically significant. For bk, each dot represents an individual animal and bar height indicates mean and s.e.m. Data (bk) represent two or more independent experiments.

Similar articles

Cited by

References

    1. Llovet JM et al. Hepatocellular carcinoma. Nat. Rev. Dis. Primers 7, 6 (2021). - PubMed
    1. Villanueva A Hepatocellular carcinoma. N. Engl. J. Med 380, 1450–1462 (2019). - PubMed
    1. Anstee QM, Reeves HL, Kotsiliti E, Govaere O & Heikenwalder M From NASH to HCC: current concepts and future challenges. Nat. Rev. Gastroenterol. Hepatol 16, 411–428 (2019). - PubMed
    1. Schadinger SE, Bucher NL, Schreiber BM & Farmer SR PPARgamma2 regulates lipogenesis and lipid accumulation in steatotic hepatocytes. Am. J. Physiol. Endocrinol. Metab 288, E1195–E1205 (2005). - PubMed
    1. Sakurai T et al. Hepatocyte necrosis induced by oxidative stress and IL-1α release mediate carcinogen-induced compensatory proliferation and liver tumorigenesis. Cancer Cell 14, 156–165 (2008). - PMC - PubMed

Publication types