. 2024 Oct;20(10):1282-1293.
doi: 10.1038/s41589-024-01596-3. Epub 2024 Apr 25.

Minimizing higher-order aggregation maximizes iron mobilization by small molecules

Affiliations

Minimizing higher-order aggregation maximizes iron mobilization by small molecules

Andrew D Blake et al. Nat Chem Biol. 2024 Oct.

Abstract

The natural product hinokitiol mobilizes iron across lipid bilayers at low concentrations and restores hemoglobinization in iron transporter protein-deficient systems. But hinokitiol fails to similarly mobilize iron at higher concentrations, limiting its uses in chemical biology and medicine. Here we show that at higher concentrations, hinokitiol3:Fe(III) complexes form large, higher-order aggregates, leading to loss of transmembrane iron mobilization. Guided by this understanding and systematic structure-function studies enabled by modular synthesis, we identified FeM-1269, which minimally aggregates and dose-dependently mobilizes iron across lipid bilayers even at very high concentrations. In contrast to hinokitiol, FeM-1269 is also well-tolerated in animals at high doses for extended periods of time. In a mouse model of anemia of inflammation, FeM-1269 increases serum iron, transferrin saturation, hemoglobin and hematocrit. This rationally developed iron-mobilizing small molecule has enhanced potential as a molecular prosthetic for understanding and potentially treating iron transporter deficiencies.


Conflict of interest statement

Competing interests

M.D.B. is an inventor on the US patent application pub. 20180263926, ‘Restoring Physiology in Iron-Deficient Organisms Using Small Molecules’, which is directed to the use of small-molecule iron transporters to treat deficiencies of iron-transport proteins. A.D.B., A.M.S.M. and M.D.B. are inventors on the US patent application pub. 20210163393, ‘Hinokitiol analogs, methods of preparing and pharmaceutical compositions thereof’, which is directed to analogs of hinokitiol, preparation and formulation. These patent applications, their foreign counterparts and others have been licensed by Cajal Neuroscience, for which M.D.B. is a scientific advisor and shareholder. Ambys Medicines has filed patent applications directed to tropolone derivatives and tautomers thereof for iron regulation in animals. J.C., N.M.S., D.M.M., T.G., A.O. and S.J.H. were full-time employees of Ambys Medicines when these data were generated. These patents are currently owned by Cajal Neuroscience. The other authors declare no competing interests.

Figures

Extended Data Fig. 1 |
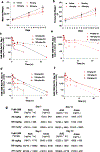
Extended Data Fig. 1 |. In vitro iron mobilization and aggregation by tropolonoids.
a, Time course of iron efflux from liposomes with different concentrations of hinokitiol, GT or FeM-1269 (n = 3; representative experiment shown). b, Rates of iron efflux from liposomes at each concentration of compounds, calculated from data in ac. c, DLS derived count rate measured in different concentrations of MES/TRIS buffer, pH 7.0 (n = 3; representative experiment shown). d, DLS derived count rate measured at different pH of 50 mM MES/TRIS buffer (n = 3; representative experiment shown). e, DLS derived count rate measured with different buffering agents at 50 mM of buffer (n = 3; representative experiment shown). f, DLS derived count rate of hinokitiol2:Cu(II), GT2:Cu(II) and FeM-12692:Cu(II) (n = 3; representative experiment shown). g, Additional representative images from 90 μM of hino3:Fe(III), GT3:Fe(III) or FeM-12693:Fe(III) in buffer (n = 50, 45, 51 images for hino, GT and FeM-1269, respectively; images were taken from three independent sample preparations; scale bar is 500 nm). h, Iron efflux by tropolone derivatives from shDMT1 Caco-2 epithelia at 1 μM (n = 3, representative experiment shown). i, Iron efflux by tropolone derivatives from shDMT1 Caco-2 epithelia at 5 μM (n = 3, representative experiment shown).
Extended Data Fig. 2 |
Extended Data Fig. 2 |. Physicochemical parameters of tropolone iron mobilizer library.
a, Physicochemical parameters of tropolones relative to performance in liposomes, defined by Elip. b, Physicochemical parameters of tropolones relative to iron mobilized in shDMT1-Caco-2 differentiated gut epithelia after 4 hours at 3 μM, tracked by 55FeCl3 (n = 3; experiments were performed at least twice). c, Physicochemical parameters of tropolones relative to iron mobilized in shDMT1-Caco-2 differentiated gut epithelia after 4 hours at 10 μM, tracked by 55FeCl3 (n = 3; experiments were performed at least twice). All parameters were computed in SwissADME.
Extended Data Fig. 3 |
Extended Data Fig. 3 |. Physicochemical parameters and chemical structures of highly effective iron mobilizers.
af, Physicochemical parameters of top tropolones in each assay for iron mobilization (n = 20 tropolones). Extracted from the datasets displayed in Extended Data Fig. 2. g, Chemical structures of the top 20 tropolone iron mobilizers in shDMT1-Caco-2 epithelia at 10 μΜ are largely substituted with short alkyl- or alkoxy-side chain substituents. Of note, (+)-6 and (−)-6 are isolated during the preparation of (±)-6 and were independently evaluated. See the Supplementary Note for details on chiral separation. Error bars indicate SEM.
Extended Data Fig. 4 |
Extended Data Fig. 4 |. FeM-1269 has a favorable drug-like profile.
a, Efflux of Fe(III) after 30 minutes, tracked by incorporation into ferrozine (n = 3; representative experiment shown). b, Iron efflux from shDMT1 Caco-2 at several concentrations (n = 3; representative experiment shown). c, Fe(III) efflux from FPN1-KO RAW264.7 macrophages after 2 hours, tracked by 55FeCl3 (n = 3; representative experiment shown). Error bars indicate SEM. d, Dashboard of in vitro ADME studies on FeM-1269. e, Stoichiometric competition experiment with 1 mM of each divalent metal and 1 mM of the indicated tropolone. Tropolone-bound metal was measured by ICP-MS after equilibration and extraction with ethyl acetate (n = 3 independent samples). f, Serum plasma content in mice of tropolonoids after single-dose of 10 mg/kg in water for injection (n = 3 animals per group). g, Calculated pharmacokinetic parameters of data in c. h, Maximum tolerated dose finding and pharmacokinetic study in mice of orally administered FeM-1269 (n = 2 animals per group) – MTD = 1000 mg/kg. i, Correlation between exposure and administered dose, using data in Fig. 4d and the study in f. j, Calculated pharmacokinetic calculations for MTD study in e (n = 2 per group). k, Results from micronucleus testing at MTD of FeM-1269 of 1000 mg/kg/day – (n = 5, 5, 4 animals for vehicle treated, 24 hours post-FeM-1269 and 48 hours post-FeM-1269, respectively). l, Pharmacokinetic study of FeM1269 in rats (n = 3 animals per group). m, Pharmacokinetic study of FeM-1269 in beagle dogs (n = 3 animals per group). Detailed pharmacokinetic calculations are available in Supplementary Table 3 for the studies in l,m. Error bars indicate SEM.
Extended Data Fig. 5 |
Extended Data Fig. 5 |. Additional outcomes from two-week toxicology studies with hinokitiol and GT.
a, Animal weights from two-week daily administration of hinokitiol at 10, 30 and 100 mg/kg/day (n = 6 animals per group). b, Pharmacokinetic study to establish bioavailability and approximate exposure to hinokitiol (n = 3 animals per group). c, Pharmacokinetics of hinokitiol administered on day 1 to rats (n = 3 animals per group). d, Pharmacokinetics of hinokitiol administered on day 15 to rats (n = 3 animals per group). e, Pharmacokinetic calculations from studies in c,d. f, Representative H&E staining of rat myocardium from an animal treated with 30 mg/kg of hinokitiol. g, Representative H&E staining of rat myocardium from an animal treated with 100 mg/kg of hinokitiol. h, Representative H&E staining of rat myocardium from an animal treated with 100 mg/kg of hinokitiol. i, Rat weights from two-week daily administration of GT at 15, 45 and 105 mg/kg/day (n = 6 animals per group). j, Pharmacokinetic study to establish bioavailability and approximate exposure to GT (n = 3 animals per group). k, Pharmacokinetic study of serum concentrations of GT on day 1 of the study (n = 3 animals per group). l, Pharmacokinetic study of serum concentrations of GT on day 15 of the study (n = 3 animals per group). m, Pharmacokinetic calculations from studies with GT in c,d. n, Representative H&E staining of rat myocardium from an animal treated with 45 mg/kg of GT. o, Representative H&E staining of rat myocardium from an animal treated with 105 mg/kg of GT. p, Representative DAB-Perl’s staining of rat myocardium from an animal treated with 105 mg/kg of GT. Arrows indicate features of interest. For panels fh, np, the scale bars indicate 200 μm, and a minimum of three animals were processed and imaged for each treatment group. Pharmacokinetic calculations were performed in WinNonlin. Error bars indicate SEM.
Extended Data Fig. 6 |
Extended Data Fig. 6 |. Additional data from two-week rat toxicology study with FeM-1269.
a, Animal weights from two-week daily administration of FeM-1269 at 30, 100 and 300 mg/kg/day in male rats (n = 3 animals per group). b, Animal weights from two-week daily administration of FeM-1269 at 30, 100 and 300 mg/kg/day in female rats (n = 3 animals per group). c, Pharmacokinetic study of serum concentrations of FeM-1269 on day 1 of the study in male rats (n = 2 animals per group). d, Pharmacokinetic study of serum concentrations of FeM-1269 on day 15 of the study in males (n = 2 animals per group). e, Pharmacokinetic study of serum concentrations of FeM-1269 on day 1 of the study in females (n = 2 animals per group). f, Pharmacokinetic study of serum concentrations of FeM-1269 on day 15 of the study in females (n = 2 animals per group). g, Calculated pharmacokinetic parameters from studies in cf. Error bars indicate SEM.
Extended Data Fig. 7 |
Extended Data Fig. 7 |. Additional data from three-month mouse toxicology studies with FeM-1269 and stress erythropoiesis follow-up.
a, Male weights with daily administration of FeM-1269 (n = 6 animals per group). b, Female weights with daily administration of FeM-1269 (n = 6 animals per group). c,d, Histopathological analysis of tissues following FeM-1269 administration for 90 days in male and female mice (n = 6 animals per group). Only the tissues in which findings were observed were included in these graphs. Observation of the following tissues yielded no histopathological findings: brain, skeletal muscle, small intestine, spleen or thymus. Statistics in c,d were performed using two-way ANOVA with Dunnett’s multiple comparisons test. e, Female mouse weights following treatment with vehicle (0.5% HPMC) or 150 mg/kg/day of FeM-1269 (n = 12 animals per group). f, Spleen iron as assessed by ICP-MS (n = 12 per group, p = 0.0437). g, Histopathology analysis of mouse spleens using Prussian blue staining (n = 12 per group, p = 0.1114). h, Counts of bone marrow burst-forming unit, erythrocytes (BFU) (n = 12 per group, p = 0.4848). i, Counts of bone marrow colony-forming unit, erythrocytes (CFU) (n = 12 per group, p = 0.6243). j, Counts of spleen-derived BFU (n = 12 per group, p = 0.9999). k, Counts of bone marrow burst-forming unit, erythrocytes (CFU) (n = 12 per group, p = 0.0934). Statistics in fk were performed using two-sided unpaired t-tests with Welch’s correction. For p-values for c,d, please see the source data file. Error bars represent SEM.
Extended Data Fig. 8 |
Extended Data Fig. 8 |. Studies of FeM-1269 administration in flatiron mice.
In ad, animals were administered vehicle or increasing doses of FeM-1269 via oral gavage and sacrificed 3 hours later for data collection (n = 6 animals for all groups). a, Duodenum non-heme iron levels. b, Spleen non-heme iron levels. c, Liver non-heme iron levels. d, Transferrin saturation. In ek, animals were given 10 mg/kg of either hinokitiol, FeM-1269 or deferiprone daily for seven days, then sacrificed three hours after the final dose for data collection (n = 6 animals for WT + vehicle, FeM-1269 10 mg/kg; n = 5 for other groups). e, Duodenum non-heme iron levels (n = 6 animals for WT + vehicle, FeM-1269 10 mg/kg; n = 5 for other groups). f, Spleen non-heme iron levels. g, Liver non-heme iron levels. h, Transferrin saturation levels. i, Total serum iron levels. j, Hemoglobin. k, Hematocrit. Statistics were performed using one-way ANOVA with Tukey’s multiple comparisons test between each group and the vehicle treated group. For p-values, please see the source data file. Error bars indicate SEM. Where displayed, *p < 0.05 relative to vehicle controls.
Extended Data Fig. 9 |
Extended Data Fig. 9 |. Additional data from anemia of inflammation study in Fig. 6.
In af, mice were treated as described in the supporting information section ‘Anemia of Inflammation Dose-Escalation Study’ (n = 10 animals for Sham and TO + bleed groups; n = 12 for all other groups). a, Weight of mice employed in the study. b, Calculated daily exposure to FeM-1269 based on pharmacokinetic data in Extended Data Fig. 4i. c, Transferrin saturation following daily administrations of hinokitiol (predicted area under the curve (AUC) 9560 ng/mL * hr). d, Total serum iron following daily administration of hinokitiol. e, Hemoglobin following daily administration of hinokitiol. f, Hematocrit following daily administration of hinokitiol. Sham and vehicle data in c–f are replicated from Fig. 6. Statistics were analyzed in Prism using one-way ANOVA with Dunnett’s or Tukey’s multiple comparisons tests as appropriate. For p-values, please see the source data file. Error bars indicate SEM. Where displayed, *P < 0.05, **P < 0.01, ***P < 0.001, ****P < 0.0001 relative to vehicle controls or as otherwise specified.
Fig. 1 |
Fig. 1 |. Constitutional isomers with divergent mobilization and higher-order aggregation profiles.
a, Chemical structures of hinokitiol (1) and γ-thujaplicin (2). b, Fe(III) mobilization in shDMT1-Caco-2 differentiated gut epithelia after 4 h, tracked by 55FeCl3 (n = 3; representative experiment shown; P < 0.0001). c, Fe(III) efflux from liposomes after 30 min, tracked by incorporation into ferrozine (n = 3; representative experiment shown, P < 0.0001). In d and e, a simplified model displaying the impact of higher-order aggregation on iron mobilization by small molecules. d, Model for mobilization at low concentrations of compound. e, Loss of mobilization at high concentrations due to higher-order aggregation of lipophilic tropolone:iron complexes. f, DLS studies of hino3:Fe(III) (n = 3; representative experiment shown). g, DLS studies of GT3:Fe(III) in buffer (n = 3; representative experiment shown). For the images in h and i, images were acquired from three biologically independent sample preparations (scale bar is 500 nm). h, TEM images of 90 μM hino3:Fe(III) (n = 50). i, TEM images of 90 μM GT3:Fe(III) (n = 45). j, Crystal structure of hino3:Fe(III), grown from 10:1 acetone/benzene with slow evaporation. k, Crystal structure of GT3:Fe(III), grown from 10:1 acetone/benzene with slow evaporation. Statistics in b and c were analyzed using Prism 9 using one-way ANOVA, and the displayed statistical significance represents differences between groups receiving hinokitiol and GT treatment. Error bars indicate s.e.m. When displayed, *P < 0.05, **P < 0.01, ***P < 0.001 and ****P < 0.0001.
Fig. 2 |
Fig. 2 |. Structure–activity study of alkyl tropolones to identify favorable liposome and Caco-2 iron mobilization profiles.
a, Schematic representation of building-block-based synthetic campaign, along with the synthesis of the methyl-protected tropolone bromides 3–5, denoted by the red blocks. b, Efflux of Fe(III) after 30 min by each tropolonoid, tracked by incorporation into ferrozine (n = 3; key is in nmol Fe(III) incorporated into ferrozine). At left, the identity of the blue blocks used in the synthetic campaign—in the case of the isopropyl substituted tropolones, an isopropenyl N-methylimidodiacetic acid (MIDA) boronate was used. For all others, the alkyl boronic acid was used. See the Supplementary Note for detailed synthesis information. c, Study of alkyl tropolones in Caco-2 epithelia, with 25 μM of compound added (n = 3; representative experiment shown). Error bars indicate s.e.m.
Fig. 3 |
Fig. 3 |. Further structure–activity study to identify and validate FeM-1269 as an optimized iron mobilizer.
a, Schematic representation of building-block-based synthetic campaign and screening, with iron mobilization in liposomes and Caco-2 serving as a key marker of compound behavior, culminating in the discovery of FeM-1269. b, Efflux of Fe(III) after 30 min by hino, GT and FeM-1269, tracked by incorporation into ferrozine (n = 3; representative experiment shown). c, DLS studies of FeM-12693:Fe(III) (n = 3, representative experiment shown). d, TEM images of 90 μM FeM-12693:Fe(III) (n = 51; scale bar is 500 nm). e, DLS average particle size of hino3:Fe(III), GT3:Fe(III) and FeM-12693:Fe(III) from experiments displayed in Figs. 1 and 3. f, TEM average particle size of hino3:Fe(III), GT3:Fe(III) and FeM-12693:Fe(III) from experiments displayed in Figs. 1h,i and 3d (n = 50, 45 and 51 images for hino, GT and FeM-1269, respectively, from three separate preparations per). g, Count rate from DLS samples measured and reported in Figs. 1f,g and 3c (n = 3 independent experiments). h, Particles per image from TEM studies (n = 50, 45 and 51 for hino, GT and FeM-1269, respectively). i, Fe(III) mobilization in shDMT1-Caco-2 differentiated gut epithelia after 4 h, tracked by 55FeCl3 (n = 3; representative experiment shown). Inset displays the calculated linear regressions for the data shown below. j, Fe(III) mobilization in FPN1-KD Caco-2 differentiated gut epithelia after 4 h, tracked by 55FeCl3 (n = 3; representative experiment shown). Inset displays the calculated linear regressions for the data shown below. For the images in d, f and h, images were acquired from three biologically independent sample preparations. Statistics in b, i and j were analyzed using two-way ANOVA with Tukey’s multiple comparison test. Statistics in f and h were analyzed using one-way ANOVA with Tukey’s multiple comparison test. For P values for f and h, see the source data file. Error bars indicate s.e.m. NS, not significant. When displayed, *P < 0.05, **P < 0.01, ***P < 0.001 and ****P < 0.0001 relative to vehicle controls or as otherwise specified.
Fig. 4 |
Fig. 4 |. FeM-1269 is better tolerated than hinokitiol or GT in rats.
a, Weight of rats treated with hinokitiol for 2 weeks (n = 6 animals for all groups). b, Histopathology scoring of mice treated with hinokitiol for 2 weeks (n = 5, 6, 6 and 5 animals for vehicle, 10 mg kg−1, 30 mg kg−1 and 100 mg kg−1, respectively). c, Representative DAB–Perl’s staining of rat myocardium from an animal treated with 30 mg kg−1 of hinokitiol (LV, left ventricle). d, Weight of rats treated with GT for 2 weeks (n = 6 animals for all groups). e, Histopathology scoring of mice treated with GT for 2 weeks (n = 6 animals for all groups). f, Representative DAB–Perl’s staining of rat myocardium from an animal treated with 45 mg kg−1 of GT. V designates ventricular myocardium, ET designates extracardiac tissue and NS indicates blushing of the myocardium which was not considered in scoring of the images. g, Weight of rats treated with FeM-1269 for 2 weeks (n = 3 animals for all groups). h, Exposure at the highest tolerated doses from studies in a, d and g (n = 3, 3, 2 and 2 animals per group for hinokitiol, GT, FeM-1269 (M) and FeM-1269 (F), respectively). i, Weight of mice treated with FeM-1269 daily for 13 weeks (n = 6 animals for all groups). Arrows in c and f indicate features of interest. Pharmacokinetic calculations are available in the Supplementary Information for the studies summarized in h. Scale bars for the images in c and f indicate 200 μm. Statistics were analyzed using one-way ANOVA with Tukey’s multiple comparisons test. For P values for a, b, d and e, see the source data files. Error bars indicate s.e.m. When displayed, *P < 0.05, **P < 0.01, ***P < 0.001, ****P < 0.0001 relative to vehicle controls.
Fig. 5 |
Fig. 5 |. High exposures of FeM-1269 do not disturb trace metal homeostasis.
For these plots, the shape of the data point corresponds to the dose administered, and the color corresponds to the metal measured. a, Results from ICP-MS analysis of male mice tissues following 90 days of treatment (n = 6 animals per treatment group). b, Results from ICP-MS analysis of female mice tissues following 90 days of treatment (n = 6 animals per treatment group). c, Results from ICP-MS analysis of male rats tissues following 90 days of treatment (n = 3 animals per treatment group). d, Results from ICP-MS analysis of female rat tissues following 90 days of treatment (n = 3 animals per treatment group). The full datasets are displayed in Supplementary Figs. 16–19. The data and statistics used to generate these plots can be found in the corresponding data files. Statistics were analyzed using two-way ANOVA with Dunnett’s multiple comparisons analysis.
Fig. 6 |
Fig. 6 |. FeM-1269 promotes restored iron mobilization in AoI.
a, Optimized AoI model. b, Effect of TO on serum IL-6 (ELISA, n = 5, 7 and 12 for sham (D22), TO + vehicle (D22) and TO + vehicle (D28), respectively). c, Effect of TO on serum hepcidin (ELISA, n = 9, 8 and 12 for sham (D22), TO + vehicle (D22) and TO + vehicle (D28), respectively). d, Effect of TO on liver FPN1 levels (western blot, n = 6; raw blots are displayed in Supplementary Fig. 20). e, Effect of TO on serum IL-1α (ELISA, n = 6, 5 and 6 for sham, TO + bleeding (D28) and TO + vehicle (D28), respectively). f, Effect of TO on serum IL-1β (ELISA, n = 9, 7 and 11 for sham, TO + bleeding (D28) and TO + vehicle (D28), respectively). g, Effect of TO on serum TNF levels (ELISA, n = 5, 7 and 11 for sham, TO + bleeding (D28) and TO + vehicle (D28), respectively). For hk, the following sample sizes were used: n = 10 for sham, TO + bleeding; n = 12 for the remaining groups. h, Transferrin saturation following 6 days of FeM-1269 administration. i, Total serum iron following 6 days of FeM-1269 administration. j, Hemoglobin following 6 days of FeM-1269 administration. k, Hematocrit following 6 days of FeM-1269 administration. l, Compound in the serum following 6 days of FeM-1269 administration (LC–MS). In bg, statistics were analyzed in Prism 9 using one-way ANOVA with Tukey’s multiple comparison test between each treatment group. In hk, statistics were analyzed using two-way ANOVA with Tukey’s multiple comparisons test between each group and the vehicle-treated group. For P values, please see the source data files. Error bars indicate s.e.m. When displayed, *P < 0.05, **P < 0.01, ***P < 0.001, ****P < 0.0001 relative to vehicle controls or as otherwise specified.

References

    1. Weiss G, Ganz T & Goodnough LT Anemia of inflammation. Blood 133, 40–50 (2019). - PMC - PubMed
    1. Ganz T Anemia of inflammation. N. Engl. J. Med. 381, 1148–1157 (2019). - PubMed
    1. Rivera S & Ganz T Animal models of anemia of inflammation. Semin. Hematol. 46, 351–357 (2009). - PMC - PubMed
    1. Nemeth E et al. IL-6 mediates hypoferremia of inflammation by inducing the synthesis of the iron regulatory hormone hepcidin. J. Clin. Investig. 113, 1271–1276 (2004). - PMC - PubMed
    1. Nemeth E et al. Hepcidin regulates cellular iron efflux by binding to ferroportin and inducing its internalization. Science 306, 2090–2093 (2004). - PubMed

LinkOut - more resources