. 2024 Oct;20(10):1305-1316.
doi: 10.1038/s41589-024-01613-5. Epub 2024 Apr 25.

Extensive protein pyrophosphorylation revealed in human cell lines

Affiliations

Extensive protein pyrophosphorylation revealed in human cell lines

Jeremy A M Morgan et al. Nat Chem Biol. 2024 Oct.

Abstract

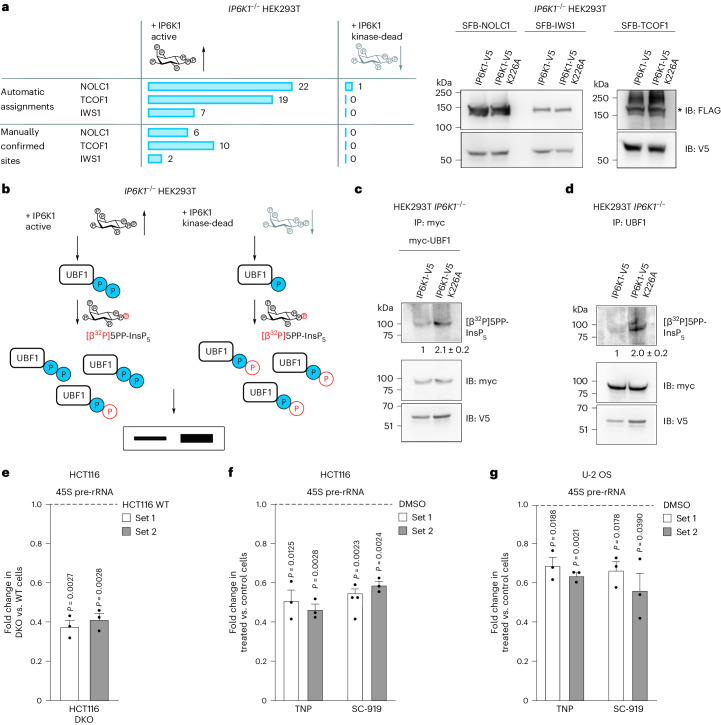
Reversible protein phosphorylation is a central signaling mechanism in eukaryotes. Although mass-spectrometry-based phosphoproteomics has become routine, identification of non-canonical phosphorylation has remained a challenge. Here we report a tailored workflow to detect and reliably assign protein pyrophosphorylation in two human cell lines, providing, to our knowledge, the first direct evidence of endogenous protein pyrophosphorylation. We manually validated 148 pyrophosphosites across 71 human proteins, the most heavily pyrophosphorylated of which were the nucleolar proteins NOLC1 and TCOF1. Detection was consistent with previous biochemical evidence relating the installation of the modification to inositol pyrophosphates (PP-InsPs). When the biosynthesis of PP-InsPs was perturbed, proteins expressed in this background exhibited no signs of pyrophosphorylation. Disruption of PP-InsP biosynthesis also significantly reduced rDNA transcription, potentially by lowering pyrophosphorylation on regulatory proteins NOLC1, TCOF1 and UBF1. Overall, protein pyrophosphorylation emerges as an archetype of non-canonical phosphorylation and should be considered in future phosphoproteomic analyses.


Conflict of interest statement

The authors declare no competing interests.

Figures

Fig. 1
Fig. 1. Enrichment and detection of pyrophosphorylated peptides using mass spectrometry.
a, Examples of protein phosphorylation on different amino acid side chains. Canonical phosphorylation sites include phosphoserine (pSer), whereas non-canonical sites are exemplified by phosphohistidine (3-pHis), phosphoarginine (pArg), phosphocysteine (pCys) and pyrophosphoserine (ppSer). b, Fragmentation via CID of a pyrophosphopeptide results in a characteristic neutral loss (−178 Da) compared to the corresponding bisphosphopeptide. c, Fragmentation of a pyrophosphopeptide using electron transfer dissociation combined with EThcD shows excellent sequence coverage while leaving the modification intact. d, Development of a sample preparation workflow, tailored to the enrichment and subsequent detection of tryptic pyrophosphopeptides.
Fig. 2
Fig. 2. Assignment and validation of endogenous pyrophosphorylation sites.
a, Workflow for the assignment of pyrophosphorylation sites after automated assignment with Proteome Discoverer. b, Comparison of EThcD spectra obtained from complex samples (top) with synthetically prepared pyrophosphopeptides (bottom). Fragment ions critical for the assignment of pyrophosphorylation sites are indicated in red (b-ion and c-ion series) or blue (y-ion and z-ion series). See detailed assignment in Supplementary Fig. 3. c, Venn diagram of the number of pyrophosphorylation sites detected by Proteome Discoverer in n = 3 biological replicates prepared from HEK293T cell lysates. d, Venn diagram of the number of pyrophosphorylation sites detected after manual assignment using n = 3 biological replicates from c. e, Overlap of pyrophosphorylation sites detected in HEK293T and HCT116 cells.
Fig. 3
Fig. 3. Properties of pyrophosphorylation sites.
a, Illustration of the localization of pyrophosphorylation sites to acidic regions in NOLC1 and TCOF1. The local isoelectric point (pI) was calculated using a custom R script. ppSer residues are shown in turquoise, and previously reported phosphorylation sites are indicated in gray (PhosphoSitePlus (ref. )). b, Consensus sequence of all pyrophosphorylation sites detected (left) and consensus sequence after removal of CK2 consensus sites (right). Sequence logos were generated using WebLogo (ref. ). c, Side chain of modification for all pyrophosphorylation sites. d, Kinase motifs surrounding the pyrophosphorylation sites. e, Analysis of order/disorder around pyrophosphorylation sites. f, Gene Ontology analysis of pyrophosphoproteins using Enrichr (Supplementary Table 4; https://maayanlab.cloud/Enrichr/). P values were obtained using Fisher’s exact test.
Fig. 4
Fig. 4. Nucleolar FC proteins undergo 5PP-InsP5-mediated pyrophosphorylation.
a, Architecture of the mammalian nucleolus and its subcompartments. b, Confocal micrographs representative of three independent experiments showing co-localization of IP6K1 (green) with nucleolar FC marker UBF1 (magenta) in HEK293T and U-2 OS cells. Nuclei were stained with DAPI (blue); scale bars, 5 μm. c, SIM images representative of three independent experiments showing IP6K1 (green) co-localized with UBF1 or the nucleolar DFC marker FBL (magenta) in U-2 OS cells. Nuclei were stained with DAPI (blue); scale bars, 2 μm. d, Magnification of the boxed region (c); scale bars, 0.2 μm. Traces show fluorescence intensity profiles for IP6K1 (green) and UBF1 or FBL (magenta), measured along the indicated white arrow. eh, In vitro pyrophosphorylation of human proteins by [β32P]5PP-InsP5. NOLC1, TCOF1, IWS1 and UBF1 (full-length and C-terminally deleted versions), with their indicated N-terminal tags, were expressed in HEK293T cells, isolated and prephosphorylated by CK2 before incubation with [β32P]5PP-InsP5. Representative images show autoradiography to detect pyrophosphorylation (right) and immunoblotting with respective tag-specific antibodies (left) (n = 4 (e), n = 5 (f), n = 4 (g) and n = 2 (h)). Negative controls were cells transfected with plasmids pCMV-myc (e,h), pCDNA-SFB (f) or EGFP-C1 (g). The asterisks in eh indicate specific bands. IB, immunoblot. Source data
Fig. 5
Fig. 5. 5PP-InsP5 drives cellular pyrophosphorylation and promotes rRNA synthesis.
a, Comparative MS analysis of pyrophosphosites detected in SFB-tagged NOLC1, TCOF1 or IWS1 co-expressed with V5-tagged active or kinase-dead IP6K1 (left). Number of pyrophosphopeptides assigned by automatic or manual analysis. An additional analysis, including the number of EThcD triggers, can be found in Supplementary Fig. 5. Immunoblot (IB) shows that equal amounts of protein were subjected to MS (right). Asterisk indicates the specific band (n = 1). b, Back-pyrophosphorylation method to detect intracellular UBF1 pyrophosphorylation. c,d, Overexpressed myc-tagged UBF1 (c) or endogenous UBF1 (d) was immunoprecipitated from IP6K1−/− HEK293T cells expressing either active or kinase-dead V5-tagged IP6K1 and incubated with [β32P]5PP-InsP5. Images show autoradiography to detect pyrophosphorylation (top) and immunoblotting with the indicated antibodies (bottom). IB with V5 antibody detects input levels of IP6K1. Numbers show mean fold change ± s.e.m. in the extent of UBF1 back-pyrophosphorylation in cells expressing kinase-dead compared to active IP6K1 (n = 3 (c) and n = 4 (d) independent experiments). eg, RT–qPCR analysis to measure 45S pre-rRNA transcript levels using two different primer sets. Values indicate the fold change in transcript levels in IP6K1−/−IP6K2−/− DKO cells compared to HCT116 WT cells (e) and TNP-treated or SC-919-treated HCT116 (f) or U-2 OS (g) cells compared to cells treated with the vehicle control (DMSO). Data are mean ± s.e.m. (n = 3 independent experiments). P values were determined using a two-tailed one-sample t-test. IP, immunoprecipitation. IB, immunoblotting. Source data
Extended Data Fig. 1
Extended Data Fig. 1. EThcD spectra of model peptides.
a) EThcD fragmentation spectrum of the pyrophosphopeptide from Fig. 1c. b) EThcD fragmentation spectrum of the corresponding bisphosphopeptide. N-terminal fragments are labeled in red, C-terminal fragments in blue. Arrows indicate the characteristic fragments, which enable a distinction between pyrophosphorylated and bisphosphorylated peptide species in spite of their equal MS1 mass.
Extended Data Fig. 2
Extended Data Fig. 2. Validation of workflow steps.
a) Pyrophosphopeptidepeptide stability to λ-phosphatase. Five synthetic pyrophosphopeptides and the corresponding monophosphopeptides were treated with the enzyme for 5 h. Data are presented as mean ± SD of four replicates. b) Showing retention of pyrophosphopeptides during SIMAC enrichment. Five synthetic pyrophosphopeptides were spiked into a background of HCT116 tryptic digest before or after enrichment and detected by LC-MS. Data are presented as mean ± SD of four replicates. c)-f) Improvement of LC-peak shape and reduction of Fe-adducts by citrate resuspension buffer (50 mM sodium citrate, 3% MeCN). c)/d) Proportion of Fe-adducts of synthetic pyrophosphopeptides (c) or monophosphopeptides (d) detected by LC-MS after sample resuspension in water vs. citrate buffer. Data are presented as mean ± SD of three replicates. e)/f) Representative total ion chromatograms (three replicates) of a synthetic pyrophosphopeptide in free or Fe3+-bound form after resuspension in water (e) or citrate buffer (f).
Extended Data Fig. 3
Extended Data Fig. 3. Fragmentation of pyrophospho- vs. bisphosphopeptides.
a)-c) EThcD spectra of an endogenous pyrophosphopeptide (CLK1, residues 323-343) (a) and the corresponding synthetic pyrophospho- (b) and bisphosphopeptides (c), highlighting the fragment ions essential for distinguishing the two modifications. d) Schematic demonstrating how a mixture of bisphosphopeptides may contain all fragments typical of the corresponding pyrophosphopeptide and lead to false-positive assignment of a pyrophosphopeptide.
Extended Data Fig. 4
Extended Data Fig. 4. Expression levels of pyrophosphoproteins.
iBAQ abundance scores of 8821 identified proteins from HEK293T cells (after removing decoys and contaminants) were plotted against their rank in the list of iBAQs. All identified pyrophosphoproteins from a HEK293T biological triplicate are highlighted in white boxes. UBF1, another substrate of pyrophosphorylation that was detected by radiolabeling, but not mass spectrometry, ranks among the more abundant proteins and is highlighted in grey.
Extended Data Fig. 5
Extended Data Fig. 5. Controls for pulldown experiments.
a) Representative immunoblots demonstrating the absence of IP6K1 in HEK293T IP6K1−/− knockout cell line (n = 4). b) Left: representative HPLC profiles of [3H]-inositol labeled HEK293T wild type cells, IP6K1−/− knockout cells, and IP6K1−/− knockout cells expressing V5-epitope tagged active or kinase-dead IP6K1. Soluble inositol phosphate counts were normalized to the total lipid inositol count for each sample. Peaks corresponding to InsP6 and 5PP-InsP5 are indicated. Right: Level of 5PP-InsP5 normalized to the total lipid inositol in the four cell lines from a (mean ± SEM, n = 3 independent experiments) analyzed using a two-tailed unpaired Student’s t test. c) Protein stability of active and kinase-dead IP6K1 expressed in IP6K1−/− HEK293T cells subjected to treatment with cycloheximide (100 µg/mL) to block protein synthesis for the indicated time. α-tubulin was used as a loading control. Graphs show the levels of IP6K1 at each time point, normalized to the untreated sample (mean ± SEM, n = 5 independent experiments). Loss of kinase activity did not alter the stability of IP6K1. d) Abundance of target proteins in pulldown samples. Comparison between samples from a background with high (IP6K1-kinase active, KA) or low (IP6K1-kinase dead, KD) PP-InsP levels. Source data
Extended Data Fig. 6
Extended Data Fig. 6. Pyrophosphoproteomics on HCT116 PPIP5K1/2−/− cells.
a) Overlap of manually validated pyrophosphorylation sites in wild type vs knockout cells. b) Overlap of modified proteins.

References

    1. Cohen, P. The origins of protein phosphorylation. Nat. Cell Biol.4, E127–E130 (2002). - PubMed
    1. Humphrey, S. J., James, D. E. & Mann, M. Protein phosphorylation: a major switch mechanism for metabolic regulation. Trends Endocrinol. Metab.26, 676–687 (2015). - PubMed
    1. Hunter, T. A journey from phosphotyrosine to phosphohistidine and beyond. Mol. Cell82, 2190–2200 (2022). - PMC - PubMed
    1. Manning, G., Whyte, D. B., Martinez, R., Hunter, T. & Sudarsanam, S. The protein kinase complement of the human genome. Science298, 1912–1934 (2002). - PubMed
    1. Alonso, A. et al. Protein tyrosine phosphatases in the human genome. Cell117, 699–711 (2004). - PubMed

Publication types

LinkOut - more resources