. 2024 Apr 25;24(1):335.
doi: 10.1186/s12870-024-05016-5.

Integrated metabolome and transcriptome analyses reveal the role of BoGSTF12 in anthocyanin accumulation in Chinese kale (Brassica oleracea var. alboglabra)

Affiliations

Integrated metabolome and transcriptome analyses reveal the role of BoGSTF12 in anthocyanin accumulation in Chinese kale (Brassica oleracea var. alboglabra)

Kang Tang et al. BMC Plant Biol. .

Abstract

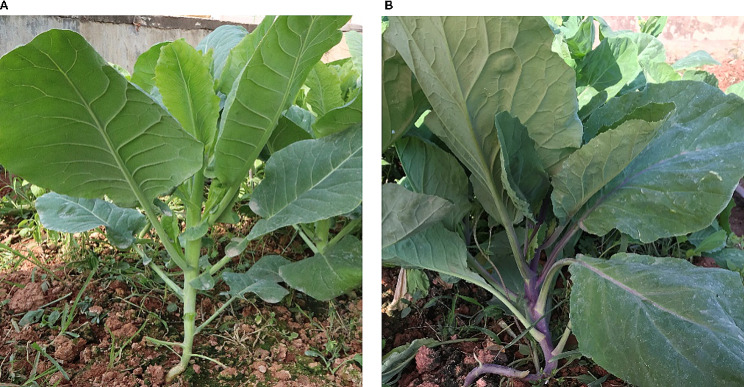
Background: The vivid red, purple, and blue hues that are observed in a variety of plant fruits, flowers, and leaves are produced by anthocyanins, which are naturally occurring pigments produced by a series of biochemical processes occurring inside the plant cells. The purple-stalked Chinese kale, a popular vegetable that contains anthocyanins, has many health benefits but needs to be investigated further to identify the genes involved in the anthocyanin biosynthesis and translocation in this vegetable.

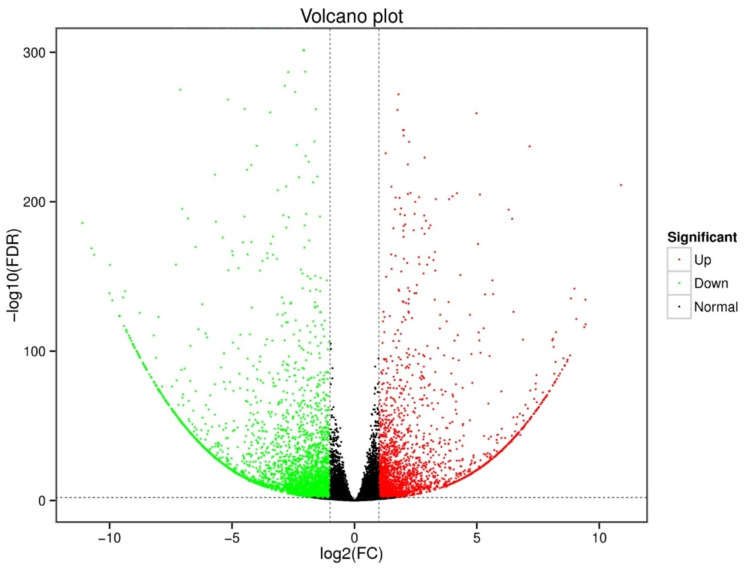
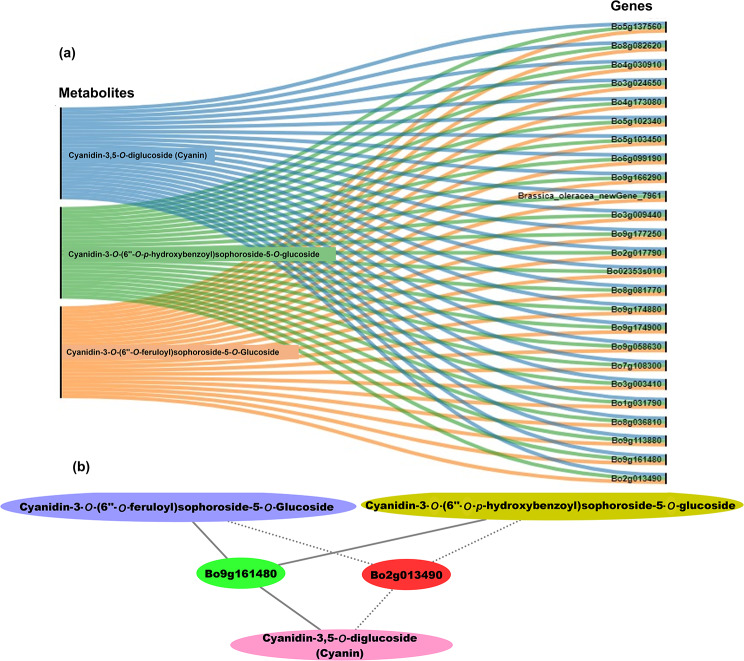
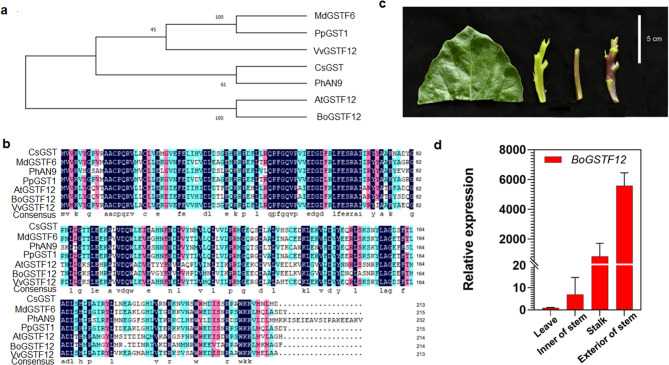
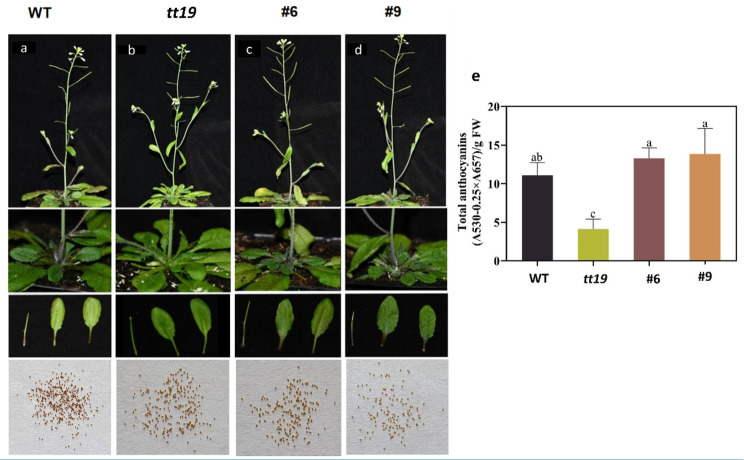
Results: In this study, the purple- and green-stalked Chinese kale were examined using integrative transcriptome and metabolome analyses. The content of anthocyanins such as cyanidin-3-O-(6″-O-feruloyl) sophoroside-5-O-glucoside, cyanidin-3,5-O-diglucoside (cyanin), and cyanidin-3-O-(6″-O-p-hydroxybenzoyl) sophoroside-5-O-glucoside were considerably higher in purple-stalked Chinese kale than in its green-stalked relative. RNA-seq analysis indicated that 23 important anthocyanin biosynthesis genes, including 3 PAL, 2 C4H, 3 4CL, 3 CHS, 1 CHI, 1 F3H, 2 FLS, 2 F3'H, 1 DFR, 3 ANS, and 2 UFGT, along with the transcription factor BoMYB114, were significantly differentially expressed between the purple- and green-stalked varieties. Results of analyzing the expression levels of 11 genes involved in anthocyanin production using qRT-PCR further supported our findings. Association analysis between genes and metabolites revealed a strong correlation between BoGSTF12 and anthocyanin. We overexpressed BoGSTF12 in Arabidopsis thaliana tt19, an anthocyanin transport mutant, and this rescued the anthocyanin-loss phenotype in the stem and rosette leaves, indicating BoGSTF12 encodes an anthocyanin transporter that affects the accumulation of anthocyanins.

Conclusion: This work represents a key step forward in our understanding of the molecular processes underlying anthocyanin production in Chinese kale. Our comprehensive metabolomic and transcriptome analyses provide important insights into the regulatory system that controls anthocyanin production and transport, while providing a foundation for further research to elucidate the physiological importance of the metabolites found in this nutritionally significant vegetable.

Keywords: Brassica oleracea; Anthocyanins; Metabolome; RNA-seq; qRT-PCR.


Conflict of interest statement

The authors declare no competing interests.

Figures

Fig. 1
Fig. 1
Comparison of two Chinese kale phenotypes. (a) Green-stalked Chinese kale and (b) purple-stalked Chinese kale. Photographs show seven -week- old plants grown in the field as described in Methods
Fig. 2
Fig. 2
Differential levels of anthocyanin metabolites in purple- vs. green-stalked Chinese kale. (a) Volcano plot demonstrating the statistical significance of the differences in metabolite levels in the two Chinese kale varieties. (b) Heatmap comparing metabolite contents in purple and green-stalked Chinese kale. Colors represent differential expression levels after normalization. The left side of the heatmap shows the metabolite classes as identified in the color key to the right. G1–G3 and R1–R3 represent the different samples. (c) Anthocyanins of differential metabolites in two types of Chinese kale
Fig. 3
Fig. 3
Volcano plot showing DEGs between purple- and green-stalked Chinese kale varieties
Fig. 4
Fig. 4
GO classification of DEGs between the two Chinese kale lines
Fig. 5
Fig. 5
KEGG enrichment pathways of DEGs between purple- and green-stalked Chinese kale. KEGG enrichment pathways of upregulated DEGs (a) and downregulated DEGs (b)
Fig. 6
Fig. 6
Analysis of the expression of genes involved in anthocyanin biosynthesis in Chinese kale. The illustration shows gene expression levels in the six cDNA libraries created from purple and green-stalked Chinese kale (red = higher expression) in the context of the anthocyanin biosynthesis process using structural genes showing variable expression
Fig. 7
Fig. 7
qRT-PCR verification of anthocyanin-related gene expression. Data, from left to right, are represented as relative expression and fragments per kilobase million (FPKM), respectively. Bars show means ± SD of biological replicates data
Fig. 8
Fig. 8
Connection network between core genes and anthocyanin metabolites. (a) Network showing relationships between 25 core genes and 3 anthocyanins. (b) Network for GSTF12 (Bo9g161480 and Bo2g013490) genes and three anthocyanins. Solid lines, stronger interaction; dotted lines, weaker interaction
Fig. 9
Fig. 9
Phylogenetic analysis and expression pattern of BoGSTF12 (a) Phylogenetic analysis, (b) multiple sequence alignment of GST genes in different species (c) phenotypic representation of anthocyanin content in Chinese kale (d), Relative expression of BoGSTF12 in different plant parts of purple-stalked Chinese kale. Scale bar in (c) = 5 cm
Fig. 10
Fig. 10
Overexpression of BoGSTF12 in the Arabidopsis tt19 mutant and measurements of total anthocyanins contents. (a) Phenotypes of wild-type (WT) Arabidopsis, (b) an Arabidopsis knockout mutant of the anthocyanin transporter AtGSTF12 (tt19), and (c, d) two transgenic lines of 35 S::BoGSTF12-FLAG in the tt19 background. (e) Total contents of anthocyanins as measured in the infiltration patches; data are means ± SD obtained from three biological replicates. The different letters denote significant differences according to one-way analysis of variance (ANOVA) (P < 0.05)

References

    1. Aires A. Brassica composition and food processing. Processing and Impact on active components in Food. Elsevier; 2015. pp. 17–25.
    1. Cartea ME, Francisco M, Soengas P, Velasco P. Phenolic compounds in Brassica vegetables. Molecules. 2010;16(1):251–80. doi: 10.3390/molecules16010251. - DOI - PMC - PubMed
    1. Ciska E, Martyniak-Przybyszewska B, Kozlowska H. Content of glucosinolates in cruciferous vegetables grown at the same site for two years under different climatic conditions. J Agric Food Chem. 2000;48(7):2862–7. doi: 10.1021/jf981373a. - DOI - PubMed
    1. Jahangir M, Kim HK, Choi YH, Verpoorte R. Health-affecting compounds in Brassicaceae. CRFSFS. 2009;8(2):31–43.
    1. Paiva SA, Russell RM. β-carotene and other carotenoids as antioxidants. JACN. 1999;18(5):426–33. - PubMed

LinkOut - more resources