. 2024 Apr 25;12(1):69.
doi: 10.1186/s40478-024-01778-z.

LINC complex alterations are a key feature of sporadic and familial ALS/FTD

Affiliations

LINC complex alterations are a key feature of sporadic and familial ALS/FTD

Riccardo Sirtori et al. Acta Neuropathol Commun. .

Abstract

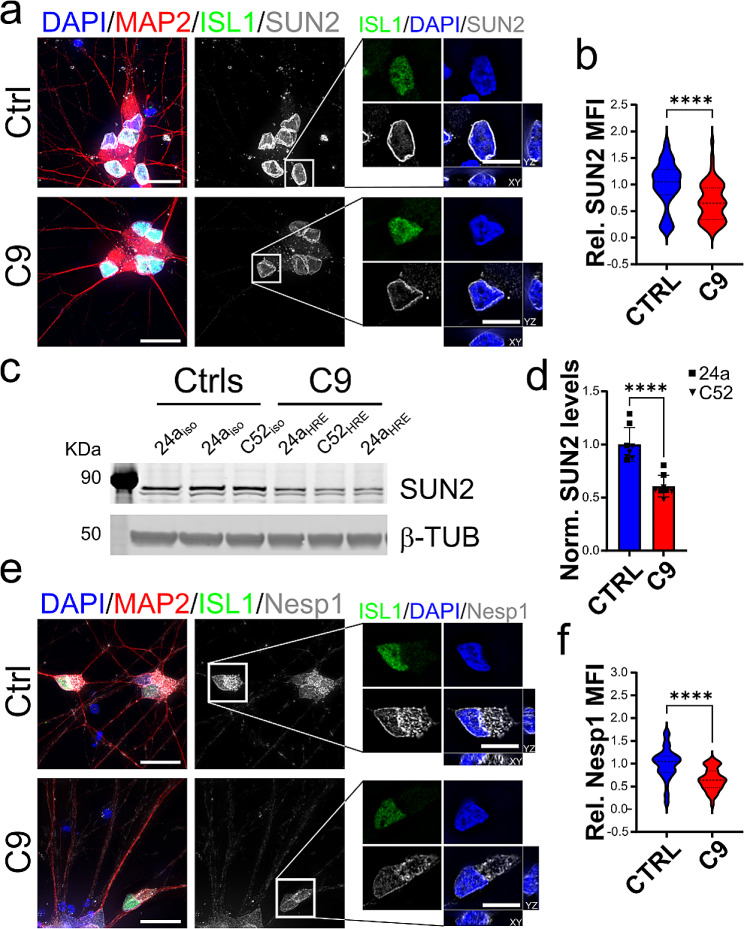
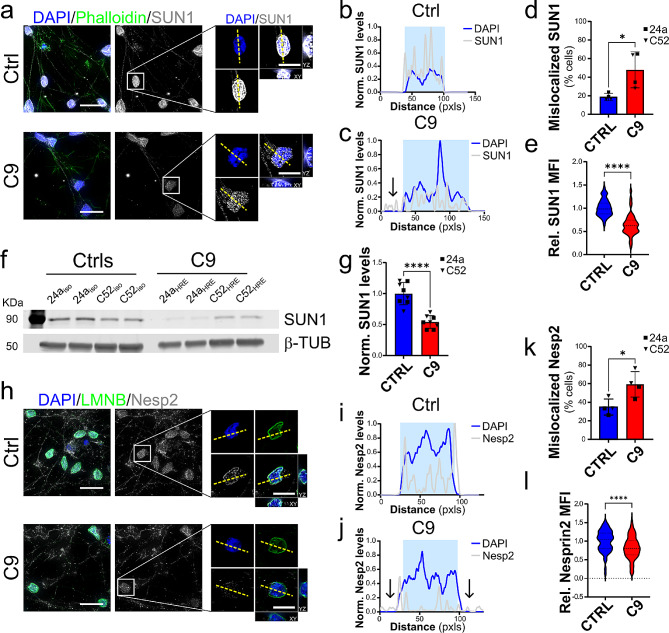
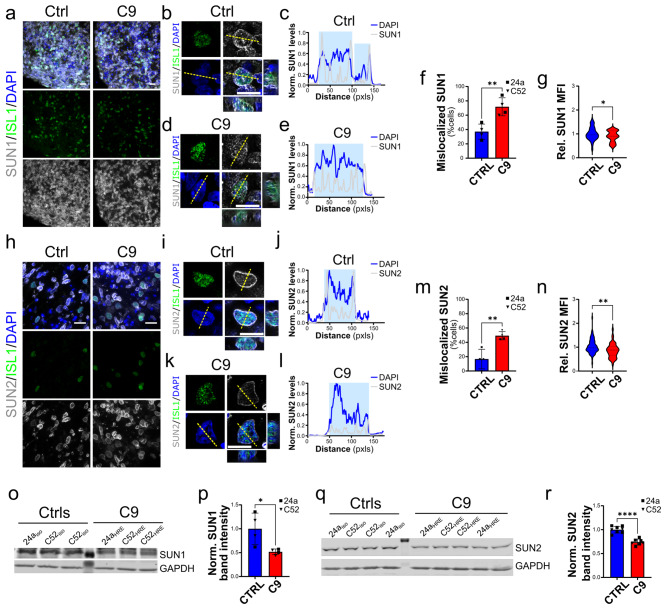
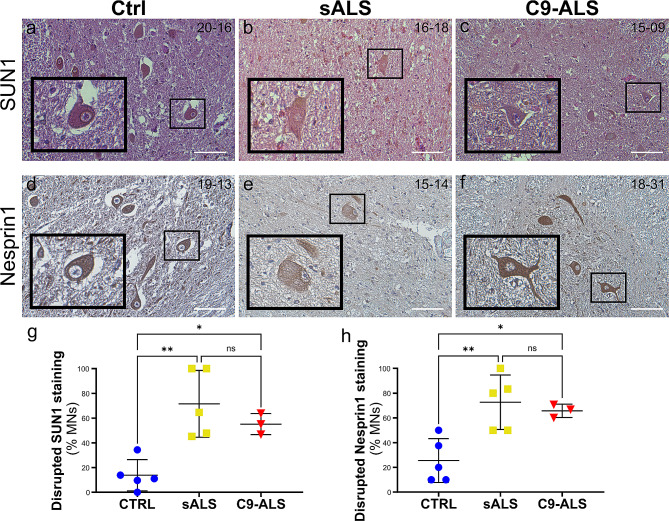
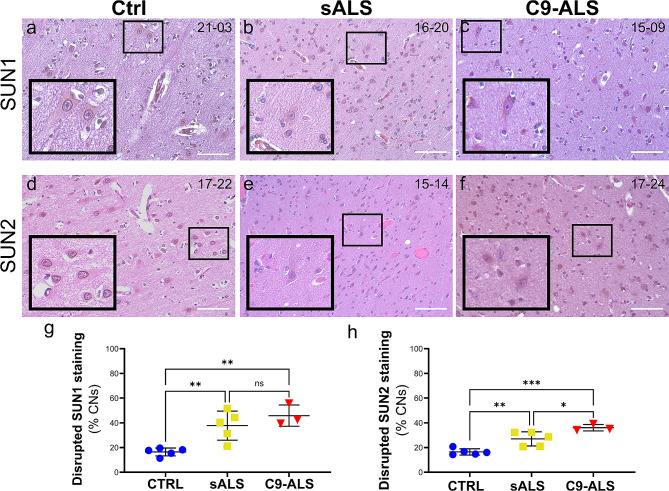
Amyotrophic lateral sclerosis (ALS) is a neurodegenerative disorder that primarily affects motor neurons, leading to progressive muscle weakness and loss of voluntary muscle control. While the exact cause of ALS is not fully understood, emerging research suggests that dysfunction of the nuclear envelope (NE) may contribute to disease pathogenesis and progression. The NE plays a role in ALS through several mechanisms, including nuclear pore defects, nucleocytoplasmic transport impairment, accumulation of mislocalized proteins, and nuclear morphology abnormalities. The LINC complex is the second biggest multi-protein complex in the NE and consists of the SUN1/2 proteins spanning the inner nuclear membrane and Nesprin proteins embedded in the outer membrane. The LINC complex, by interacting with both the nuclear lamina and the cytoskeleton, transmits mechanical forces to the nucleus regulating its morphology and functional homeostasis. In this study we show extensive alterations to the LINC complex in motor and cortical iPSC-derived neurons and spinal cord organoids carrying the ALS causative mutation in the C9ORF72 gene (C9). Importantly, we show that such alterations are present in vivo in a cohort of sporadic ALS and C9-ALS postmortem spinal cord and motor cortex specimens. We also found that LINC complex disruption strongly correlated with nuclear morphological alterations occurring in ALS neurons, independently of TDP43 mislocalization. Altogether, our data establish morphological and functional alterations to the LINC complex as important events in ALS pathogenic cascade, making this pathway a possible target for both biomarker and therapy development.

Keywords: ALS; C9ORF72; FTD; LINC complex; Nesprin; SUN.


Conflict of interest statement

The authors have no relevant financial or non-financial interests to disclose.

Figures

Fig. 1
Fig. 1
LINC complex disruption in C9 iPSCs-derived iMNs. Representative images of SUN2 (a, grays) and Nesprin1 (e, Nesp1, grays) expression in C9 and isogenic control (CTRL) iMNs. Nuclei were identified by DAPI staining (blue), while MAP2 (red) and ISL1 (green) were used as neuronal and motoneuronal markers. The white boxes indicate the neurons enlarged in the panels on the right. Scale bars: 20 μm in main panels, 10 μm in zoomed-in images. The relative quantification of the nuclear mean fluorescence intensity (MFI) for both SUN2 (b) and Nesprin1 (f) shows a significant reduction in the abundance of each protein in C9 iMNs compared to isogenic controls (Mann-Whitney t test, n = 57 and 52 for CTRL and C9-ALS neurons respectively from 4 independent differentiations for SUN2, n = 64 and 40 for CTRL and C9 neurons respectively from 4 independent differentiations for Nesprin1, **** p < 0.0001). c-d. Representative western blot (WB) and quantification of SUN2 levels relative to GAPDH expression shows a significative reduction of total SUN2 levels in both C9 isogenic lines (24a and C52) compared to isogenic counterparts (n = 8 independent experiments for both C9 and controls; Student’s t test, **** p < 0.0001). For all, bars are mean and SEM, while violin plots show the distribution of the data with dashed lines indicating median and quartiles
Fig. 2
Fig. 2
LINC complex disruption in C9-ALS i3CNs. a. Representative images of SUN1 (grays) in C9-ALS and control i3CNs. DAPI (blue) identified the nuclei, while Phalloidin (green) labeled the actin cytoskeleton. The white boxes indicate the neurons enlarged in the panels on the right. b-d. Plots of line profiles of SUN1 and DAPI intensities normalized to the max intensity in control cells. Mutant cells display frequent mislocalization of SUN1 to either the nucleoplasm or cytoplasm (arrows), quantified in d. The yellow dashed lines in a indicate the lines used for the profile plots (Mann-Whitney t test, n = 4, *p < 0.05). e. The quantification of the nuclear mean fluorescence intensity (MFI) of SUN1 in C9 i3CNs shows a significant reduction in its abundance relative to isogenic controls (Mann-Whitney t test, n = 46 CTRL and C9 neurons respectively from 4 independent differentiations, ****p < 0.0001). f-g. Representative western blot (WB) and quantification of SUN1 levels relative to Histone 3 (H3) expression shows a significative reduction of total SUN1 levels in C9 lines compared to isogenic counterparts (n = 8 independent experiments for both 24a and C52 iPSC isogenic pairs; Student’s t test, **** p < 0.0001). h. Representative images of Nesprin2 (Nesp2, grays) staining pattern in i3CNs from C9 and Ctrl iPSC lines. DAPI (blue) identified the nuclei, while LaminB (LMNB, green) labeled the nuclear lamina. The white boxes indicate the neurons enlarged in the panels on the right. i-k. Plots of line profiles of Nesprin2 and DAPI intensities normalized to the max intensity in control cells. Mutant cells display frequent mislocalization of Nesprin2 to either the nucleoplasm or cytoplasm (arrows), quantified in k. The yellow dashed lines in h indicate the lines used for the profile plots (Student’s t test, n = 4, *p < 0.05). l. The quantification of the Nesprin2 relative nuclear MFI shows a significant reduction in its abundance in C9 i3CNs compared to isogenic controls (Mann-Whitney t test, n = 31 and 38 for CTRL and C9 neurons from 4 independent differentiations, * p < 0.05). Scale bars: 20 μm in the main panels, 10 μm in zoomed-in images. For all, bars are mean and SEM, while violin plots show the distribution of the data with dashed lines indicating median and quartiles
Fig. 3
Fig. 3
SUN1 and SUN2 alterations in spinal organoid iMNs. Representative images of SUN1 (a, grays) and SUN2 (h, grays) staining in spinal organoids. Islet1 (ISL1, green) expression was used to identify iMNs, while DAPI (blue) labeled the nuclei. b-f. Representative images and line profiles of SUN1 distribution in iMNs from control (b-c) and C9 mutant (d-e) organoids show a disruption in its localization at the NE, which was more frequently observed in iMNs from mutant organoids (quantified in f; Student’s t test, n = 4, **p < 0.01). The yellow dashed lines in a indicate the lines used for the profile plots. g. Quantitative analysis of SUN1 nuclear levels shows a significant reduction in C9 organoids compared to isogenic control (Student’s t test, n = 71 and 31 from 4 independent experiments, *p < 0.05). i-m. Representative images and line profiles of SUN2 distribution in iMNs from control (i-j) and C9 mutant (k-l) organoids show a disruption in its localization at the NE, which was more frequently observed in iMNs from mutant organoids (quantified in m; Student’s t test, n = 4, **p < 0.01). n. Quantitative analysis of SUN2 nuclear levels shows a significant reduction in C9 organoids compared to isogenic control (Student’s t test, n = 71 and 47 from 4 independent experiments, **p < 0.01). o-r. Representative blots and quantification of SUN1 (o-p) and SUN2 (q-r) levels from whole lysates of spinal organoids from C9 and control iPSCs shows a significant reduction in their overall levels (Student’s t test, n = 4 in p, n = 7 and 8 in r, *p < 0.05, ****p < 0.0001). GAPDH was used as loading control. For all, bars are mean and SEM, while violin plots show the distribution of the data with dashed lines indicating median and quartiles. Scale bars: 20 μm in a and h, 10 μm in b, d, i, and k
Fig. 4
Fig. 4
LINC complex disruption in sALS and C9-ALS spinal cordpostmortem specimens. a-f. Spinal cord sections from control (a, d), sALS (b, e) and C9-ALS (c, f) patients were stained with antibodies specific for SUN1 (a-c) and Nesprin1 (d-f). Hematoxylin and eosin counterstains were used to identify the nucleus and cytoplasm, respectively. The black boxes identify the motor neurons enlarged in the insets. Scale bars: 100 μm. g-h. The frequency of disrupted NE staining for both SUN1 (g) and Nesprin1 (h) was quantified blindly in at least two sections from each patient’s tissue. A significant increase in the percentage of cells with disrupted staining was observed in both sALS and C9-ALS spinal cords compared to controls. Each dot represents the mean of at least two sections for each case, horizontal lines show mean and standard deviation (one-way ANOVA with Tukey post hoc test, n = 5, 5, and 3, *p < 0.05, **p < 0.01, ns = not significant)
Fig. 5
Fig. 5
Disruption of SUN proteins in sALS and C9-ALS brain postmortem specimens. a-f. Sections of the brain motor cortex from control (a, d), sALS (b, e) and C9-ALS (c, f) patients were stained with antibodies specific for SUN1 (a-c) and SUN2 (d-f). Hematoxylin and eosin counterstains were used to identify the nucleus and cytoplasm, respectively. The black boxes identify the neurons enlarged in the insets. Scale bars: 100 μm. g-h. The frequency of disrupted NE staining for both SUN1 (g) and SUN2 (h) was quantified blindly in at least two sections from each patient’s tissue. A significant increase in the percentage of cells with disrupted staining was observed in both sALS and C9-ALS spinal cords compared to controls. A significant higher frequency of disruption in C9-ALS neurons was detected for SUN2. A similar trend was observed for SUN1, but it did not reach statistical significance. Each dot represents the mean of at least two sections for each case, horizontal lines show mean and standard deviation (one-way ANOVA with Tukey post hoc test, n = 5, 5, and 3, *p < 0.05, **p < 0.01, ***p < 0.001, ns = not significant)
Fig. 6
Fig. 6
SUN1 is mislocalized in the cytoplasm in cortical neurons of sporadic and C9-ALS patients. Representative images of motor cortex sections from control (a, b), sALS (d, e) and C9-ALS (g, h) patients stained with antibodies specific for SUN1 (red) and MAP2 (grays). DAPI (blue) was used to label nuclei. White boxes in a, d, and g identify neurons enlarged in b, e, and h. Line profile plots show the marked difference of SUN1 distribution in sALS (f) and C9-ALS (i) cortical neurons compared to controls (c). The yellow dashed lines in a indicate the lines used for the profile plots. Scale bars: 20 μm in main panels, 10 μm in zoomed-in images
Fig. 7
Fig. 7
LINC complex disruption correlates with nuclear morphological alterations in ALS MNs. a. Representative images of spinal motor neurons from control (top), sALS (middle), and C9-ALS (bottom) with normal or abnormal SUN1 or SUN2 staining. The dashed yellow lines indicate the cells contour, white dots identify the nucleus, and yellow dots highlight the nucleolus. b-e. The quantification of the relative nuclear (b, d) and nucleolar (c, e) area in cells categorized based on the presence of a normal or abnormal SUN1 (b, c) or SUN2 (c, e) nuclear staining shows a significant correlation between LINC complex disruption and smaller nuclear and sub-nuclear structures (one-way ANOVA with Tukey post hoc test, n = 22, 47, and 15 in b and c, n = 15, 26, and 10 in d and e, *p < 0.05, **p < 0.01, ****p < 0.0001, ns = not significant)
Fig. 8
Fig. 8
SUN1 nuclear loss is a main contributor to cellular morphological alterations. (a) Representative images of cortical neurons categorized based on the presence of nuclear (Nuc.) or cytoplasmic (cyto.) TDP-43 (green) and normal (Norm.) or abnormal (Abn.) SUN1 staining (red). MAP2 (grays) was used as a neuronal marker, while DAPI (blue) labeled the cell nucleus. Scale bar: 10 μm. (b) Quantification of the relative nuclear to cytoplasmic area shows that neurons with abnormal SUN1 distribution have significantly smaller nuclei compared to all other groups (one-way ANOVA with Tuckey post hoc test, n = 22, 21,29, 20, ****p < 0.0001). (c) Quantification of the absolute nuclear area of cortical neurons shows that all ALS neurons have smaller nuclei compared to healthy controls. However, loss of SUN1 from the NE (categorized as abnormal) further impacts nuclear size, regardless of TDP-43 localization (one-way ANOVA with Tuckey post hoc test, n = 22, 21,31, 22, *p < 0.05, **p < 0.01, ****p < 0.0001)

Update of

References

    1. Goutman SA, et al. Recent advances in the diagnosis and prognosis of amyotrophic lateral sclerosis. Lancet Neurol. 2022;21:480–493. doi: 10.1016/S1474-4422(21)00465-8. - DOI - PMC - PubMed
    1. DeJesus-Hernandez M, et al. Expanded GGGGCC hexanucleotide repeat in Noncoding Region of C9ORF72 causes chromosome 9p-Linked FTD and ALS. Neuron. 2011 doi: 10.1016/j.neuron.2011.09.011. - DOI - PMC - PubMed
    1. Umoh ME, et al. Comparative analysis of C9orf72 and sporadic disease in an ALS clinic population. Neurology. 2016;87:1024–1030. doi: 10.1212/WNL.0000000000003067. - DOI - PMC - PubMed
    1. Arai T, et al. TDP-43 is a component of ubiquitin-positive tau-negative inclusions in frontotemporal lobar degeneration and amyotrophic lateral sclerosis. Biochem Biophys Res Commun. 2006;351:602–611. doi: 10.1016/j.bbrc.2006.10.093. - DOI - PubMed
    1. J.C., G. et al. The nuclear pore complex is compromised in ALS. Amyotroph Lateral Scler Front Degener (2016)

Publication types

MeSH terms

Supplementary concepts