. 2024 Apr;62(2):e23596.
doi: 10.1002/dvg.23596.

Following the p63/Keratin5 basal cells in the sensory and non-sensory epithelia of the vomeronasal organ

Affiliations

Following the p63/Keratin5 basal cells in the sensory and non-sensory epithelia of the vomeronasal organ

Noah M LeFever et al. Genesis. 2024 Apr.

Abstract

The vomeronasal organ (VNO) is a part of the accessory olfactory system, which detects pheromones and chemical factors that trigger a spectrum of sexual and social behaviors. The vomeronasal epithelium (VNE) shares several features with the epithelium of the main olfactory epithelium (MOE). However, it is a distinct neuroepithelium populated by chemosensory neurons that differ from the olfactory sensory neurons in cellular structure, receptor expression, and connectivity. The vomeronasal organ of rodents comprises a sensory epithelium (SE) and a thin non-sensory epithelium (NSE) that morphologically resembles the respiratory epithelium. Sox2-positive cells have been previously identified as the stem cell population that gives rise to neuronal progenitors in MOE and VNE. In addition, the MOE also comprises p63 positive horizontal basal cells, a second pool of quiescent stem cells that become active in response to injury. Immunolabeling against the transcription factor p63, Keratin-5 (Krt5), Krt14, NrCAM, and Krt5Cre tracing experiments highlighted the existence of horizontal basal cells distributed along the basal lamina of SE of the VNO. Single cell sequencing and genetic lineage tracing suggest that the vomeronasal horizontal basal cells arise from basal progenitors at the boundary between the SE and NSE proximal to the marginal zones. Moreover, our experiments revealed that the NSE of rodents is, like the respiratory epithelium, a stratified epithelium where the p63/Krt5+ basal progenitor cells self-replicate and give rise to the apical columnar cells facing the lumen of the VNO.

Keywords: Keratin5; basal progenitors; horizontal basal cells; non‐sensory epithelium; p63; stem cells; vomeronasal organ.


Figures

Figure 1:
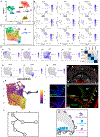
Figure 1:. P63, Krt5 and Krt14 are expressed in the non-sensory epithelium of the VNO and by HBCs
A). ΔNp63 immunoreactivity (Ni-DAB dark gray; black arrows) in basal most ((b) Black arrow)) cells in the non-sensory epithelium (NSE). Apical cells of the NSE do not express ΔNp63 ((a) white arrow)). ΔNp63 is also expressed by vHBCs (black arrow) along the basal lamina of the Vomeronasal sensory epithelium (VSE). B) Immunofluorescence anti-ΔNp63 (magenta) and Krt5 (green) shows the co-expression of both markers in the basal most cells of NSE ((b) white arrows). Empty arrows (a) indicate apical cells in the NSE negative for the staining. K5 and ΔNp63 are co-expressed in vHBCs along the basal lamina of the sensory epithelium of the VNO ((vHBCs) white arrow). C) Immunofluorescence anti-ΔNp63 (magenta) and Krt14 (green) shows the co-expression of both markers (white arrows) in NSE and in the vHBCs. The empty arrow (a) represents cells negative for staining. D) Immunofluorescence anti-Col IV (green) and Krt5 (magenta) shows the vHBCs (white arrows) touching the basal lamina (BL) (empty arrowheads) of the SE. The asterisk indicates a blood vessel. E) Cartoon summarizing protein expression in the different vomeronasal cells populations. F) ΔNp63 (green) and Sox2 (magenta) shows Sox2 and ΔNp63 co-expression in the basal cells of the NSE and in the vHBCs (white arrows). Sox2 expression was also found in the apical cells of the NSE and in the sustentacular cells (Sus) of the VSE. The globose basal cells (GBCs) are negative for ΔNp63. G) Hopx (magenta) highlights apical columnar cells of the NSE in apical (a) portion of the NSE. The Hopx cells are negative for ΔNp63 (green). Hopx expression abruptly ends as the apical cells arrive proximal to the marginal zone (black arrow). No Hopx was found in the ΔNp63+ basal cells of the NSE (a) nor in the vHBCs (b). H) Cartoon illustrating the change is shape of the basal cells from cuboidal in the NSE to fusiform along the SE.
Figure 2:
Figure 2:. Dynamic expression of ΔNp63 from rostral to caudal VNO in early embryonic stages.
A) At E12.5 ΔNp63 expression is visible in the developing skin (Skn), respiratory epithelia (RE), oral epithelium (OE), and epithelium of the tongue (Tng E). B) Cartoon of a coronal section of the VNO, sensory epithelium (SE), and non-sensory epithelium (NSE). C) Expression of ΔNp63 (Arrows) from rostral to caudal coronal sections of the VNO at E13.5 stage. ΔNp63 expression is mostly limited to cells in the rostral sections. D) ΔNp63 immunoreactivity from rostral to caudal coronal sections at E15.5 stage. Arrows show the ΔNp63 expression in all sections of the VNO. Rostral sections show ΔNp63+ cells in both sensory and non-sensory epithelia while caudal sections show ΔNp63 limited to the NSE.
Fig. 3:
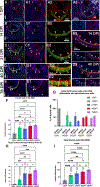
Fig. 3:. Quantification of the expansion of Krt 5, and ΔNp63 in the VNO.
A-D) Quantification of ΔNp63+ cells in the central and lateral regions of the NSE. Images from P0 to P30 show cells in the central (red arrows) and lateral regions of the NSE (grey arrows). A progressive expansion of ΔNp63 immunoreactivity is visible along the basal lamina of the SE (dark arrows). A’-D’) Keratin 5 expression and quantifications in the central regions of the NSE (red arrows) and lateral regions of the NSE (gray arrows). E) Increase in ΔNp63 + cells in the SE from P0 to P30. F) Increase in Krt5+ cells in the SE form P0 to P30. H, I) Increase of ΔNp63 + and Krt5 cells in the NSE from P0 to P30. Values +/− STDEV; ANOVA followed by Tukey’s multiple comparisons test (*P <0.05). (**P<0.005). (***P<0.0005). G) Cartoon of a coronal section of the VNO depicting the quantification regions and expansion of ΔNp63 /Krt5 reactivity.
Figure 4:
Figure 4:. scRNA-seq identified NSE connection to VNO.
A) Merged data from VNOs collected at P10, P21, P60. The UMAP dimensional reduction plot of the Seurat object reveals cluster including distinct cell types. Each colored cluster represents an identified cell type groups with similar transcriptomic profile: non-sensory epithelium (NSE), putative Proliferative Basal Cells (pPBCs), Sustentacular cells (Sus), Globose Basal cells (GBCs), Immature vomeronasal sensory neurons (iVSNs), apical VSNs (aVSNs), basal VSNs (bVSNs), and non-determined (ND). B) Feature plots showing the differential expression of Sox2, Ascl1, Neurod1, Mki67, Tfap2e, Meis2, Trp63, Krt5, and Hopx reveal the VSN dichotomy and putative NSE. C) The UMAP dimensional reduction plot illustrates the putative NSE supercluster containing smaller clusters highlighted by different numbers and colors. D) Feature plots depict the differential expression of Hopx, Krt5, Krt14, Trp63, NrCAM, Cxcl14, and Mki67 across the clusters of the putative NSE. Hopx+ cells (Cluster 3 and 4) are mostly negative for Krt5, Krt14, Trp63. D5) A correlation plot shows a negative correlation between Hopx expression and Krt5, Krt14, and Trp63 in the NSE. D1) Hopx expression is enriched in clusters 3 and 4 (compare to 4C), while D6 and D7 illustrate the enrichment of horizontal basal cell markers NrCAM and Cxcl14 in cluster 5. D8) The proliferative marker Mki67 is enriched in cluster 6 (compare to 4C) and but absent in the putative vHBCs (cluster 5). E) NrCAM immunoreactivity is restricted to the vHBCs (white arrowheads). Absence of NrCAM can be seen in the NSE (empty arrowheads). F) Pseudotime reconstruction suggests state transition trajectories (black line) starting from proliferative cells (purple). Purple indicates higher correlation to the predicted starting point, while yellow indicates a farther/later transcriptional state. G) Krt5 (red), NrCAM (green) double immunostaining shows the expression of the vHBC marker NrCAM in Krt5+ cells (solid arrowheads, along the SE), forming in a continuum with Krt5+ basal progenitors (empty arrowheads) in the NSE and lining the marginal zone (MGZ). H) A cartoon model proposing self-replication and differentiation of the p63/Krt5 basal progenitors into columnar cells of the NSE and HBCs along the SE. I) A simplified pseudo-time representation suggests that Hopx+ cells (cluster #3, and #4, compare to Fig. 4C) and NrCAM, Cxcl14+ cells (cluster #5, Fig. 4C, D6) arise from divergent trajectories starting from a pool of proliferative basal progenitors.
Figure 5:
Figure 5:. Proliferation of Krt5/p63 basal cells of the NSE.
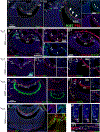
A) At P21, ΔNp63 and Ki67 immunohistochemistry shows basal mitotic cells in the NSE positive for ΔNp63 (white arrowheads). The proliferative GBCs (empty arrows) in the marginal zones (MZ) are negative for ΔNp63. A1) The vHBCs along the basal lamina of the SE are not expressing Ki67 (empty arrows), therefore are non-proliferative. B) VNO of Krt5CreERT2/R26tdTomato at P7(1 DPI) shows Krt5Cre recombination (tdTomato) limited to the basal cells of the NSE and marginal zones (MZ). Ki67 (Green) is expressed by basal traced cells (white arrowheads). The proliferative GBCs (empty arrows) in the marginal zones (MZ) are negative for Krt5 tracing. B1) Recombination is visible (red cells) in the NSE and at marginal zone (white arrowheads) but no immunoreactivity for NrCAM. C) P27 (21 DPI), Ki67 is limited to the basal traced cells in NSE (white arrows). The GBCs (empty arrows) in the MZ are negative for Krt5 tracing. C1) Magnification of the marginal zone, the tdTomato+ vHBCs (red cells) along the basal lamina of the SE are negative for Ki67 (green, empty arrowheads). C2) The cells positive for the tracing at the marginal zone (white arrowheads) form a continuum with differentiated NrCAM+ traced cells (empty arrowheads). D) At P46 (40 DPI) Krt5 tracing is visible the NSE (white arrowheads) and in the HBCs along the basal lamina of the SE (arrowheads). However, Sox2+ GBCs and Sustentacular cells (Sus) appear negative for the tracing (empty arrows). D1) The vHBCs are positive for NrCAM (empty arrowheads) while the basal progenitors at the marginal zone remain negative (white arrowheads). E) Immunostaining against Ki67 (green) and tdTomato (red) at 78 DPI shows that the proliferative GBCs (Empty arrowheads) in the marginal zones (MZ) negative for the tracing. F) At 1DP1 (P7), traced basal progenitors of the respiratory epithelium (RE, white arrowheads) are negative for NrCAM, while traced HBCs in the main olfactory epithelium (MOE) express NrCAM (empty arrowhead). The white dotted line indicated the end of the RE and the beginning of the olfactory epithelium (OE) F1) At 21DPI, Keratin 5 tracing (red) is observed in the cells of the RE (white arrowhead) and in NrCAM+ HBCs along the OE (empty arrowhead).
Figure 6:
Figure 6:. The basal cells of the NSE give rise to the columnar cells.
A-E2) Krt5 tracing at 1DPI, 14DPI, 21DPI, 40DPI, and 78DPI. A-A2) At 1 DPI the basal traced cells (empty arrowheads) are negative for Hopx. B-B2) At 14 DPI, traced cells differentiate into Hopx+ cells (white arrowheads) A3-D3) Traced cells in the basal regions (empty arrowheads) of the NSE are positive for Krt5, while traced cells in the apical region appear negative (white arrowheads). D3) At 40DPI virtually all the basal Krt5+ cells derive from the traced progenitors. Asterisks indicate various auto-fluorescent debris. F) Increase in the number of traced cells of the NSE between 1 and 78 DPI. G) Changes in the distribution of traced cells between basal and apical regions of the NSE. H) Increase in traced cell numbers along the basal lamina of the SE. I) Increase in total traced cell numbers along the basal lamina of the SE and within the NSE. Values +/− SD, ANOVA followed by posthoc Tukey’s multiple comparisons test (*P <0.05), (**P<0.005), (***P<0.0005).

References

    1. Beites CL, Kawauchi S, Calof AL. 2009. Olfactory Neuron Patterning and Specification. Dev Neurobiol 7: 145–156. - PMC - PubMed
    1. Belluscio L, Koentges G, Axel R, Dulac C. 1999. A map of pheromone receptor activation in the mammalian brain. Cell 97: 209–220. - PubMed
    1. Berghard A, Buck LB. 1996. Sensory transduction in vomeronasal neurons: evidence for G alpha o, G alpha i2, and adenylyl cyclase II as major components of a pheromone signaling cascade. J Neurosci 16: 909–918. - PMC - PubMed
    1. Brann JH, Firestein S. 2010. Regeneration of new neurons is preserved in aged vomeronasal epithelia. J Neurosci 30: 15686–15694. - PMC - PubMed
    1. Buck L, Axel R. 1991. A novel multigene family may encode odorant receptors: a molecular basis for odor recognition. Cell 65: 175–187. - PubMed

Publication types