. 2023;4(1):23.
doi: 10.1038/s43247-023-00685-w. Epub 2023 Feb 3.

Projected decrease in trail access in the Arctic

Collaborators, Affiliations

Projected decrease in trail access in the Arctic

J D Ford et al. Commun Earth Environ. 2023.

Abstract

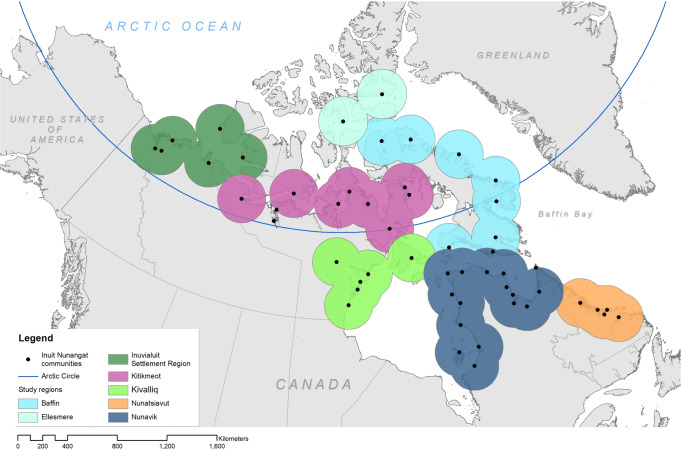
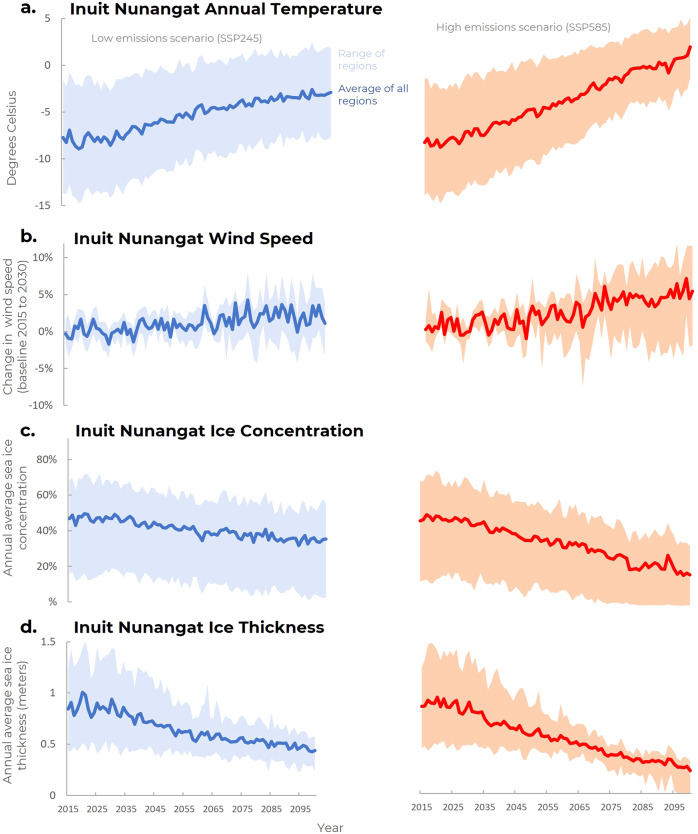
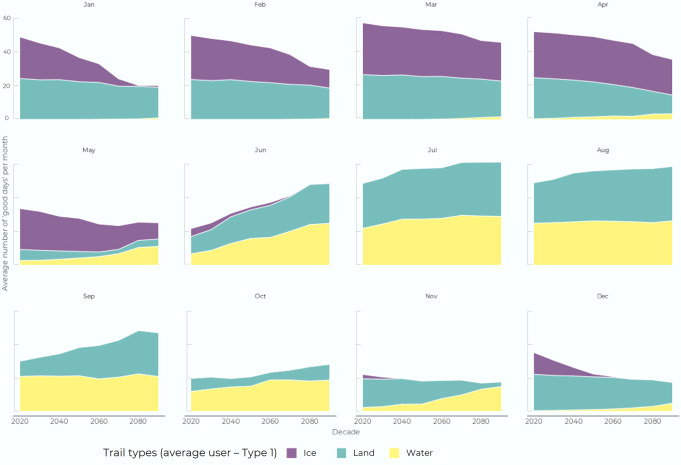
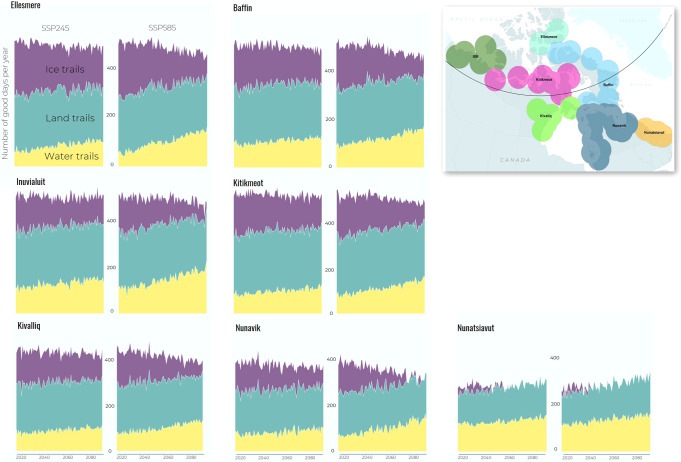
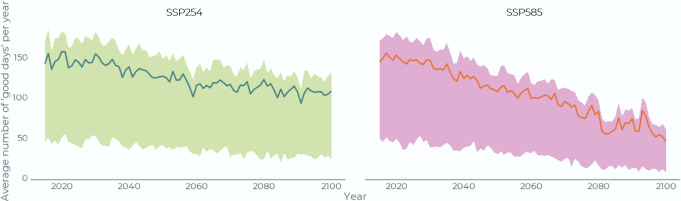
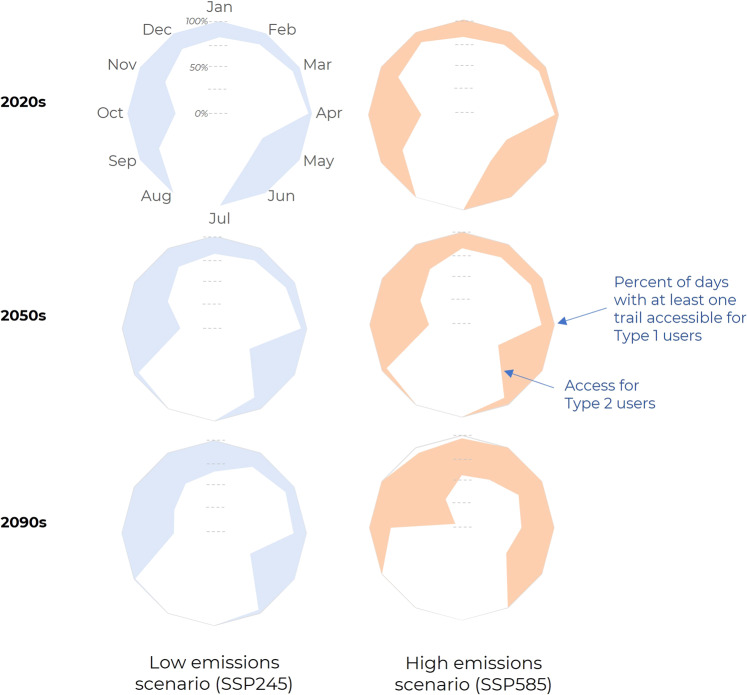
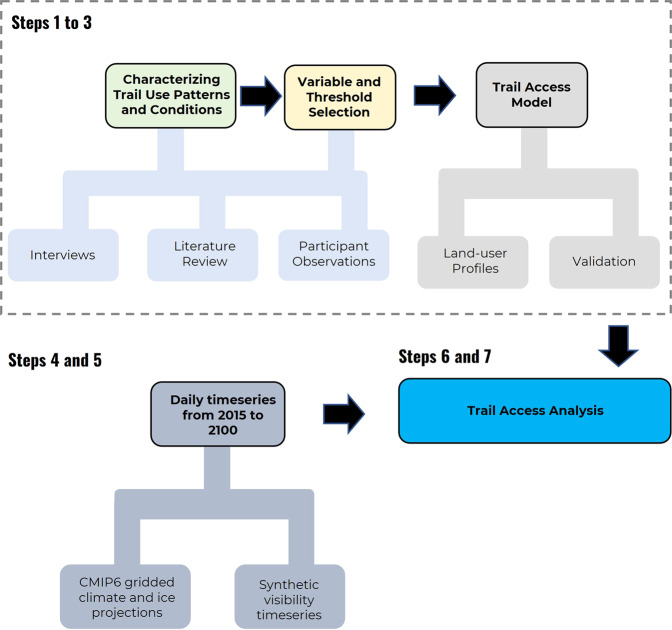
Transportation systems in northern Canada are highly sensitive to climate change. We project how access to semi-permanent trails on land, water, and sea ice might change this century in Inuit Nunangat (the Inuit homeland in northern Canada), using CMIP6 projections coupled with trail access models developed with community members. Overall trail access is projected to diminish, with large declines in access for sea ice trails which play a central role for Inuit livelihoods and culture; limits to adaptation in southern regions of Inuit Nunangat within the next 40 years; a lengthening of the period when no trails are accessible; and an unequal distribution of impacts according to the knowledge, skills, equipment, and risk tolerance of trail users. There are opportunities for adaptation through efforts to develop skillsets and confidence in travelling in more marginal environmental conditions, which can considerably extend the envelope of days when trails are accessible and months when this is possible. Such actions could reduce impacts across emissions scenarios but their potential effectiveness declines at higher levels of global warming, and in southern regions only delays when sea ice trails become unusable.

Keywords: Climate-change adaptation; Environmental studies.


Conflict of interest statement

Competing interestsThe authors declare no competing interests.

Figures

Fig. 1
Fig. 1. Inuit Nunangat (the Inuit homeland).
The region is home to approximately 56,000 people, inhabiting 53 mostly coastal communities. We examine trail access trends across 7 geographic regions, aggregating from analyses focusing on projected climatic and ice trends within a 100 km (climate) to 150 km (ice) radius of each community. The 150 km radius ice areas are shown here.
Fig. 2
Fig. 2. Projections of changes in climate (100 km radius) and sea ice (150 km radius) conditions around Inuit Nunangat’s 53 communities.
Projections use the ensemble mean of the five study GCMs for SSP245 (left) and SSP585 (right), and are for year 2015 to 2100. The area range captures the variability across communities in Inuit Nunangat, while the solid line reflects the mean for all areas around communities. a average annual temperature; b percent change in average annual windspeed based on the 2015–2030 average; c annual average sea ice concentration; d annual average sea ice thickness.
Fig. 3
Fig. 3. Monthly number of ‘good days’ when a trail is usable.
This is modeled for Type 1 (average) trail users for all trail types for SSP585 and averaged across all communities (decadal averages; e.g. “2020” is year 2020 to 2029).
Fig. 4
Fig. 4. Regional trends in projected trail access.
Calculated for SSP245 and SSP585 emissions scenarios for type 1 trail user by region, 2015–2100 (circles around communities capture area covered by projections).
Fig. 5
Fig. 5. Annual number of good sea ice trail days.
Modeled for Type 1, 2, and 3 users, averaged across all communities for 2015–2100 for SSP245 and 585 (Type 1 users is the central line, type 2 is the lower line, type 3 the higher line).
Fig. 6
Fig. 6. Monthly percentage of good days for Type 1 and Type 2 users for select decades under a high and a low emission scenario.
There is potential for adaptation to improve trail access under high and low emissions scenarios by giving Type 2 users (low-risk tolerance) the competence and confidence of Type 1 users (average).
Fig. 7
Fig. 7. Annual number of good sea ice trail days.
Modeled for Type 1, 2, and 3 users for SSP245 and SSP585, averaged across Nunavik communities for 2015–2100, showing adaptation limits for SSP585 (Type 1 users is the central line, type 2 is the lower line, type 3 the higher line).
Fig. 8
Fig. 8. Steps used in the modelling framework.
The framework is composed of 7 steps, beginning by identifying and characterising climatic conditions that matter for trail access.

References

    1. Meredith, M. M. et al. Polar Regions. In: Special Report on the Ocean and Cryosphere in a Changing Climate (eds. Pörtner, H.-O., et al.), (IPCC, 2019).
    1. Ehrich D, Thuestad AE, Tommervik H, Fauchald P, Hausner VH. Local land use associated with socio-economic development in six arctic regions. Ambio. 2019;48:649–660. doi: 10.1007/s13280-018-1095-y. - DOI - PMC - PubMed
    1. Ford, J., Pearce, T., Canosa, I. & Harper, S. The rapidly changing Arctic and its societal implications. WIREs Clim. Change, 12 e735 (2021).
    1. Lebel L, et al. Climate change and Indigenous mental health in the Circumpolar North: A systematic review to inform clinical practice. Transcult. Psychiatry. 2022;59:312–336. doi: 10.1177/13634615211066698. - DOI - PMC - PubMed
    1. Knoll LB, et al. Consequences of lake and river ice loss on cultural ecosystem services. Limnol. Oceanogr. Lett. 2019;4:119–131. doi: 10.1002/lol2.10116. - DOI

LinkOut - more resources