. 2023;6(1):53.
doi: 10.1038/s42005-023-01157-5. Epub 2023 Mar 23.

Frequency chirped Fourier-Transform spectroscopy

Affiliations

Frequency chirped Fourier-Transform spectroscopy

Sergej Markmann et al. Commun Phys. 2023.

Abstract

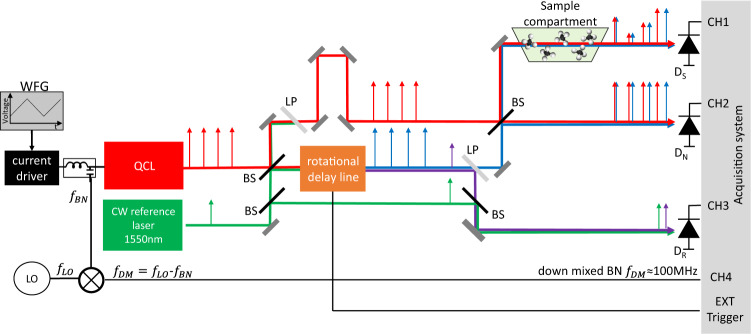
Fast (sub-second) spectroscopy with high spectral resolution is of vital importance for revealing quantum chemistry kinetics of complex chemical and biological reactions. Fourier transform (FT) spectrometers can achieve high spectral resolution and operate at hundreds of ms time scales in rapid-scan mode. However, the linear translation of a scanning mirror imposes stringent time-resolution limitations to these systems, which makes simultaneous high spectral and temporal resolution very difficult. Here, we demonstrate an FT spectrometer whose operational principle is based on continuous rotational motion of the scanning mirror, effectively decoupling the spectral resolution from the temporal one. Furthermore, we show that such rotational FT spectrometer can perform Mid-IR dual-comb spectroscopy with a single comb source, since the Doppler-shifted version of the comb serves as the second comb. In our realization, we combine the advantages of dual-comb and FT spectroscopy using a single quantum cascade laser frequency comb emitting at 8.2 μm as a light source. Our technique does not require any diffractive or dispersive optical elements and hence preserve the Jacquinot's-, Fellgett's-, and Connes'-advantages of FT spectrometers. By integrating mulitple broadband sources, such system could pave the way for applications where high speed, large optical bandwidth, and high spectral resolution are desired.

Keywords: Optical materials and structures; Optical spectroscopy.


Conflict of interest statement

Competing interestsThe authors declare no competing interests.

Figures

Fig. 1
Fig. 1. Block scheme of the rotational FT spectrometer with a Quantum Cascade Laser.
A CW reference laser which is used to provide a frequency reference and serves also as a tool for mapping out and removing the induced frequency chirp imposed by the nonlinear rotational delay line. QCL and CW laser beam are spatially superimposed via a beam splitter (BS) and also separated via the optical low-pass filter (LP). Interferograms of the QCL are acquired with the sample (DS) and normalization (DN) detector, where the reference interferogram of the CW laser is recorded with detector DR. All measurements are synchronized with the trigger from the rotational delay line. The function generator (FWG) can be used for continuously tuning of the QCL operation point by applying a ramp to the current driver of the QCL. The inter-modal beat note signal can be extracted directly from the waveguide via bias-tee and the down-mixed version of it fDM can be recorded with the help of the local oscillator LO.
Fig. 2
Fig. 2. Rotational delay line.
a Realization of the rotational delay line (RDL) consisting out of three-dimensional rotational retro-reflecting (RR) octagrammic prism and a static retro-reflecting system (SR). The SR is arrange in such a way with respect to RR, that multiple reflections between SR and RR are possible. By exploiting the point symmetry of the system, the optical path delay can be doubled with two SR on opposite sides of the RR. b, c Top view of a beam propagation in the RDL at rotation angle 0 and α. d Recorded interferogram on each rotational retro-reflector of delay line.
Fig. 3
Fig. 3. Operational principle of the rotational spectrometer.
a Induced nonlinear optical path length difference ΔL by rotational delay line as a function of rotation angle α. The maximal achievable path length difference depends on the entry point of the light beam along the x-axis (Fig. 2b, c). The orientation of the rotational delay line with respect to the incoming beam is shown for the selected point. b Interferogram time slices of the continuous wave (CW) reference laser on detector DR. c Spectrogram of CW reference laser which shows almost linear induced frequency chirp by rotational delay line. d Illustration of induced frequency chirp to a frequency comb. Three different color coded time points of comb spectrum, which corresponds to the same color-coded points on the curve in a. e Recorded quantum cascade laser (QCL) interferogram on one of eight retro-reflectors of the octogram. Increasing frequency chirp is clearly visible with increasing time. f Resampled QCL inteferogram of e on zero crossings of a CW reference laser from b with a coherently co-added 20 consecutive interferograms.
Fig. 4
Fig. 4. Amplitude noise investigation.
a QCL comb spectrum on which Allan deviation is performed. Red arrow indicates reference frequency for the weak amplitude mode analysis. Blue arrow indicates reference frequency for the strong amplitude mode analysis. b Temporal evolution of normalized amplitude mode ratio of the strongest mode, which is marked with blue arrow in a. It shows the system stability over the time period of 100s with amplitude fluctuations below 1%. c Computed Allan variance of high (blue) and low (red) spectral amplitudes of the spectrum in a which is indicated with arrows in the same color code. The black curve shows the computed Allan variance taking the background (Noise equivalent power (NEP) of a detector) into account for a power of strong mode. d Background, or so called 100% line transmission, of a system for a single interferogram and e its temporal stability expressed as a standard deviation (STD) in % over the entire optical bandwidth over 100s.
Fig. 5
Fig. 5. High resolution spectroscopy.
a Measured interleaving spectrum (blue dots, error bars smaller than the dots) of ≈ 500 μm thick silicon etalon within 7 s with a binned frequency resolution down to 5 GHz. Theoretical computed etalon transmission spectrum (red line). b Zoom in into (a). c Doppler broaden methane (CH4) spectrum recorded via interleaving (blue dots) at a pressure of 200 mbar within 25 s with frequency binned resolution down to 250 MHz and the HITRAN data base reference (red line). d Zoom in into (c) with sub-GHz resolved methane absorption lines.
Fig. 6
Fig. 6. Time-resolved spectroscopy on methane.
a Absorbance is computed from time resolved-transmission measurements on the filled gas cell to a pressure of 200 hPa which is evacuated via a pump. The computed methane absorbance for a pressure of 200 hPa is shown on the right side with white lines. Temporal evolution is monitored by initializing the evacuation of the gas cell a t = 0 s. The acquisition is performed with periodicity of 10 ms in the comb regime at a constant current mode. Simultaneously several low pressure methane lines are observed for t < 0 s. b Visualization of the temporal evolution of the strongest absorption line (marked with a dotted black line) in a and the corresponding pressure of the gas cell (error bars are the pressure gauge error). A zoom in is shown in the top right corner with 500 ms time duration starting 1s after opening the valve. c Computed HITRAN absorbance of methane at a pressure of 200 hPa, 100 hPa and 50 hPa and the measured absorbance close to the strongest absorbance peak at these pressure and hence corresponding laboratory time.
Fig. 7
Fig. 7. Schematic of the retro-reflector.
a the delay line comprises a retro-reflector with reflective surfaces R1, R2, reflector at a distance D. The incoming and outgoing reflected beam paths are shown when entering the delay at x = xp. b Rotated retro-reflector by an angle α around the origin. c Schematic of a reflector placed at a distance D to elevate and to reflect back the beam.

References

    1. Schmidt, F. M., Metsälä, M., Apolonski, A. & Cristescu, S. M. in Breathborne Biomarkers and the Human Volatilome 2nd edn (eds Beauchamp, J., Davis, C. & Pleil, J.) Ch. 14 (Elsevier, Boston, 2020).
    1. Fleisher AJ, et al. Mid-infrared time-resolved frequency comb spectroscopy of transient free radicals. J. Phys. Chem. Lett. 2014;5:2241–2246. doi: 10.1021/jz5008559. - DOI - PubMed
    1. Norahan MJ, et al. Microsecond-resolved infrared spectroscopy on nonrepetitive protein reactions by applying caged compounds and quantum cascade laser frequency combs. Anal. Chem. 2021;93:6779–6783. doi: 10.1021/acs.analchem.1c00666. - DOI - PubMed
    1. Cheng J, et al. A review of ultrafast laser materials micromachining. Opt. Laser Technol. 2013;46:88–102. doi: 10.1016/j.optlastec.2012.06.037. - DOI
    1. Ratri PJ, Tashiro K. Phase-transition behavior of a crystalline polymer near the melting point: case studies of the ferroelectric phase transition of poly(vinylidene fluoride) and the β-to-α transition of trans-1,4-polyisoprene. Polym. J. 2013;45:1107–1114. doi: 10.1038/pj.2013.42. - DOI