. 2023;2(2):112-125.
doi: 10.1038/s44161-022-00208-4. Epub 2023 Jan 30.

Single-cell T cell receptor sequencing of paired human atherosclerotic plaques and blood reveals autoimmune-like features of expanded effector T cells

Affiliations

Single-cell T cell receptor sequencing of paired human atherosclerotic plaques and blood reveals autoimmune-like features of expanded effector T cells

Marie A C Depuydt et al. Nat Cardiovasc Res. 2023.

Abstract

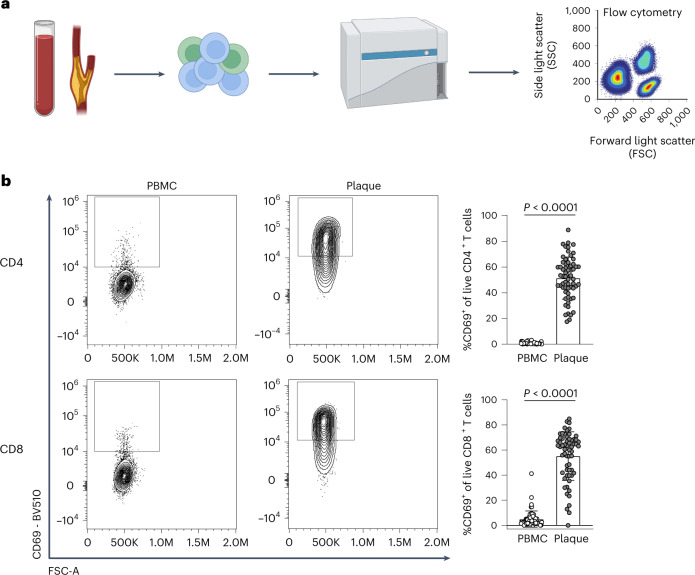
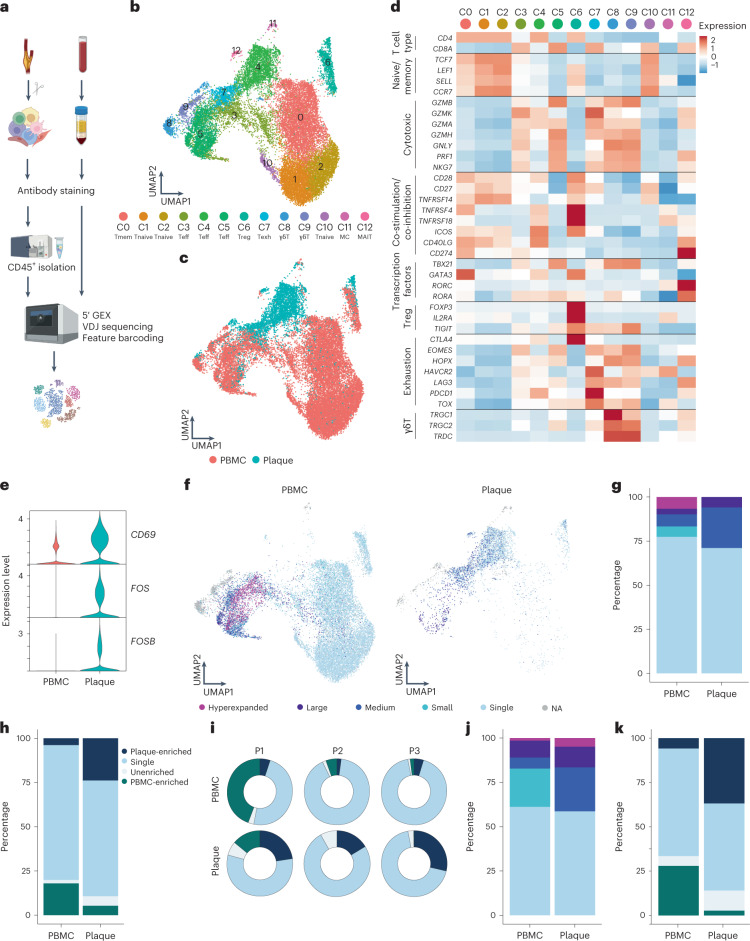
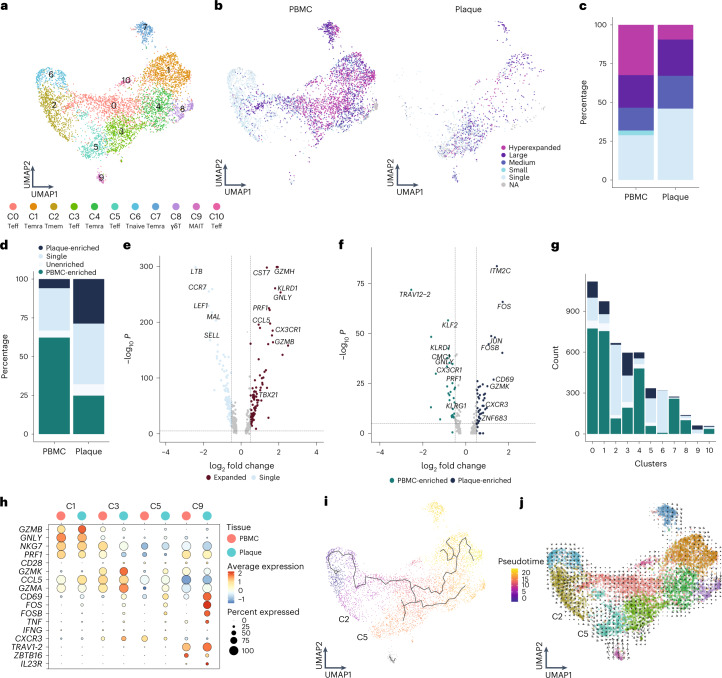
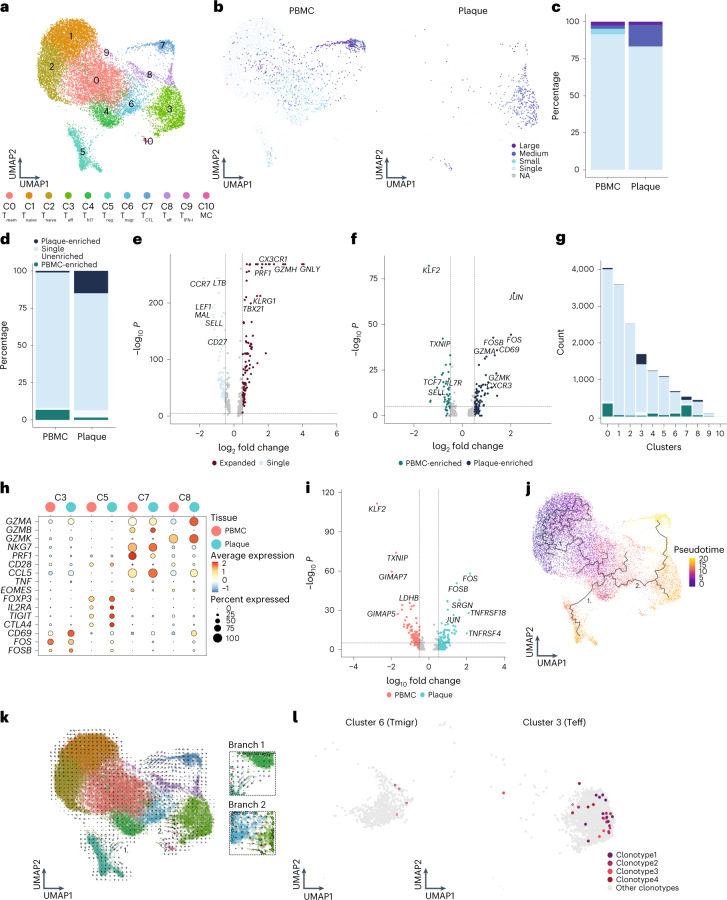
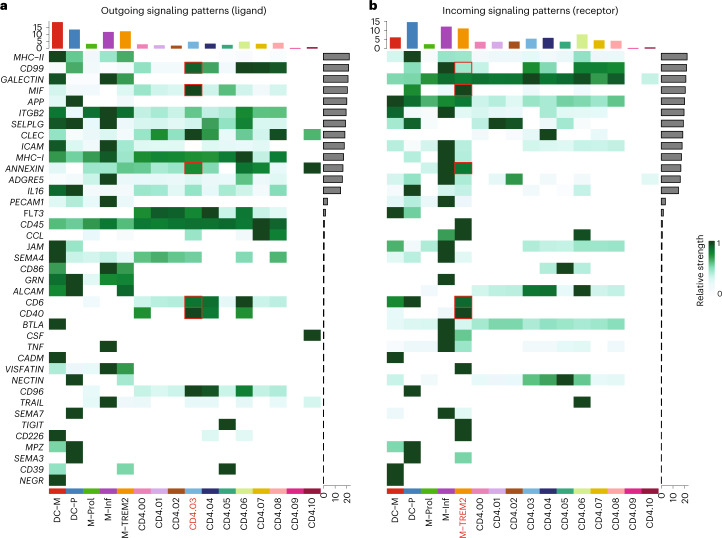
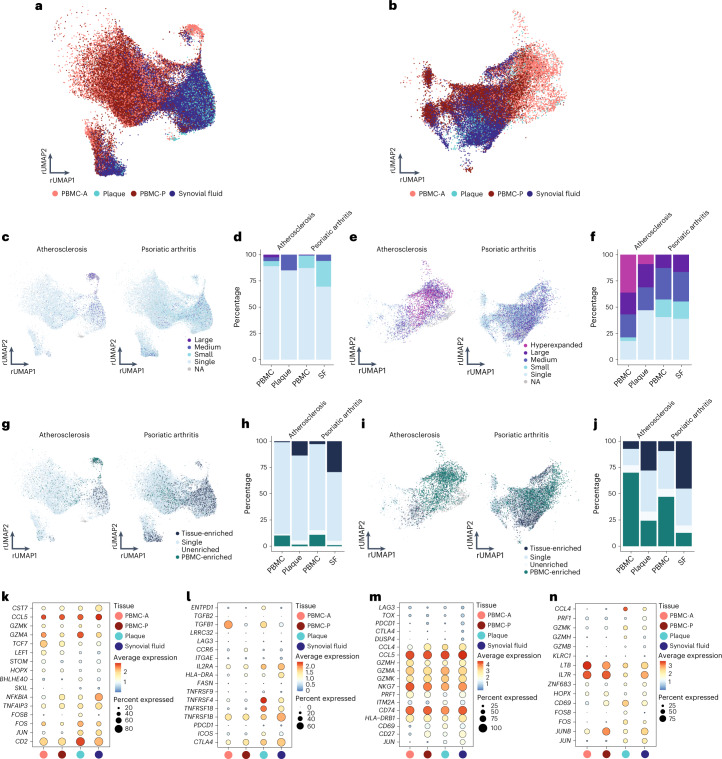
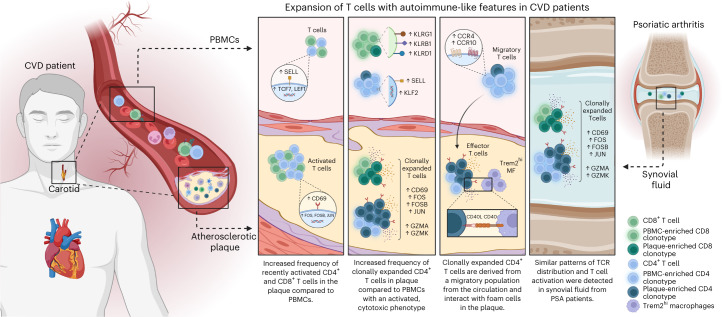
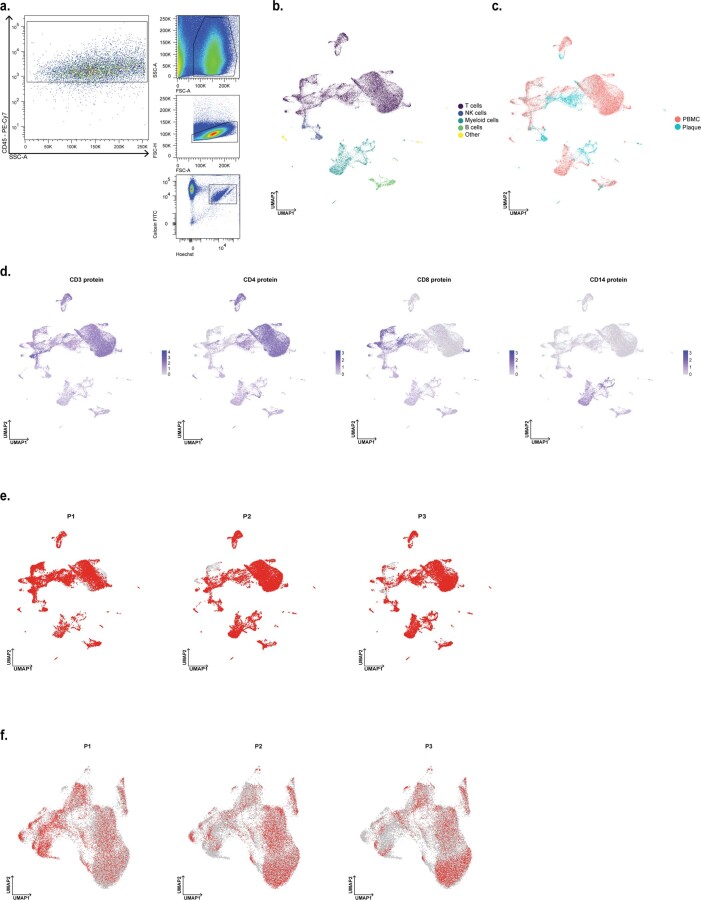
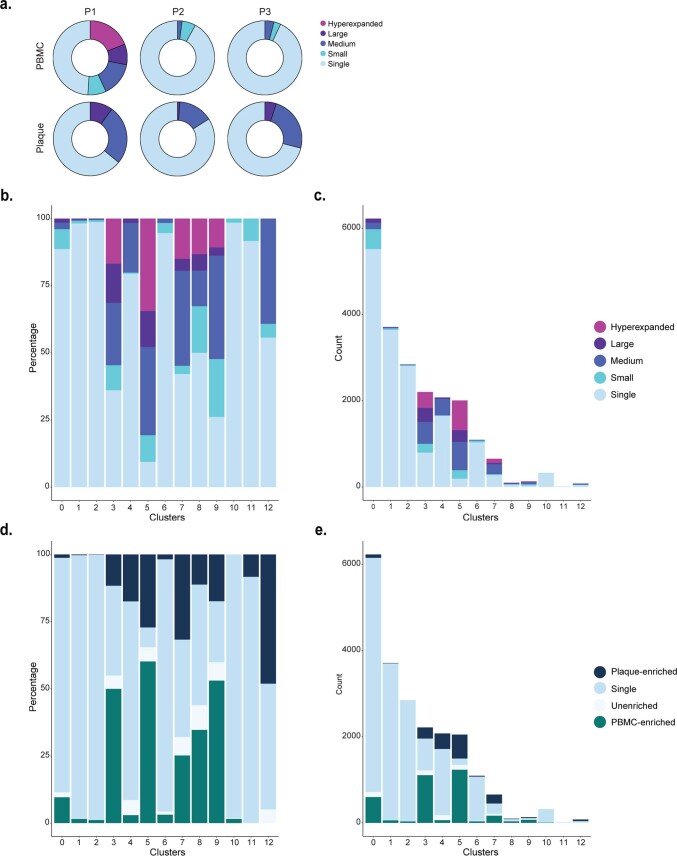
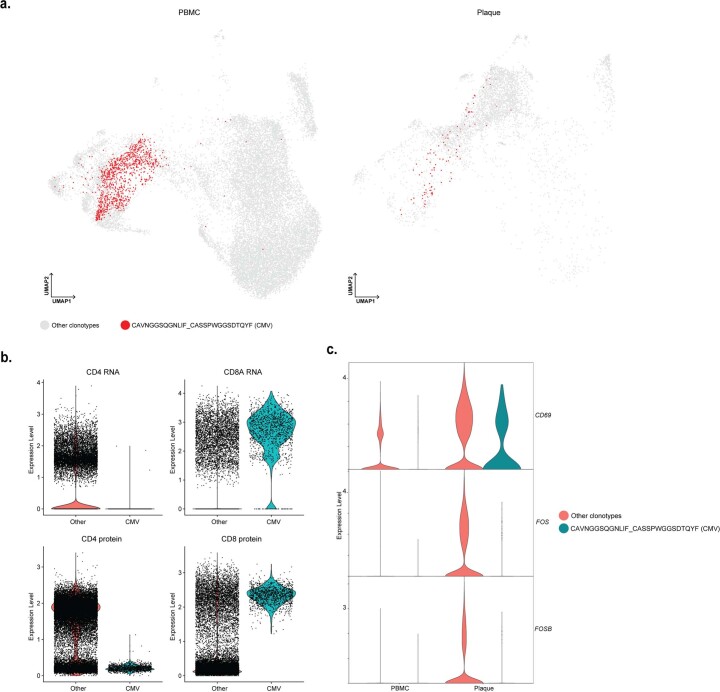
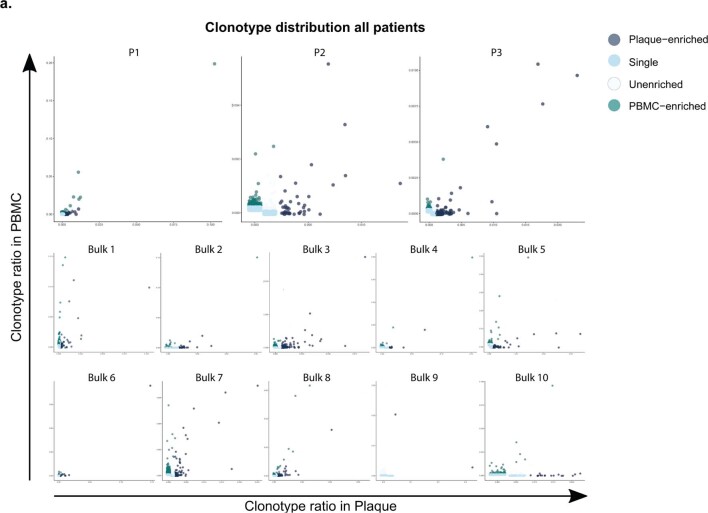
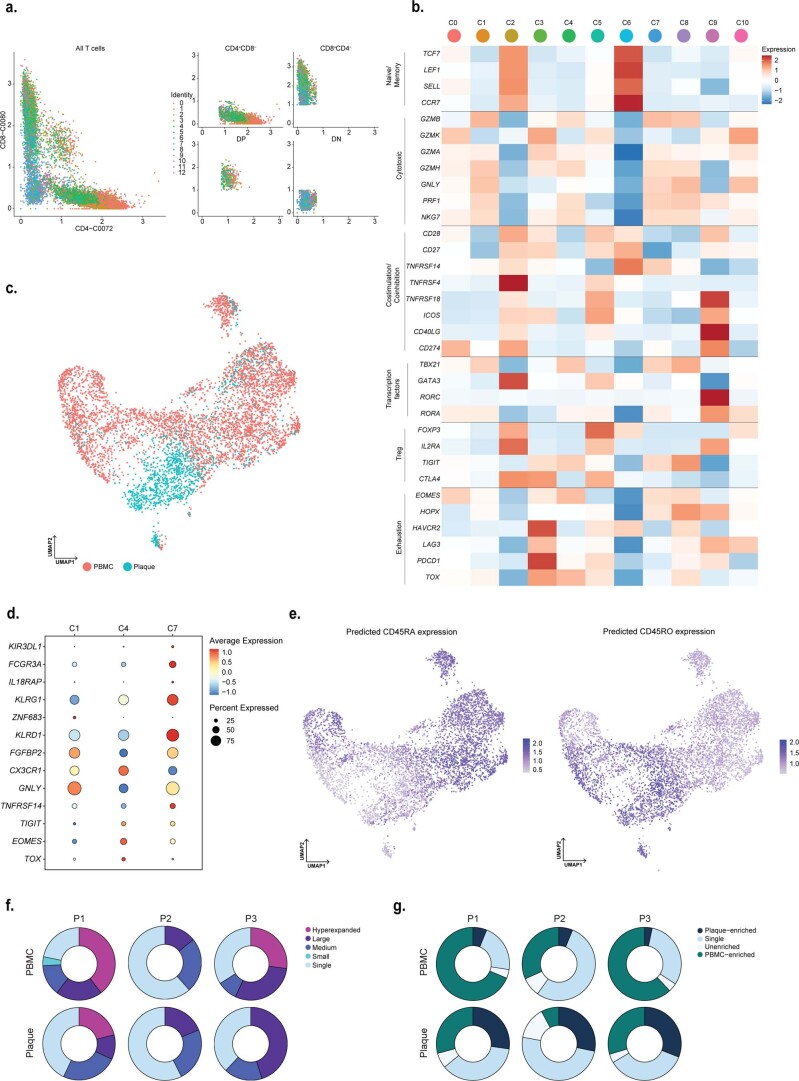
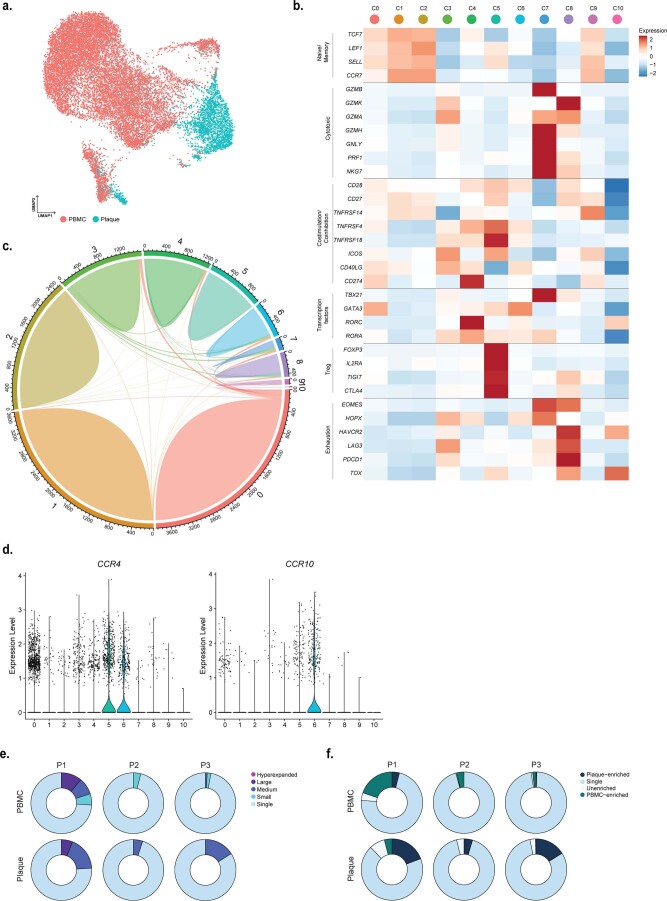
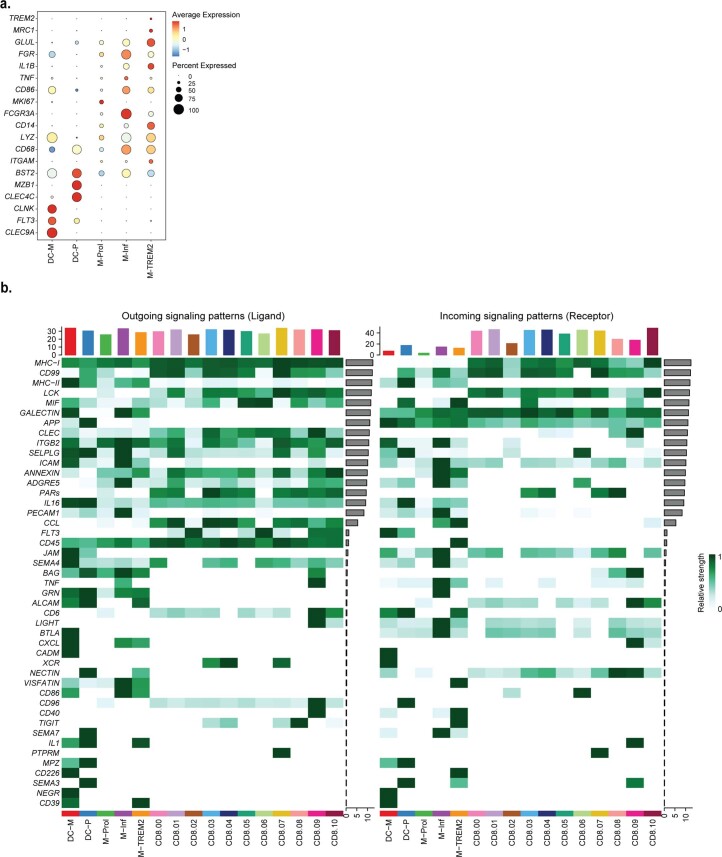
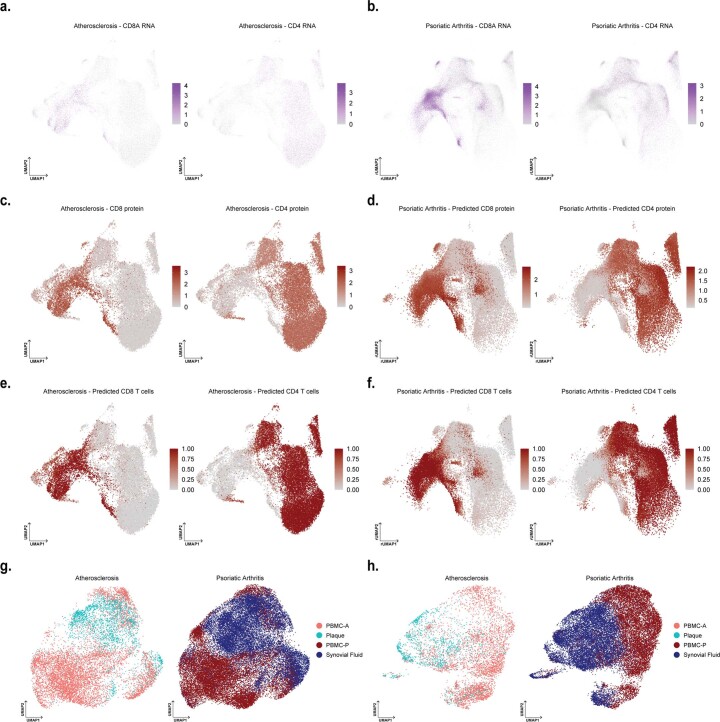
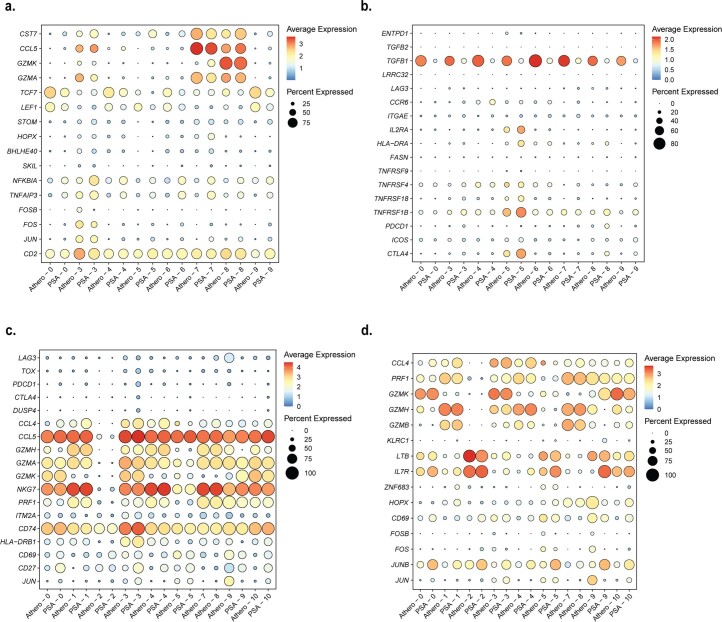
Atherosclerosis is a lipid-driven chronic inflammatory disease; however, whether it can be classified as an autoimmune disease remains unclear. In this study, we applied single-cell T cell receptor seqencing (scTCR-seq) on human carotid artery plaques and matched peripheral blood mononuclear cell samples to assess the extent of TCR clonality and antigen-specific activation within the various T cell subsets. We observed the highest degree of plaque-specific clonal expansion in effector CD4+ T cells, and these clonally expanded T cells expressed genes such as CD69, FOS and FOSB, indicative of recent TCR engagement, suggesting antigen-specific stimulation. CellChat analysis suggested multiple potential interactions of these effector CD4+ T cells with foam cells. Finally, we integrated a published scTCR-seq dataset of the autoimmune disease psoriatic arthritis, and we report various commonalities between the two diseases. In conclusion, our data suggest that atherosclerosis has an autoimmune compondent driven by autoreactive CD4+ T cells.

Keywords: Atherosclerosis; Autoimmunity.


Conflict of interest statement

Competing interestsThe authors declare no competing interests.

Figures

Fig. 1
Fig. 1. Significant increase in CD69+ T cells in the atherosclerotic plaque suggests an antigen-specific T cell response.
a, Experimental setup: single cells from PBMC and plaque samples were stained with fluorescently labelled antibodies and measured through flow cytometry. b, Flow cytometry analysis of CD69 expression on PBMC and plaque live CD4+ and CD8+ T cells. P values are depicted in the figure panels. Data are presented as mean values ± s.d. PBMC n = 58; plaque n = 61. Statistical analyses were performed using an unpaired Mann–Whitney t-test. Source data
Fig. 2
Fig. 2. scTCR-seq reveals clonal expansion and antigen-specific activation of T cells in the plaque.
a, Schematic overview of the study design. Human plaques were enzymatically digested, and live CD45+ cells were sorted using FACS. Matched blood samples were processed to isolate PBMCs. Both plaque cells and PBMCs were then further processed using 10x Genomics and sequenced. b, UMAP depicting 13 distinct T cell clusters resulting from unsupervised clustering (n = 24,443). c, UMAP showing contribution of PBMC or plaque to the T cell clusters. d, Heat map with average expression of T cell function-associated genes. e, Violin plot with expression of CD69, FOS and FOSB in PBMCs and plaque T cells. f, UMAP visualization of clonotype expansion levels among T cells between PBMC and plaque. g, Bar plot with quantification of clonal expansion levels between plaque and PBMC T cells. h, Bar plot with quantification of tissue enrichment scores of clonotypes. i, Circle plots depicting tissue enrichment scores of all T cells per tissue and per patient. j, Bar plot with quantification of clonal expansion levels between PBMC and plaque T cells of bulk TCR-seq data (cohort 3, n = 10). k, Bar plot with quantification of tissue enrichment scores of bulk TCR-seq data (cohort 3). Clonotype expansion levels: Single (one occurrence), Small (≤0.1%), Medium (>0.1% and ≤1%), Large (>1% and ≤10%) and Hyperexpanded (>10%), percentage of all T cells. Tissue enrichment scores: Plaque-enriched (frequency expanded clone higher in plaque versus PBMC), Single (one occurrence), Unenriched (frequency expanded clone similar in PBMC versus plaque) and PBMC-enriched (frequency expanded clone higher in PBMC versus plaque). Source data
Fig. 3
Fig. 3. Limited clonal expansion in plaque CD8+ T cells compared to PBMCs.
a, UMAP visualization of unsupervised clustering revealed 11 distinct CD8+ T cell populations (n = 5,730). b, UMAP visualization of different levels of clonotype expansion among CD8+ T cells between PBMC and plaque. c, Quantification of clonal expansion levels between PBMC and plaque CD8+ T cells. d, Quantification of tissue enrichment scores of clonotypes in CD8+ T cells of PBMC and plaque. e, Volcano plot with differentially expressed genes between CD8+ T cells with single clonotypes and all expanded clonotypes (Small–Large). Genes were considered significant with P < 1 × 10−6 and a fold change of 0.5. For all volcano plots, Bonferroni-corrected P values were calculated based on the total number of genes in the dataset. f, Volcano plot with differentially expressed genes of PBMC-enriched versus plaque-enriched CD8+ T cells. Genes were considered significant with P < 1 × 10−6 and a fold change of 0.5. g, Bar plot with quantification of tissue enrichment score of individual CD8+ T cell clusters. h, Dot plot of average expression of upregulated genes in clusters 1, 3, 5 and 9. i, UMAP visualization of pseudotime analysis of CD8+ T cells. C2 indicates cluster 2; C5 indicates cluster 5. j, UMAP visualization of RNA velocity analysis of CD8+ T cells. Clonotype expansion levels: Single (one occurrence), Small (≤0.1%), Medium (>0.1% and ≤1%), Large (>1% and ≤10%) and Hyperexpanded (>10%), percentage of all CD8+ T cells. Tissue enrichment scores: Plaque-enriched (frequency expanded clone higher in plaque versus PBMC), Single (one occurrence), Unenriched (frequency expanded clone similar in PBMC versus plaque) and PBMC-enriched (frequency expanded clone higher in PBMC versus plaque).
Fig. 4
Fig. 4. Increased percentage of expanded and plaque-enriched CD4+ T cells in the atherosclerotic plaque.
a, UMAP visualization of unsupervised clustering revealed 11 distinct CD4+ T cell populations (n = 17,073). b, UMAP visualization of different levels of clonotype expansion among CD4+ T cells between PBMC and plaque. c, Bar plot with quantification of clonal expansion levels between PBMC and plaque CD4+ T cells. d, Bar plot with quantification of tissue enrichment scores of clonotypes in CD4+ T cells of PBMC and plaque. e, Volcano plot with differentially expressed genes between CD4+ T cells with single clonotypes and all expanded clonotypes (Small–Large). Genes were considered significant with P <1 × 10−6 and a fold change of 0.5. For all volcano plots, Bonferroni-corrected P values were calculated based on the total number of genes in the dataset. f, Volcano plot with differentially expressed genes of PBMC-enriched versus plaque-enriched CD4+ T cells. Genes were considered significant with P <1 × 10−6 and a fold change of 0.5. g, Bar plot with quantification of tissue enrichment score of individual CD4+ T cell clusters. h, Dot plot of average expression of upregulated genes in clusters 3, 5, 7 and 8. i, Volcano plot with differentially expressed genes between Treg cells in PBMC and plaque. Genes were considered significant with P <1 × 10−6 and a fold change of 0.5. j, UMAP visualization of pseudotime analysis of CD4+ T cells. Two branches of the analysis are indicated with 1 and 2. k, UMAP visualization of RNA velocity analysis of CD4+ T cells with close-up of branches 1 and 2. l, UMAP visualization of four overlapping clonotypes between cluster 6 and cluster 3. Open circles indicate PBMC CD4+ T cells; closed circles indicate plaque CD4+ T cells. Clonotype expansion levels: Single (one occurrence), Small (≤0.1%), Medium (>0.1% and ≤1%), Large (>1% and ≤10%), percentage of all CD4+ T cells. Tissue enrichment scores: Plaque-enriched (frequency expanded clone higher in plaque versus PBMC), Single (one occurrence), Unenriched (frequency expanded clone similar in PBMC versus plaque), PBMC-enriched (frequency expanded clone higher in PBMC versus plaque).
Fig. 5
Fig. 5. Enriched interaction pathways between CD4+ Teff cells and TREMhi macrophages.
Heat maps displaying outgoing (ligand) (a) and incoming (receptor) (b) signalling patterns of pathways describing potential ligand–receptor interactions. Scale above the heat map indicates the relative signalling strength of a cell cluster based on all signalling pathways displayed in the heat map. Grey bars to the right of the heat map show the total signalling strength of a pathway in all cell clusters. The relative signalling strength is indicated by ranging colour from white (low) to green (high). All cells included in these graphs originate from the plaque.
Fig. 6
Fig. 6. Tissue-enriched clonal expanded CD4+ and CD8+ T cells of atherosclerosis and PSA have phenotypic commonalities.
a, Atherosclerosis and PSA CD4+ T cells of PBMC, plaque and SF projected on an atherosclerosis CD4+ T cell reference UMAP (rUMAP). b, Atherosclerosis and PSA CD8+ T cells of PBMC, plaque and SF projected on an atherosclerosis CD8+ T cells rUMAP. c, rUMAP projecting clonal expansion levels of CD4+ T cells in atherosclerosis and PSA. d, Quantification of clonal expansion levels of CD4+ T cells in atherosclerosis, split over PBMC and tissue. e, rUMAP projecting clonal expansion levels of CD8+ T cells in atherosclerosis and PSA. f, Bar plot displaying quantification of clonal expansion levels of CD8+ T cells in atherosclerosis, split over PBMC and tissue. g, rUMAP projecting tissue enrichment scores of clonotypes in CD4+ T cells of atherosclerosis and PSA. h, Bar plot with quantification of tissue enrichment scores of CD4+ T cells in atherosclerosis and PSA, split by PBMC and tissue. i, rUMAP projecting tissue enrichment scores of clonotypes in CD8+ T cells of atherosclerosis and PSA. j, Quantification of tissue enrichment scores of CD8+ T cells in atherosclerosis and PSA, split by PBMC and tissue. kn, Dot plots with average expression of genes characterizing the genes underlying the overlap between atherosclerosis and PSA in CD4+ Treg cells (C5, k) and Teff cells (C3, l) and in CD8+ Teff cells (C3, m; C5, n). Clonotype expansion levels: Single (one occurrence), Small (≤0.1%), Medium (>0.1% and ≤1%), Large (>1% and ≤10%) and Hyperexpanded (>10%), percentage of, respectively, CD4+ and CD8+ T cells. Tissue enrichment scores: Tissue-enriched (frequency expanded clone higher in tissue versus PBMC), Single (one occurrence), Unenriched (frequency expanded clone similar in PBMC versus tissue) and PBMC-enriched (frequency expanded clone higher in PBMC versus tissue).
Fig. 7
Fig. 7. Expansion of T cells with autoimmune-like features in CVD patients.
Schematic presentation of the main conclusions.
Extended Data Fig. 1
Extended Data Fig. 1. Gating strategy of flow cytometry of CD69+ T cells.
a. Example of gating and gating ancestry of CD69+ T cells in PBMC. b. Example of gating and gating ancestry of CD69+ in the plaque.
Extended Data Fig. 2
Extended Data Fig. 2. Single-cell RNA sequencing of PBMC and live CD45+ plaque cells.
a. Gating strategy used for fluorescent-activated cell sorting (FACS) to isolate plaque live CD45+ cells for 10X Genomics and sequencing. b. UMAP projection of all PBMC and plaque cells, depicting multiple leukocyte types (n = 33249). c. UMAP visualization of tissue distribution of PBMC and plaque cells. d. UMAP projection of protein expression of CD3, CD4, CD8 and CD14 on all PBMC and plaque cells. e. Patient contribution to UMAP of all PBMC and plaque cells. Red dots indicate cells that are retrieved from the abovementioned patient. f. Patient contribution to UMAP of PBMC and plaque T cells. Red dots indicate cells that are retrieved from the abovementioned patient.
Extended Data Fig. 3
Extended Data Fig. 3. Distribution of clonal expansion levels and tissue-enrichment scores in T cell clusters.
a. Circle plots depicting clonal expansion levels of all T cells per tissue and per patient. b. Barplot with relative quantification of clonal expansion levels per cluster. c. Barplot with absolute quantification of clonal expansion levels per cluster. d. Relative quantification of tissue enrichment scores per cluster. e. Barplot with absolute quantification of tissue enrichment scores per cluster. Clonotype expansion levels: Single (one occurrence), Small (≤0.1%), Medium (>0.1 & ≤1%), Large (>1 & ≤10%), Hyperexpanded (>10%), percentage of all T cells. Tissue enrichment scores: Plaque-enriched (Frequency expanded clone higher in Plaque vs. PBMC), Single (one occurrence), Unenriched (Frequency expanded clone similar in PBMC vs. Plaque), PBMC-enriched (Frequency expanded clone higher in PBMC vs Plaque). Source data
Extended Data Fig. 4
Extended Data Fig. 4. Hyperexpanded CMV clonotype does not show signs of recent T cell activation.
a. UMAP projection of clonotype CAVNGGSQGNLIF_CASSPWGGSDTQYF (CMV) on PBMC and plaque T cells. Red dots indicate T cells with clonotype CAVNGGSQGNLIF_CASSPWGGSDTQYF, grey dots indicate T cells with other clonotypes. b. Violin plots projecting gene expression of CD4, CD8A and protein expression of CD4 and CD8 split by T cells with and without clonotype CAVNGGSQGNLIF_CASSPWGGSDTQYF. c. Violin plots projecting expression of CD69, FOS and FOSB split by tissue and presence of clonotype CAVNGGSQGNLIF_CASSPWGGSDTQYF.
Extended Data Fig. 5
Extended Data Fig. 5. Distribution of expanded TCRs in scTCRseq and TCRβ bulk data sets.
a. Scatterplot projecting frequencies of clonotypes and their tissue enrichment scores in PBMC and plaque per patient of the single-cell TCR sequencing dataset (Cohort 2) and the TCRβ bulk sequencing data set (Cohort 3). Tissue enrichment scores: Plaque-enriched (Frequency expanded clone higher in Plaque vs. PBMC), Single (1 occurrence), Unenriched (Frequency expanded clone similar in PBMC vs. Plaque), PBMC-enriched (Frequency expanded clone higher in PBMC vs Plaque).
Extended Data Fig. 6
Extended Data Fig. 6. CD8+ T cell marker genes and tissue distribution.
a. CD4 and CD8 protein expression on all T cells colored by cluster ID. Visualization of selection of CD4+CD8, CD4CD8+, double positive (DP) and double negative (DN) cells. CD4+CD8 cells were used for subclustering of CD4+ T cells. CD4CD8+ cells were used for subclustering of CD8+ T cells. b. UMAP projection of tissue distribution of PBMC and plaque CD8+ T cells. c. Heatmap with expression of T cell function-associated genes in CD8+ T cell clusters. d. Dot plot visualization of a selection of differentially regulated genes, excluding TCR complex genes, between clusters 1, 4 and 7. e. Predicted expression of CD45RA and CD45RO based on mapping the data with Seurat multimodal reference mapping. f. Circle plots depicting clonal expansion levels of CD8+ T cells per tissue and per patient. g. Circle plots depicting tissue-enrichment scores of CD8+ T cells per tissue and per patient. Clonotype expansion levels: Single (one occurrence), Small (≤0.1%), Medium (>0.1 & ≤1%), Large (>1 & ≤10%), Hyperexpanded (>10%), percentage of all CD8+ T cells. Tissue enrichment scores: Plaque-enriched (Frequency expanded clone higher in Plaque vs. PBMC), Single (one occurrence), Unenriched (Frequency expanded clone similar in PBMC vs. Plaque), PBMC-enriched (Frequency expanded clone higher in PBMC vs Plaque). Source data
Extended Data Fig. 7
Extended Data Fig. 7. CD4+ T cell marker genes and tissue distribution.
a. UMAP visualization of tissue distribution of PBMC and plaque CD4+ T cells. b. Heatmap with expression of T cell function-associated genes in CD4+ T cell clusters. c. Circle plot visualizing the overlap of clonotypes between all CD4+ clusters. Each color represents a different cluster. Axis indicates the number of TCRs. Line thickness indicates the number of overlapping clonotypes. d. Violin plots depicting expression of CCR4 and CCR10 in CD4+ T cell clusters. e. Circle plots depicting clonal expansion levels of CD4+ T cells per tissue and per patient. f. Circle plots depicting tissue-enrichment scores of CD4+ T cells per tissue and per patient. Clonotype expansion levels: Single (one occurrence), Small (≤0.1%), Medium (>0.1 & ≤1%), Large (>1 & ≤10%), Hyperexpanded (>10%), percentage of all CD4+ T cells. Tissue enrichment scores: Plaque-enriched (Frequency expanded clone higher in Plaque vs. PBMC), Single (one occurrence), Unenriched (Frequency expanded clone similar in PBMC vs. Plaque), PBMC-enriched (Frequency expanded clone higher in PBMC vs Plaque). Source data
Extended Data Fig. 8
Extended Data Fig. 8. CellChat interaction pathways between CD8+ T cells and myeloid cells.
a. Dotplot displaying average expression of genes describing the different dendritic cell and macrophage clusters. DC-M indicates myeloid-derived dendritic cell (DC); DC-P indicates plasmacytoid DC; M-PROL indicates proliferating macrophages; M-Inf indicates inflammatory macrophage; M-TREM2 indicates TREM2hi macrophages. b. Heatmaps displaying outgoing (Ligand) and incoming (Receptor) signalling patterns of pathways describing potential ligand-receptor interactions. Scale above heatmap indicates the relative signalling strength of a cell cluster based on all signalling pathways displayed in the heatmap. Grey bars right of the heatmap show the total signalling strength of a pathway in all cell clusters. The relative signalling strength indicated by ranging color from white (low) to green (high). All cells included in these graphs originate from the plaque.
Extended Data Fig. 9
Extended Data Fig. 9. Projection of CD4+ and CD8+ T cells of integrated atherosclerosis and psoriatic arthritis single-cell TCR sequencing data on the reference UMAP projection of CD4+ and CD8+ atherosclerosis data.
a UMAP visualization of RNA expression of CD8A and CD4 on atherosclerosis T cells. b. rUMAP visualization of RNA expression of CD8A and CD4 on psoriatic arthritis T cells. c. UMAP visualization of protein expression of CD8 and CD4 on atherosclerosis T cells. d. rUMAP visualization of predicted protein expression of CD8 and CD4 on psoriatic arthritis T cells. e. UMAP visualization of selected CD8+ and CD4+ atherosclerosis T cells. f. UMAP visualization of selected CD8+ and CD4+ psoriatic arthritis T cells. g. UMAP of integrated CD4+ T cells split by diseased and grouped by tissue type. h. UMAP of integrated CD8+ T cells split by diseased and grouped by tissue type.
Extended Data Fig. 10
Extended Data Fig. 10. Extended dot plots with characterizing genes for atherosclerosis and psoriatic arthritis overlapping clonal expanded T cells.
Dotplots with genes used to characterize overlapping clusters of atherosclerosis and psoriatic arthritis per disease and per cluster of respectively CD4+ cluster 3 genes (a), CD4+ cluster 5 genes (b) CD8+ cluster 3 genes (c) and CD8+ cluster 5 genes (d).

Comment in

References

    1. Ridker PM, et al. Antiinflammatory therapy with canakinumab for atherosclerotic disease. N. Engl. J. Med. 2017;377:1119–1132. doi: 10.1056/NEJMoa1707914. - DOI - PubMed
    1. Nidorf SM, et al. Colchicine in patients with chronic coronary disease. N. Engl. J. Med. 2020;383:1838–1847. doi: 10.1056/NEJMoa2021372. - DOI - PubMed
    1. Depuydt MAC, et al. Microanatomy of the human atherosclerotic plaque by single-cell transcriptomics. Circ. Res. 2020;127:1437–1455. doi: 10.1161/CIRCRESAHA.120.316770. - DOI - PMC - PubMed
    1. Fernandez DM, et al. Single-cell immune landscape of human atherosclerotic plaques. Nat. Med. 2019;25:1576–1588. doi: 10.1038/s41591-019-0590-4. - DOI - PMC - PubMed
    1. Stemme S, et al. T lymphocytes from human atherosclerotic plaques recognize oxidized low density lipoprotein. Med. Sci. 1995;92:3893–3897. - PMC - PubMed