. 2024 Apr 10:15:1330796.
doi: 10.3389/fimmu.2024.1330796. eCollection 2024.

Evaluation of cytokine profiles related to Mycobacterium tuberculosis latent antigens using a whole-blood assay in the Philippines

Affiliations

Evaluation of cytokine profiles related to Mycobacterium tuberculosis latent antigens using a whole-blood assay in the Philippines

Ikkoh Yasuda et al. Front Immunol. .

Abstract

Introduction: There is no useful method to discriminate between latent tuberculosis infection (LTBI) and active pulmonary tuberculosis (PTB). This study aimed to investigate the potential of cytokine profiles to discriminate between LTBI and active PTB using whole-blood stimulation with Mycobacterium tuberculosis (MTB) antigens, including latency-associated antigens.

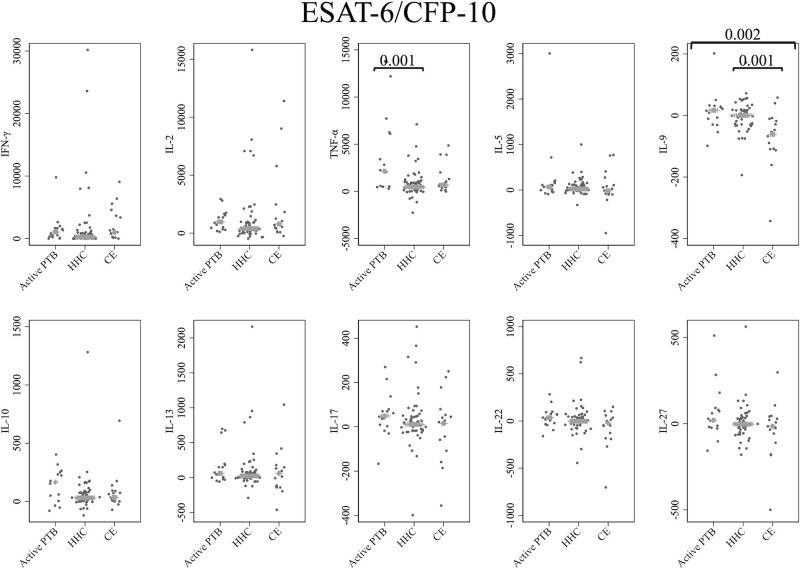
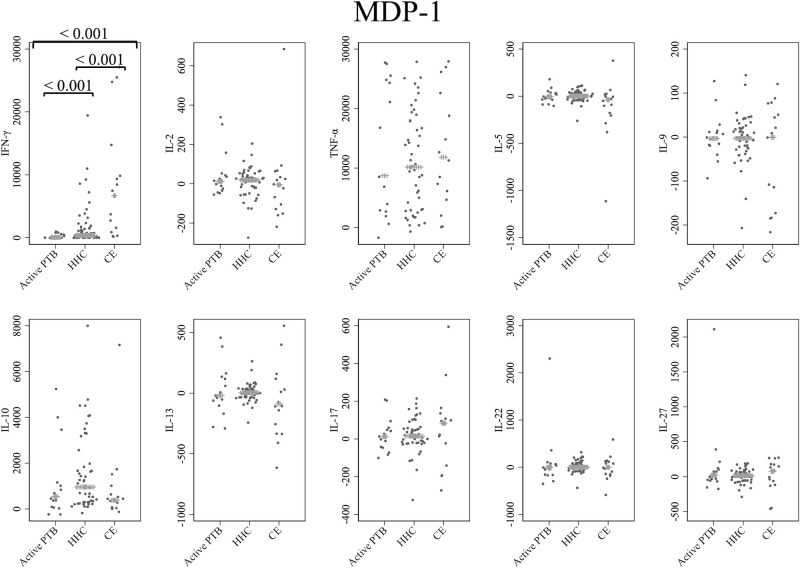
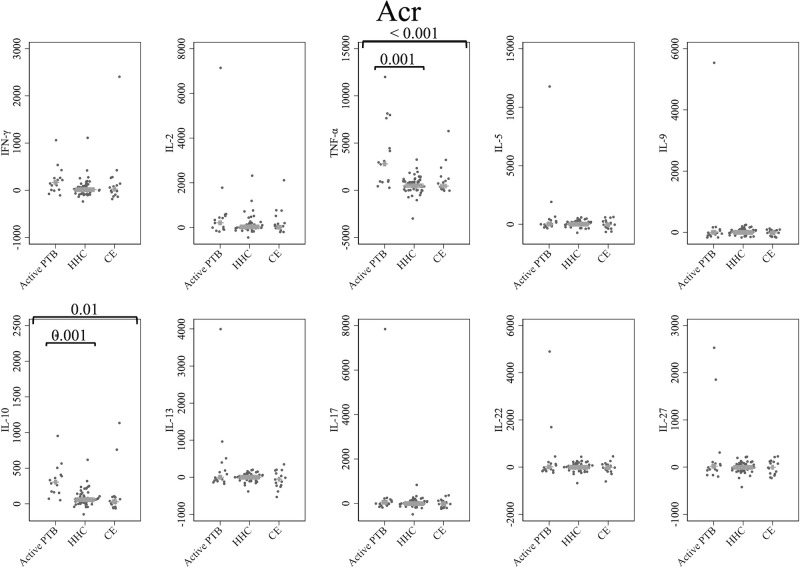
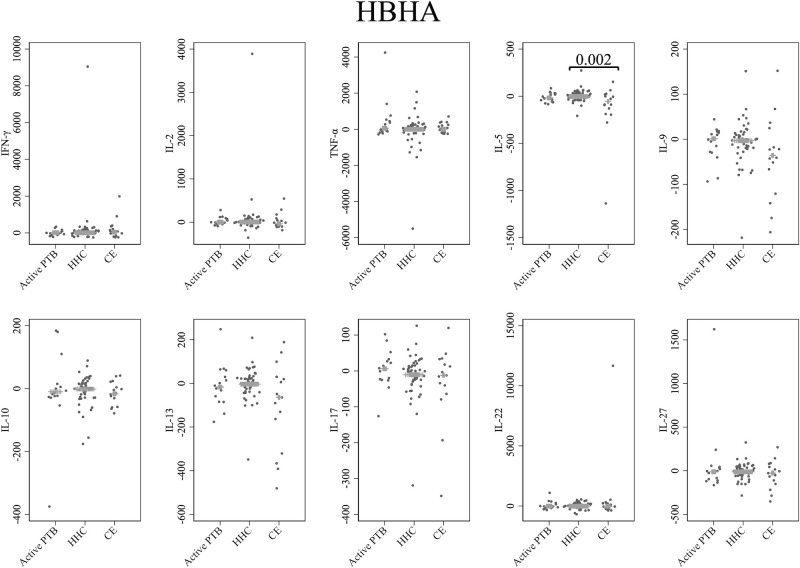
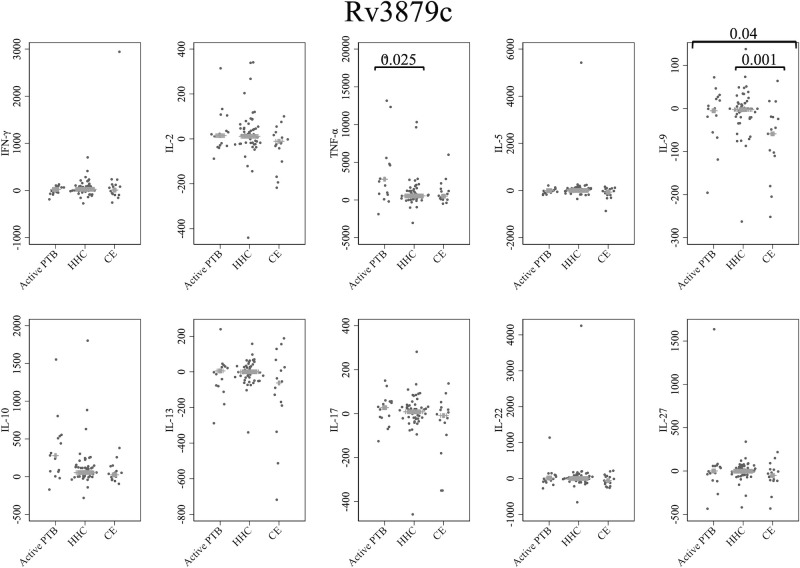
Materials and methods: Patients with active PTB, household contacts of active PTB patients and community exposure subjects were recruited in Manila, the Philippines. Peripheral blood was collected from the participants and used for whole-blood stimulation (WBS) with either the early secretory antigenic target and the 10-kDa culture filtrate protein (ESAT-6/CFP-10), Rv3879c or latency-associated MTB antigens, including mycobacterial DNA-binding protein 1 (MDP-1), α-crystallin (Acr) and heparin-binding hemagglutinin (HBHA). Multiple cytokine concentrations were analyzed using the Bio-Plex™ multiplex cytokine assay.

Results: A total of 78 participants consisting of 15 active PTB patients, 48 household contacts and 15 community exposure subjects were eligible. The MDP-1-specific IFN-γ level in the active PTB group was significantly lower than that in the household contact group (p < 0.001) and the community exposure group (p < 0.001). The Acr-specific TNF-α and IL-10 levels in the active PTB group were significantly higher than those in the household contact (TNF-α; p = 0.001, IL-10; p = 0.001) and community exposure (TNF-α; p < 0.001, IL-10; p = 0.01) groups. However, there was no significant difference in the ESAT-6/CFP-10-specific IFN-γ levels among the groups.

Conclusion: The patterns of cytokine profiles induced by latency-associated MTB antigens using WBS have the potential to discriminate between LTBI and active PTB. In particular, combinations of IFN-γ and MDP-1, TNF-α and Acr, and IL-10 and Acr are promising. This study provides the first demonstration of the utility of MDP-1-specific cytokine responses in WBS.

Keywords: interferon-γ; interleukin-10; latent tuberculosis infection; mycobacterial DNA-binding protein 1; the Philippines; tuberculosis; tumor necrosis factor-α; α-crystallin.


Conflict of interest statement

The authors declare that the research was conducted in the absence of any commercial or financial relationships that could be construed as a potential conflict of interest.

Figures

Figure 1
Figure 1
Cytokine response to ESAT-6/CFP-10. The X-axis shows the participant groups. The Y-axis shows the concentrations of cytokines (pg/mL for IFN-γ, IL-2, TNF-α, IL-5, IL-9, IL-10, IL-13 and IL-17; ng/mL for IL-22 and IL-27). The horizontal lines show the medians. The numbers in the figure indicate adjusted p values. Comparisons of the concentrations of each cytokine among active PTB patients, household contacts and community exposures were performed using the Kruskal-Wallis test followed by Dunn’s post hoc test with Holm adjustment. We used linear regression to adjust for the potential confounders age, sex and BMI. Active PTB, active pulmonary tuberculosis; HHC, household contact; CE, community exposure.
Figure 2
Figure 2
Cytokine response to MDP-1. The X-axis shows the participant groups. The Y-axis shows the concentrations of cytokines (pg/mL for IFN-γ, IL-2, TNF-α, IL-5, IL-9, IL-10, IL-13 and IL-17; ng/mL for IL-22 and IL-27). The horizontal lines show the medians. The numbers in the figure indicate adjusted p values. Comparisons of the concentrations of each cytokine among active PTB patients, household contacts and community exposures were performed using the Kruskal-Wallis test followed by Dunn’s post hoc test with Holm adjustment. We used linear regression to adjust for the potential confounders age, sex and BMI. Active PTB, active pulmonary tuberculosis; HHC, household contact; CE, community exposure.
Figure 3
Figure 3
Cytokine response to Acr. The X-axis shows the participant groups. The Y-axis shows the concentrations of cytokines (pg/mL for IFN-γ, IL-2, TNF-α, IL-5, IL-9, IL-10, IL-13 and IL-17; ng/mL for IL-22 and IL-27). The horizontal lines show the medians. The numbers in the figure indicate adjusted p values. Comparisons of the concentrations of each cytokine among active PTB patients, household contacts and community exposures were performed using the Kruskal-Wallis test followed by Dunn’s post hoc test with Holm adjustment. We used linear regression to adjust for the potential confounders age, sex and BMI. Active PTB, active pulmonary tuberculosis; HHC, household contact; CE, community exposure.
Figure 4
Figure 4
Cytokine response to HBHA. The X-axis shows the participant groups. The Y-axis shows the concentrations of cytokines (pg/mL for IFN-γ, IL-2, TNF-α, IL-5, IL-9, IL-10, IL-13 and IL-17; ng/mL for IL-22 and IL-27). The horizontal lines show the medians. The numbers in the figure indicate adjusted p values. Comparisons of the concentrations of each cytokine among active PTB patients, household contacts and community exposures were performed using the Kruskal-Wallis test followed by Dunn’s post hoc test with Holm adjustment. We used linear regression to adjust for the potential confounders age, sex and BMI. Active PTB, active pulmonary tuberculosis; HHC, household contact; CE, community exposure.
Figure 5
Figure 5
Cytokine response to Rv3879c. The X-axis shows the participant groups. The Y-axis shows the concentrations of cytokines (pg/mL for IFN-γ, IL-2, TNF-α, IL-5, IL-9, IL-10, IL-13 and IL-17; ng/mL for IL-22 and IL-27). The horizontal lines show the medians. The numbers in the figure indicate adjusted p values. Comparisons of the concentrations of each cytokine among active PTB patients, household contacts and community exposures were performed using the Kruskal-Wallis test followed by Dunn’s post hoc test with Holm adjustment. We used linear regression to adjust for the potential confounders age, sex and BMI. Active PTB, active pulmonary tuberculosis; HHC, household contact; CE, community exposure.

Similar articles

Cited by

References

    1. World Health Organization . Latent TB Infection: Updated and consolidated guidelines for programmatic management . Available online at: https://www.who.int/publications/i/item/9789241550239 (Accessed 10 October 2023). - PubMed
    1. Pai M, Behr MA, Dowdy D, Dheda K, Divangahi M, Boehme CC, et al. . Tuberculosis. Nat Rev Dis Primers. (2016) 2:16076. doi: 10.1038/nrdp.2016.76 - DOI - PubMed
    1. Chandra P, Grigsby SJ, Philips JA. Immune evasion and provocation by Mycobacterium tuberculosis. Nat Rev Microbiol. (2022) 20:750–66. doi: 10.1038/s41579-022-00763-4 - DOI - PMC - PubMed
    1. Shah M, Dorman SE. Latent tuberculosis infection. N Engl J Med. (2021) 385:2271–80. doi: 10.1056/NEJMcp2108501 - DOI - PubMed
    1. Achkar JM, Lawn SD, Moosa MY, Wright CA, Kasprowicz VO. Adjunctive tests for diagnosis of tuberculosis: serology, ELISPOT for site-specific lymphocytes, urinary lipoarabinomannan, string test, and fine needle aspiration. J Infect Dis. (2011) 204 Suppl 4:S1130–1141. doi: 10.1093/infdis/jir450 - DOI - PMC - PubMed

Publication types

MeSH terms