. 2024 Apr 11:11:1361386.
doi: 10.3389/fmolb.2024.1361386. eCollection 2024.

A delayed and unsynchronized ovary development as revealed by transcriptome of brain and pituitary of Coilia nasus

Affiliations

A delayed and unsynchronized ovary development as revealed by transcriptome of brain and pituitary of Coilia nasus

Ziyan Yu et al. Front Mol Biosci. .

Abstract

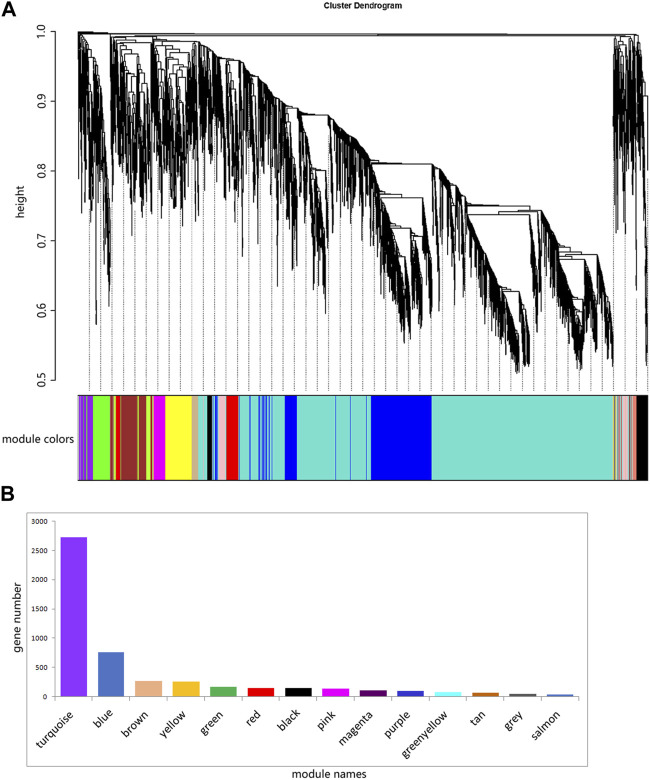
Coilia nasus is an anadromous fish that has been successfully domesticated in the last decade due to its high economic value. The fish exhibits a delayed ovary development during the reproductive season, despite breeding and selection for five to six offspring. The molecular mechanism of the delayed ovary development is still unknown, so the obstacles have not been removed in the large-scale breeding program. This study aims to investigate the key genes regulating ovarian development by comparing the transcriptomes of ovarian-stage IV and stage II brain/pituitary of Coilia nasus. Ovarian stages were validated by histological sections. A total of 75,097,641 and 66,735,592 high-quality reads were obtained from brain and pituitary transcriptomes, respectively, and alternatively spliced transcripts associated with gonadal development were detected. Compared to ovarian Ⅱ- brain, 515 differentially expressed genes (DEGs) were upregulated and 535 DEGs were downregulated in ovarian Ⅳ- brain, whereas 470 DEGs were upregulated and 483 DEGs were downregulated in ovarian Ⅳ- pituitary compared to ovarian Ⅱ- pituitary. DEGs involved in hormone synthesis and secretion and in the GnRH signaling pathway were screened. Weighted gene co-expression network analysis identified gene co-expression modules that were positively correlated with ovarian phenotypic traits. The hub genes Smad4 and TRPC4 in the modules were co-expressed with DEGs including Kiss1 receptor and JUNB, suggesting that ovarian development is controlled by a hypothalamic-pituitary-gonadal axis. Our results have provided new insights that advance our understanding of the molecular mechanism of C. nasus reproductive functions and will be useful for future breeding.

Keywords: Coilia nasus; RNA-seq; gonad; pituitary; weighted gene co-expression analysis.


Conflict of interest statement

The authors declare that the research was conducted in the absence of any commercial or financial relationships that could be construed as a potential conflict of interest.

Figures

FIGURE 1
FIGURE 1
Representative photographs demonstrating ovarian developmental stages in adult taper-tail anchovy. (A) adult and female Coilia nasus. (B) ovary at stage Ⅱ. (C) ovary at stage Ⅳ. (Scale bar = 100 μm).
FIGURE 2
FIGURE 2
Volcano plot of DEGs calculated based on raw counts from brain (left) and pituitary (right) with ovarian development at stage Ⅳ versus stage Ⅱ.
FIGURE 3
FIGURE 3
The top 20 distribution of DEGs among GO terms.
FIGURE 4
FIGURE 4
Top 20 distribution of DEGs presented in KEGG pathways.
FIGURE 5
FIGURE 5
Validation of 17 DEGs in the brain and pituitary with ovary at stage Ⅱ and Ⅳ by qRT-PCR. Grey bar denotes FPKM value calculated by eXpress, and colour bar denotes qRT-PCR value.
FIGURE 6
FIGURE 6
Fourteen different modules identified. (A) Gene co-expression network gene clustering number and modular cutting. The vertical distance of trees represents the distance between genes. Module colors are the module division of merged modules with similar expression patterns according to module similarity. (B) Number of genes per module. The abscissa represents each module, and the ordinate represents the number of genes.
FIGURE 7
FIGURE 7
Correlation between gene co-expression network modules and brain/pituitary with ovary different traits. The horizontal axis represents different traits, and the vertical axis represents each module. The colour lattice and number without bracket represent a correlation between the ovary traits with the module, while the number with bracket represents a significant degree of correlation.
FIGURE 8
FIGURE 8
The network construction of hub genes in brain and pituitary with ovary at different development stages in two modules, MEred and MEturquoise.

References

    1. Amberg J. J., Goforth R. R., Sepúlveda M. S. (2013). Antagonists to the Wnt cascade exhibit sex-specific expression in gonads of sexually mature shovelnose sturgeon. Sex. Dev. 7, 308–315. 10.1159/000354280 - DOI - PubMed
    1. Avise J. C., Mank J. E. (2009). Evolutionary perspectives on hermaphroditism in fishes. Sex. Dev. 3, 152–163. 10.1159/000223079 - DOI - PubMed
    1. Baroiller J. F., Guiguen Y. (2001). Endocrine and environmental aspects of sex differentiation in gonochoristic fish. EXS 2001, 177–201. 10.1007/978-3-0348-7781-7_9 - DOI - PubMed
    1. Bókony V., Milne G., Pipoly I., Székely T., Liker A. (2019). Sex ratios and bimaturism differ between temperature-dependent and genetic sex-determination systems in reptiles. BMC Evol. Biol. 19, 57. 10.1186/s12862-019-1386-3 - DOI - PMC - PubMed
    1. Bustin S., Huggett J. (2017). qPCR primer design revisited. Biomol. Detect Quantif. 14, 19–28. 10.1016/j.bdq.2017.11.001 - DOI - PMC - PubMed