. 2023;2(12):1262-1276.
doi: 10.1038/s44161-023-00378-9. Epub 2023 Dec 7.

Therapeutic efficacy of AAV-mediated restoration of PKP2 in arrhythmogenic cardiomyopathy

Affiliations

Therapeutic efficacy of AAV-mediated restoration of PKP2 in arrhythmogenic cardiomyopathy

Eirini Kyriakopoulou et al. Nat Cardiovasc Res. 2023.

Abstract

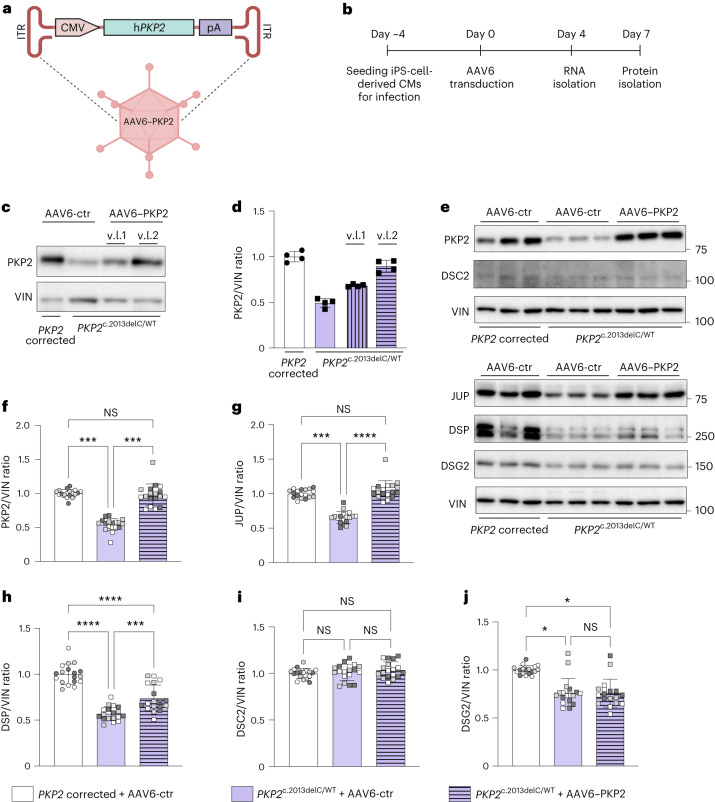
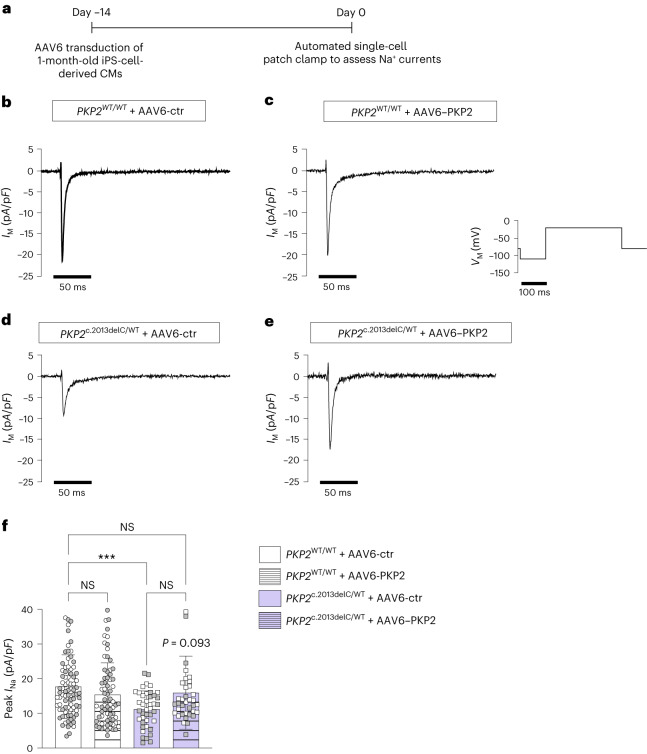
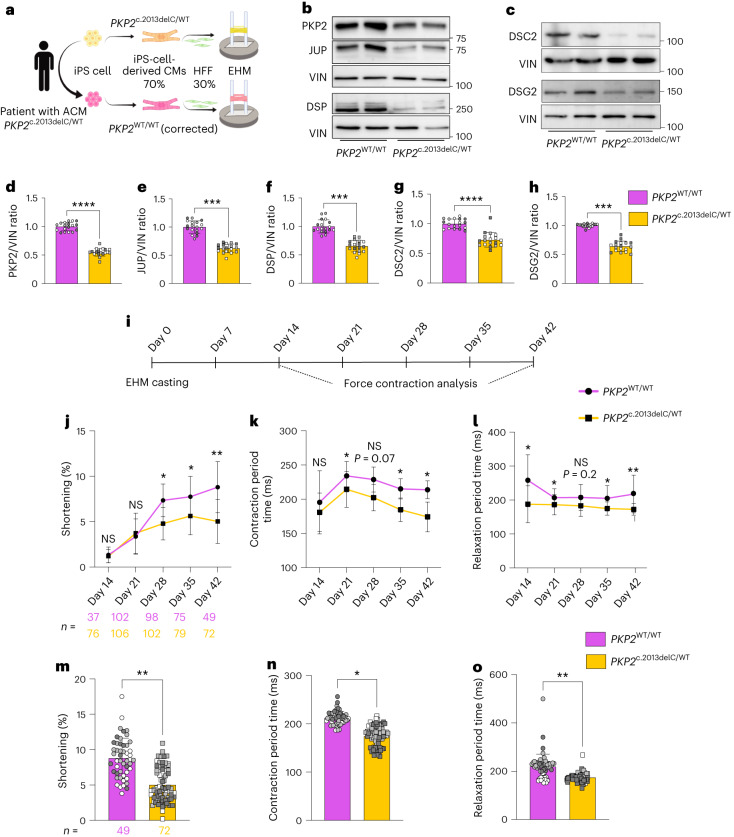
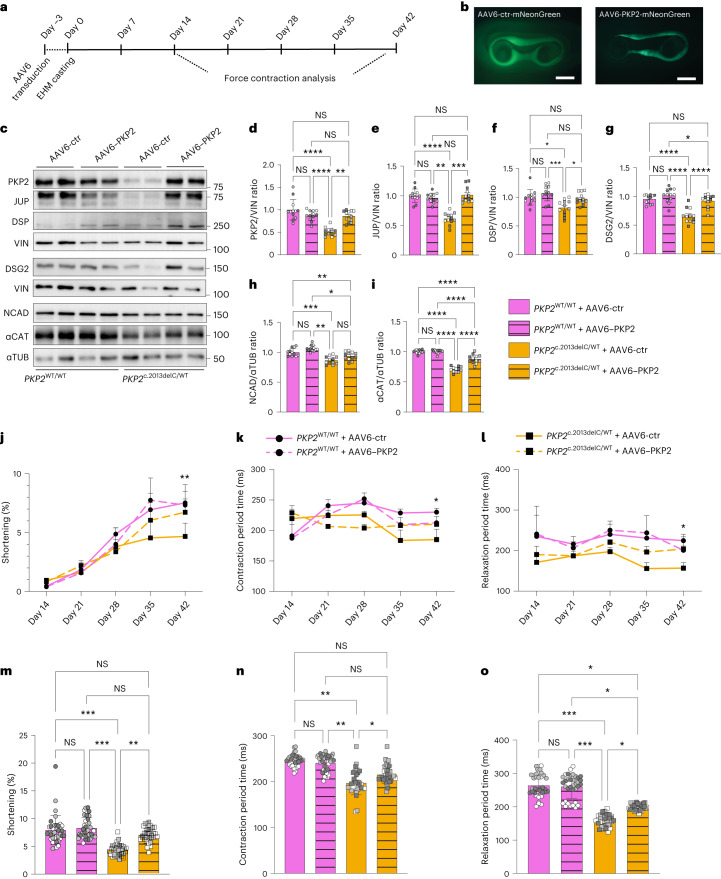
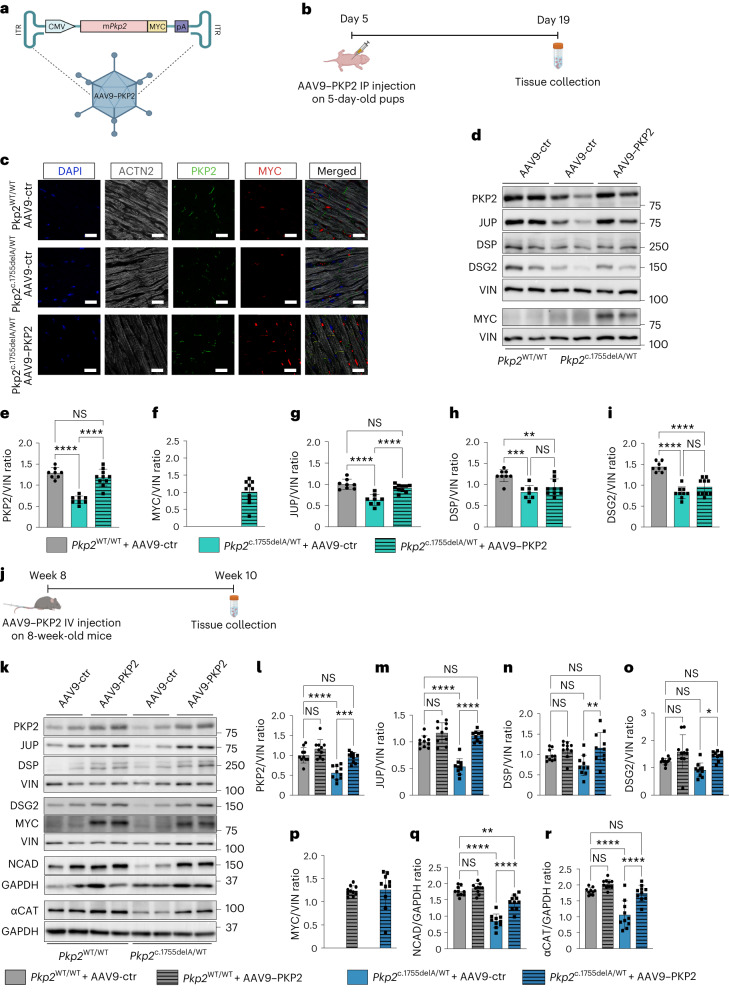
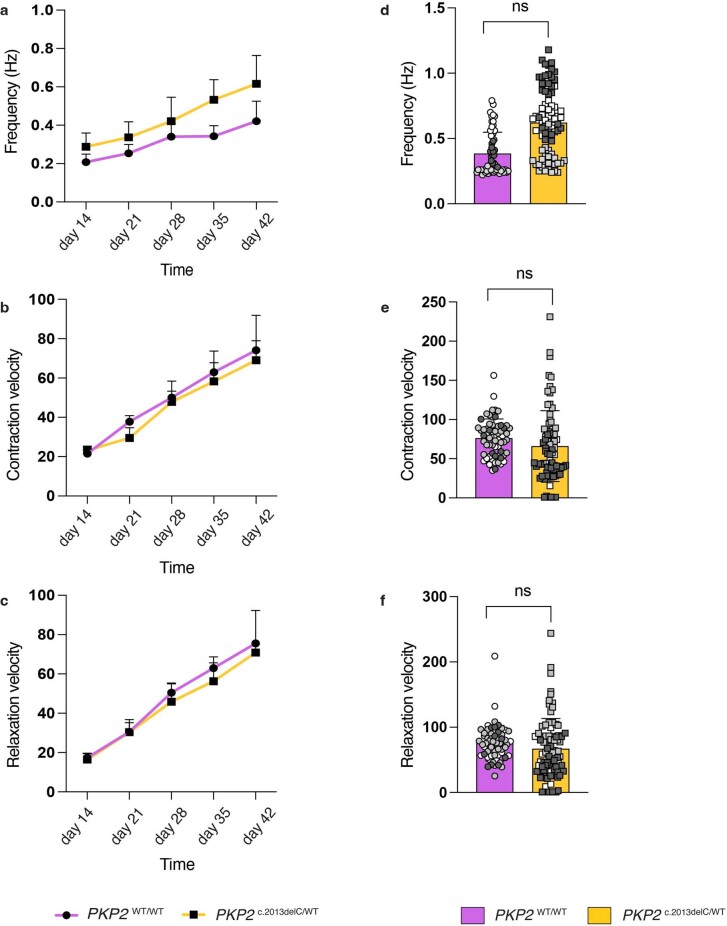
Arrhythmogenic cardiomyopathy is a severe cardiac disorder characterized by lethal arrhythmias and sudden cardiac death, with currently no effective treatment. Plakophilin 2 (PKP2) is the most frequently affected gene. Here we show that adeno-associated virus (AAV)-mediated delivery of PKP2 in PKP2c.2013delC/WT induced pluripotent stem cell-derived cardiomyocytes restored not only cardiac PKP2 levels but also the levels of other junctional proteins, found to be decreased in response to the mutation. PKP2 restoration improved sodium conduction, indicating rescue of the arrhythmic substrate in PKP2 mutant induced pluripotent stem cell-derived cardiomyocytes. Additionally, it enhanced contractile function and normalized contraction kinetics in PKP2 mutant engineered human myocardium. Recovery of desmosomal integrity and cardiac function was corroborated in vivo, by treating heterozygous Pkp2c.1755delA knock-in mice. Long-term treatment with AAV9-PKP2 prevented cardiac dysfunction in 12-month-old Pkp2c.1755delA/WT mice, without affecting wild-type mice. These findings encourage clinical exploration of PKP2 gene therapy for patients with PKP2 haploinsufficiency.

Keywords: Cardiomyopathies; Genetic vectors.


Conflict of interest statement

Competing interestsE.v.R. is a consultant for Tenaya Therapeutics and Novo Nordisk and is Chief Scientific Officer of Phlox Therapeutics. M.T., T.M. and W.H.Z. are inventors of patents related to the EHM technology and scientific advisors to myriamed GmbH. W.H.Z. is founder and shareholder of myriamed GmbH. M.G. is founder, consultant, member of the Board and equity holder in Purespring Therapeutics, Forcefield Therapeutics and Heqet Therapeutics. All other authors declare that they have no competing interests.

Figures

Fig. 1
Fig. 1. AAV-mediated restoration of PKP2 in PKP2c.2013delC/WT mutant iPS-cell-derived CMs results in molecular rescue of desmosomal assembly.
a, Graphical representation of the AAV expression cassette used in iPS-cell-derived CMs. ITR, Inverted Terminal Repeat Sequences. b, Timeline for AAV6–PKP2 transduction of iPS-cell-derived CMs. c, Representative immunoblots showing v.l.-dependent PKP2 protein levels in PKP2c.2013delC/WT mutant cells in response to AAV6-PKP2. v.l.1 = 0.5 × 103 v.g. per cell, v.l.2 = 5 × 103 v.g. per cell. Vinculin (VIN) was used as a loading control. d, Quantification of c, n = 4 technical replicates per condition. e, Representative immunoblots for PKP2, JUP, DSP, DSG2 and DSC2 in corrected and mutant iPS-cell-derived CMs upon transduction with AAV6-ctr or AAV6–PKP2. VIN was used as a loading control. f, Quantification of PKP2 protein levels. g, Quantification of JUP protein levels. h, Quantification of DSP protein levels. i, Quantification of DSC2 protein levels. j, Quantification of DSG2 protein levels. Colored dots represent distinct CM differentiation, n = 6 technical replicates and 3 biological replicates per condition. Data is presented as mean values ± s.e.m. Statistical significance is derived from biological replicates and determined with one-way ANOVA (Tukey’s post-hoc test), P value at ****P < 0.0001, ***P < 0.001, **P < 0.01, *P < 0.05, and not significant (NS). P values (from left to right): 0.0003, 0.91, 0.0004 (f); 0.0002, 0.3778, <0.0001 (g); <0.0001, <0.0001, 0.0007 (h); 0.0138, 0.0125, 0.9955 (j). Source data
Fig. 2
Fig. 2. AAV-mediated restoration of PKP2 in PKP2c.2013delC/WT mutant iPS-cell-derived CMs improves sodium conduction.
a, Graphical representation of the experimental workflow. be, Representative voltage-gated sodium currents activated by voltage steps to between −80 mV and −20 mV from a holding potential of −110 mV. Experimental groups: PKP2WT/WT + AAV6-ctr shown in b, PKP2WT/WT + AAV6-PKP2 shown in c, PKP2c.2013delC/WT + AAV6-ctr shown in d, PKP2c.2013delC/WT + AAV6-PKP2 shown in e. f, Graph showing the peak transient INa density for each experimental group. Colored dots represent distinct CM differentiation. PKP2WT/WT + AAV6-ctr: n = 39 single CMs (diff.1) + 48 single CMs (diff.2), PKP2WT/WT + AAV6–PKP2: n = 26 single CMs (diff.1) + 44 single CMs (diff.2), PKP2c.2013delC/WT + AAV6-ctr: n = 21 single CMs (diff.1) + 20 single CMs (diff.2), PKP2c.2013delC/W + AAV6–PKP2: n = 23 single CMs (diff.1) + 14 single CMs (diff.2). Data are presented as mean values ± s.e.m. Statistical significance was estimated with one-way ANOVA, Tukey correction with P value at ****P < 0.0001, ***P < 0.001, **P < 0.01, *P < 0.05, and not significant (NS). P values (f): PKP2WT/WT + AAV6-ctr versus PKP2c.2013delC/WT + AAV6-ctr = 0.0008; PKP2c.2013delC/WT + AAV6-ctr versus PKP2c.2013delC/WT + AAV6–PKP2 = 0.0930; PKP2WT/WT + AAV6-ctr versus PKP2c.2013delC/WT + AAV6–PKP2 = 0.7177. Source data
Fig. 3
Fig. 3. PKP2c.2013delC/WT mutant EHM exhibit impaired contractile function compared to the isogenic control.
a, Schematic overview of the generation of PKP2 EHM. b, Representative immunoblot for the desmosomal proteins PKP2, JUP and DSP. VIN is used as a loading control. c, Representative immunoblot for the desmosomal proteins DSC2 and DSG2. VIN is used a loading control. d, Quantification of PKP2 protein levels. e, Quantification of JUP protein levels. f, Quantification of DSP protein levels. g, Quantification of DSC2 protein levels. h, Quantification of DSG2 protein levels. Colored dots represent distinct CM differentiations, n = 6 technical replicates and 3 biological replicates per condition. Data are presented as mean values ± s.e.m. Statistical significance is derived by biological replicates and determined by unpaired, two-tailed Student’s t-test, P value at ****P < 0.0001, ***P < 0.001, **P < 0.01, *P < 0.05, and not significant (NS). i, Timeline for assessing contractility of PKP2WT/WT and PKP2c.2013delC/WT EHM. j, Trendline showing % pole bending as a measure of force of contraction for PKP2WT/WT and PKP2c.2013delC/WT EHM under baseline conditions at different time points. k, Trendline showing contraction time (from 20% to 80% contraction in ms) for PKP2WT/WT and PKP2c.2013delC/WT EHM under baseline condiitons at different time points. l, Trendline showing relaxation time (from 20% to 80% relaxation in ms) for PKP2WT/WT and PKP2c.2013delC/WT EHM under baseline conditions at different time points. Statistics: one-way ANOVA with Tukey’s post-hoc test was performed between all groups at each time point, n = 3 biological replicates (exact number for technical replicates is indicated on the figure). m, Graph displaying force of contraction (as % pole bending) for PKP2WT/WT and PKP2c.2013delC/WT EHM on day 42 of maturation. n, Graph displaying contraction time (ms) for PKP2WT/WT and PKP2c.2013delC/WT EHM on day 42 of maturation. o, Graph displaying relaxation time (ms) for PKP2WT/WT and PKP2c.2013delC/WT EHM on day 42 of maturation. Colored dots represent distinct CM differentiations, n = 3 biological replicates (PKP2WT/WT EHM: n = 17 (diff.1), 21 (diff.2) and 11 (diff.3) technical replicates. PKP2c.2013delC//WT EHM: n = 19 (diff.1), 23 (diff.2) and 30 (diff.3) technical replicates). Data are presented as mean values ± s.e.m. Statistical significance is derived from biological replicates and determined by unpaired, two-tailed Student’s t-test, P value at ****P < 0.0001, ***P < 0.001, **P < 0.01, *P < 0.05, and not significant (NS). P values: 0.0002 (d), <0.0001 (e), 0.010 (f), <0.0001 (g), 0.0003 (h), 0.095 (42-day time point) (j and m), 0.0176 (42-day time point) (k and n) and 0.059 (42-day time point) (l and o). Source data
Fig. 4
Fig. 4. AAV-mediated restoration of PKP2 in PKP2c.2013delC/WT EHM leads to an increase in desmosomal and junctional protein levels, which further translates into improved contractility.
a, Timeline for the AAV transduction and maturation of PKP2WT/WT and PKP2c.2013delC/WT EHM with either AAV6-ctr or AAV6–PKP2. b, Representative fluorescent image of 6-week-old EHM transduced with either AAV6-ctr (left) or AAV6–PKP2 fused with the mNeongreen fluorescent protein (right). Scale bar, 1 mm. This experiment was repeated independently three times with similar results. c, Representative immunoblots for PKP2, JUP, DSP, DSG2, NCAD and αCAT in 6-week-old PKP2WT/WT and PKP2c.2013delC/WT EHM, transduced either with AAV6-ctr or AAV6–PKP2. VIN was used as a loading control for the desmosomal proteins, whereas αTUB was used for the quantification of NCAD and αCAT. d, Quantification of PKP2 protein levels. e, Quantification of JUP protein levels. f, Quantification of DSP protein levels. g, Quantification of DSG2 protein levels. h, Quantification of NCAD protein levels. i, Quantification of αCAT protein levels. Colored dots represent distinct CM differentiations, n = 6 technical replicates and 3 biological replicates per condition. Data are presented as mean values ± s.e.m. Statistical significance is derived from biological replicates and determined by one-way ANOVA (Tukey’s post-hoc test), P value at ****P < 0.0001, ***P < 0.001, **P < 0.01, *P < 0.05, and not significant (NS). j, Trendline showing % pole bending as a measure of force of contraction for PKP2WT/WT and PKP2c.2013delC/WT EHM after AAV6 transduction at different time points. k, Trendline showing contraction time (from 20% to 80% contraction in ms) for PKP2WT/WT and PKP2c.2013delC/WT EHM after AAV6 transduction at different time points. l, Trendline showing relaxation time (from 20% to 80% relaxation in ms) for PKP2WT/WT and PKP2c.2013delC/WT EHM after AAV6 transduction at different time points. Statistics: one-way ANOVA with Tukey’s post-hoc test was performed between all groups at each time point, n = 3 biological replicates and 36 technical replicates per condition (12 tissues per CM differentiation). m, Graph summarizing force of contraction (% pole bending) for PKP2WT/WT and PKP2c.2013delC/WT EHM on day 42 of maturation. n, Graph summarizing contraction time (ms) for PKP2WT/WT and PKP2c.2013delC/WT EHM on day 42 of maturation. o, Graph summarizing relaxation time (ms) for PKP2WT/WTand PKP2c.2013delC/WT EHM on day 42 of maturation, n = 3 biological replicates and 36 technical replicates (12 tissues per condition). Data are presented as mean values ± s.e.m. Statistical significance is derived from biological replicates and determined by one-way ANOVA (Tukey’s post-hoc test), P value at ****P < 0.0001, ***P < 0.001, **P < 0.01, *P < 0.05, and not significant (NS). P value (PKP2c.2013delC/WT + AAV6-ctr versus PKP2c.2013delC/WT + AAV6–PKP2): 0.0010 (d), 0.0006 (e), 0.3638 (f), <0.0001 (g), 0.3156 (h), <0.0001 (i), 0.0033 (j and m), 0.0274 (k and n) and 0.0344 (l and o). Source data
Fig. 5
Fig. 5. AAV-mediated restoration of PKP2 in Pkp2c.1755delA/WT pups and adult mice leads to the recovery of desmosomal and non-desmosomal components of the ID.
a, Graphical representation of the AAV expression cassette used in mice, ITR=Inverted Terminal Repeat Sequences. b, Workflow followed after the intraperitoneal (IP) AAV9–PKP2 administration in Pkp2c.1755delA/WT and wild-type pups. c, Immunofluorescence on paraffin sections of mouse cardiac tissue showing localization of the exogenously introduced PKP2 in the injected hearts. DAPI, blue; ACTN2, gray; PKP2, green; MYC epitope, red; exogenous PKP2, yellow in merged image. Scale bar, 10 μm. This experiment was repeated independently 18 times (in 18 distinct mouse hearts) with the same results. d, Representative immunoblots for PKP2, MYC, JUP, DSP and DSG2 in Pkp2WT/WT and Pkp2c.1755delA/WT pups injected with either AAV9-ctr or AAV9–PKP2. VIN is used as a loading control. e, Quantification of PKP2 protein levels. f, Quantification of MYC protein levels. g, Quantification of JUP protein levels. h, Quantification of DSP protein levels. i, Quantification of DSG2 protein levels. Experimental groups: Pkp2WT/WT pups injected with AAV9-ctr n = 8, Pkp2c.1755delA/WT pups injected with AAV9-ctr n = 8, Pkp2c.1755delA/WT pups injected with AAV9–PKP2 n = 10. j, Workflow followed after the intravenous (IV) AAV9–PKP2 administration in Pkp2c.1755delA/WT and wild-type adult mice. k, Representative immunoblots for the desmosomal PKP2, MYC, JUP, DSP and DSG2 and NCAD and αCAT in Pkp2WT/WT and Pkp2c.1755delA/WT mice injected with either AAV9-ctr or AAV9–PKP2. VIN is used as a loading control for the desmosomal proteins, whereas GAPDH is used for the quantification of NCAD and αCAT. l, Quantification of PKP2 protein levels. m, Quantification of JUP protein levels. n, Quantification of DSP protein levels. o, Quantification of DSG2 protein levels. p, Quantification of MYC protein levels. q, Quantification of NCAD protein levels. r, Quantification of αCAT protein levels. Experimental groups: Pkp2WT/WT mice injected with AAV9-ctr n = 10, Pkp2WT/WT mice injected with AAV9–PKP2 n = 10, Pkp2c.1755delA/WT mice injected with AAV9-ctr n = 10, Pkp2c.1755delA/WT mice injected with AAV9–PKP2 n = 10. Data are presented as mean values ± s.e.m. Statistical significance is determined by one-way ANOVA (Tukey’s post-hoc test), P value at ****P < 0.0001, ***P < 0.001, **P < 0.01, *P < 0.05, and not significant (NS). P value (Pkp2c.1755delA/WT + AAV9-ctr versus Pkp2c.1755delA/WT + AAV9-PKP2): <0.0001 (e), <0.0001 (g), 0.3461 (h), 0.1607 (i), 0.002 (l), <0.0001 (m), 0.029 (n), 0.0122 (o), <0.0001 (q) and <0.0001 (r). Source data
Fig. 6
Fig. 6. A single dose of AAV9-PKP2 in 8-week-old Pkp2c.1755delA/WT mice prevents cardiac dysfunction at 12 months of age.
a, Timeline for intravenous AAV9–PKP2 administration in Pkp2c.1755delA/WT and long-term monitoring of cardiac function in adult mice. b, Immunofluorescence on paraffin sections of mouse cardiac tissue showing localization of the exogenously introduced PKP2 in the injected hearts. DAPI, blue; ACTN2, gray; PKP2, green; MYC epitope, red; exogenous PKP2, yellow in merged image. Scale bar, 10 μm. This experiment was performed independently ten times (in ten distinct mouse hearts) with the same results. c, Representative immunoblots for PKP2, MYC, JUP, DSP and DSG2 in Pkp2WT/WT and Pkp2c.1755delA/WT mice injected with either AAV9-ctr or AAV9–PKP2. VIN is used as a loading control. d, Quantification of PKP2 protein levels. e, Quantification of MYC protein levels. f, Quantification of JUP protein levels. g, Quantification of DSP protein levels. h, Quantification of DSG2 protein levels. Experimental groups: Pkp2WT/WT mice injected with AAV9-ctr n = 8, Pkp2WT/WT mice injected with AAV9–PKP2 n = 8, Pkp2c.1755delA/WT mice injected with AAV9-ctr n = 8, Pkp2c.1755delA/WT mice injected with AAV9–PKP2 n = 8. i, Graph showing EF in Pkp2WT/WT and Pkp2c.1755delA/WT mice injected with either AAV9-ctr or AAV9-PKP2. j, Graph showing IVRT in Pkp2WT/WT and Pkp2c.1755delA/WT mice injected with either AAV9-ctr or AAV9-PKP2. k, Graph showing E/A ratio in Pkp2WT/WT and Pkp2c.1755delA/WT mice injected with either AAV9-ctr or AAV9–PKP2. These measurements correspond to 12-month-old mice. Data are presented as mean values ± s.e.m. Statistical significance is determined by one-way ANOVA (Tukey’s post-hoc test), P value at ****P < 0.0001, ***P < 0.001, **P < 0.01, *P < 0.05, and not significant (NS). P value (Pkp2c.1755delA/WT + AAV9-ctr versus Pkp2c.1755delA/WT + AAV9-PKP2): 0.0101 (d), 0.0394 (f), 0.0052 (g), 0.0134 (h), 0.5622 (i), 0.0053 (j) and <0.0001 (k). Source data
Extended Data Fig. 1
Extended Data Fig. 1. AAV-mediated restoration of PKP2 in PKP2c.2013delC/WT mutant iPS-cell-derived CMs does not affect the mRNA levels of desmosomal proteins.
a-e, Gene expression of PKP2, JUP, DSP, DSG2 and DSC2 in Pkp2c.2013delC/WT iPS-cell-derived CMs upon transduction with either AAV6-ctr or AAV6-PKP2. As a reference, the PKP2 corrected iPS-cell-derived CM line was transduced with AAV6-ctr. Values were normalized to GUS. n = 3 biological replicates (distinct CM differentiations) and 6 technical replicates per differentiation. Data is presented as mean +/− s.e.m. Statistical significance is derived from biological replicates and is determined with one-way ANOVA (Tukey’s post-hoc test), p-value at ****P < 0.0001, ***P < 0.001, **P < 0.01, *P < 0.05, and not significant (ns). Exact P-value for panel (a) is < 0.0001 for all comparisons. Source data
Extended Data Fig. 2
Extended Data Fig. 2. PKP2 restoration in iPS-cell-derived CMs harboring the pathogenic variant PKP2 c.1845C < T, leads to a recovery of JUP and DSP protein levels.
a, Representative immunoblots for PKP2, JUP and DSP in PKP2c.1845C<T/WT iPS-cell CMs upon transduction with AAV6-ctr or AAV6-PKP2. VIN was used as a loading control. b-d, Quantification of (a), n = 3 biological replicates (distinct differentiations) and 6, 3 and 3 technical replicates per differentiation respectively. Data is presented as mean +/− s.e.m. Statistical significance is derived from biological replicates and is determined with one-way ANOVA (Tukey’s post-hoc test) with p-value at ****P < 0.0001, ***P < 0.001, **P < 0.01, *P < 0.05, and not significant (ns). P-values (PKP2c.1845C<T/WT+ AAV6-ctr vs PKP2c.1845C<T/WT+ AAV6-PKP2): (b) = 0.016, (c) = 0.0366, (d) = 0.0016. Source data
Extended Data Fig. 3
Extended Data Fig. 3. The PKP2 mutant EHM exhibit similar structural and intercellular junction organization as its isogenic control.
a, Representative brightfield images of 6-week-old mutant and isogenic control EHM under baseline. Scale bar is at 1mm. b, On the left side: representative overview immunofluorescent staining of a paraffin-embedded EHM section. Scale bar is at 500μm. On the right side: representative high magnification fluorescent images of the same EHM section to show cardiomyocyte and fibroblast regions within the tissue. DAPI = blue, VIM = magenta, ACTN2 = green. Scale bar is at 20μm. c, Gene expression of ACTN2, VIM, DCN and NPPB on the mutant tissues compared to the isogenic control. Data is normalized to the housekeeping gene GUS. Colored dots represent distinct CM differentiations, n = 6 technical replicates and 3 biological replicates per condition. Data is presented as means +/− s.e.m. Statistical significance is derived from biological replicates and is determined by unpaired, two-tailed Student t-test, p-value at *****P < 0.0001, ***P < 0.001, **P < 0.01, *P < 0.05, and not significant (ns). ACTN2: P-value = 0.0077, VIM: P-value < 0.0001, DCN: P-value = 0.1033, NPPB: P-value = 0.0401. d, On the left column: representative images of a Masson’s trichrome staining on paraffin-embedded EHM. Collagen = blue, muscle = red and nuclei = brown. On the right column: representative immunofluorescent images from paraffin-embedded EHM. ACTN2 = magenta, VIM = green and DAPI = in blue. Scale bar is at 500 μm. e, Quantification of the Masson’s trichrome staining in (d). Each dot represents a mouse. Data is presented as means +/− s.e.m. Statistical significance is determined by unpaired, two-tailed Student t-test, p-value at ****P < 0.0001, ***P < 0.001, **P < 0.01, *P < 0.05, and not significant (ns). f, Representative immunofluorescent images displaying the intercalated disc (ID) structure on EHM. NCAD = green, PKP2 = red, DES = gray and DAPI = blue. Scale bar is at 20μm and at 10μm for the zoomed image on the top right. Pink arrowheads indicate a representative ID-like structure on a cardiomyocyte. This experiment has been performed three times independently with similar results. Source data
Extended Data Fig. 4
Extended Data Fig. 4. PKP2c.2013delC/WT EHM do not exhibit an altered beating frequency, contraction velocity and relaxation velocity compared to control.
a-c, Trendlines showing beating frequency (Hz), contraction velocity and relaxation velocity in PKP2 WT/WT and PKP2c.2013delC/WT EHM at different timepoints after transduction with either AAV6-PKP2 or AAV6-ct, n = 3 biological replicates (three distinct EHM batches). d-f, Graphs displaying beating frequency (Hz), contraction velocity and relaxation velocity in PKP2 WT/WT and PKP2c.2013delC/WT EHM after transduction with either AAV6-PKP2 or AAV6-ctr, on day 42 of maturation, n = 3 biological replicates (three distinct EHM batches), batch 1 = 17 isogenic control and 19 mutant tissues, batch 2 = 32 isogenic control and 27 mutant tissues and batch 3 = 11 isogenic control and 30 mutant tissues. Data is presented as means +/− s.e.m. Statistical significance is derived by biological replicates and is determined by unpaired, two-tailed Student t-test p-value at ****P < 0.0001, ***P < 0.001, **P < 0.01, *P < 0.05, and not significant (ns). Source data
Extended Data Fig. 5
Extended Data Fig. 5. AAV-PKP2 treatment does not alter desmocollin levels in PKP2c.2013delC/WT EHM.
a, Representative immunoblots for DSC2 on PKP2 mutant and isogenic control EHM upon transduction with either AAV-ctr or AAV-PKP2. b, Quantification of (a). Colored dots represent distinct batches of differentiation, n = 4 technical replicates and 3 biological replicates. Data is presented as means +/− s.e.m. Statistical significance is derived by biological replicates and determined by one-way ANOVA (Tukey’s post-hoc test) with p-value at ****P < 0.0001, ***P < 0.001, **P < 0.01, *P < 0.05, and not significant (ns). P-value = 0.0821. Source data
Extended Data Fig. 6
Extended Data Fig. 6. AAV9 transduces cardiomyocytes in vivo with high efficiency and with minor ectopic expression.
a, Immunofluorescence on cardiac sections of mice transduced with AAV9-tdTOM to facilitate transduction efficiency assessment. Nuclei = DAPI, ACTN2 = green, tdTOM = magenta. Scale bar is at 20μm. b, Quantification of (a), n = 5 hearts, 10 regions per heart were assessed. c-d, Immunoblot for MYC and PKP2 on protein lysates of different mouse tissues. VIN was used as a loading control. e, Quantification of (d), n = 5 mice per condition. Data is presented as means +/− s.e.m. Source data
Extended Data Fig. 7
Extended Data Fig. 7. DSC2 is not consistently responsive to PKP2 restoration in the Pkp2c.1755delA/WT murine models.
a, c, e, Representative immunoblots for DSC2 in pups (n = 8,8 and 10 mice per group), 2-month-old (n = 10 mice per group) and 12-month-old mice (n = 8 mice per group) treated with AAV9-ctr or AAV9-PKP2. b, d, f, Quantification of each of the blots respectively. GAPDH has been used as a loading control for the quantification of the blots. Data is presented as mean +/− s.e.m. Statistical significance is determined by one-way ANOVA (Tukey’s post-hoc test) with p-value at ****P < 0.0001, ***P < 0.001, **P < 0.01, *P < 0.05, and not significant (ns). P-value (f) = 0.0017. Source data
Extended Data Fig. 8
Extended Data Fig. 8. The exogenously delivered PKP2 specifically localizes at the ID of cardiomyocytes together with more junctional proteins.
Representative immunofluorescent images of the exogenous-specific marker MYC colocalizing βCAT (top row), DSP (middle row) and NCAD (bottom row). Scale bar is at 20μm. This experiment has been repeated independently 10 times (in 10 distinct mouse hearts) with similar results.
Extended Data Fig. 9
Extended Data Fig. 9. AAV-mediated overexpression of Pkp2 does not cause an overt adverse cardiac phenotype in Pkp2WT/WT 12-month-old mice.
a-d, Trendlines showing % ejection fraction, left ventricle mass (LV mass), left ventricle end diastolic volume (LVEDV), left ventricle end systolic volume (LVESV) and in Pkp2 WT/WT and Pkp2c.1755delA/WT mice treated with either AAV9-PKP2 or AAV9-ctr at baseline (2 months old), 2 months (4 months old), 6 months (8 months old) and 10 months (12 months old) post injection, n = 8 mice per condition. e, Heart weight (HW) to body weight (BW) ratio in Pkp2WT/WT and Pkp2c.1755delA/WT mice treated with either AAV9-PKP2 or AAV9-ctr, n = 8 mice per group. f, Heart weight to tibia length (TL) ratio in Pkp2WT/WT and Pkp2c.1755delA/WT mice treated with either AAV9-PKP2 or AAV9-ctr, n = 8 mice per group. Data is presented as means +/− s.e.m. Statistical significance is determined by one-way ANOVA (Tukey’s post-hoc test), p-value at ****p < 0.0001, ***p < 0.001, **p < 0.01, *p < 0.05, and not significant (ns). Source data

Comment in

References

    1. Pilichou K, et al. Arrhythmogenic cardiomyopathy. Orphanet J. Rare Dis. 2016;11:33. doi: 10.1186/s13023-016-0407-1. - DOI - PMC - PubMed
    1. Sen-Chowdhry S, et al. Mutational heterogeneity, modifier genes, and environmental influences contribute to phenotypic diversity of arrhythmogenic cardiomyopathy. Circ. Cardiovasc. Genet. 2010;3:323–330. doi: 10.1161/CIRCGENETICS.109.935262. - DOI - PubMed
    1. Basso C, Corrado D, Bauce B, Thiene G. Arrhythmogenic right ventricular cardiomyopathy. Circ. Arrhythm. Electrophysiol. 2012;5:1233–1246. doi: 10.1161/CIRCEP.111.962035. - DOI - PubMed
    1. Giuliano K, et al. Heart transplantation outcomes in arrhythmogenic right ventricular cardiomyopathy: a contemporary national analysis. ESC Heart Fail. 2022;9:988–997. doi: 10.1002/ehf2.13687. - DOI - PMC - PubMed
    1. Marcus FI, et al. Diagnosis of arrhythmogenic right ventricular cardiomyopathy/dysplasia: proposed modification of the Task Force Criteria. Eur. Heart J. 2010;31:806–814. doi: 10.1093/eurheartj/ehq025. - DOI - PMC - PubMed