. 2023;2(7):673-692.
doi: 10.1038/s44161-023-00294-y. Epub 2023 Jul 13.

Outlining cardiac ion channel protein interactors and their signature in the human electrocardiogram

Affiliations

Outlining cardiac ion channel protein interactors and their signature in the human electrocardiogram

Svetlana Maurya et al. Nat Cardiovasc Res. 2023.

Abstract

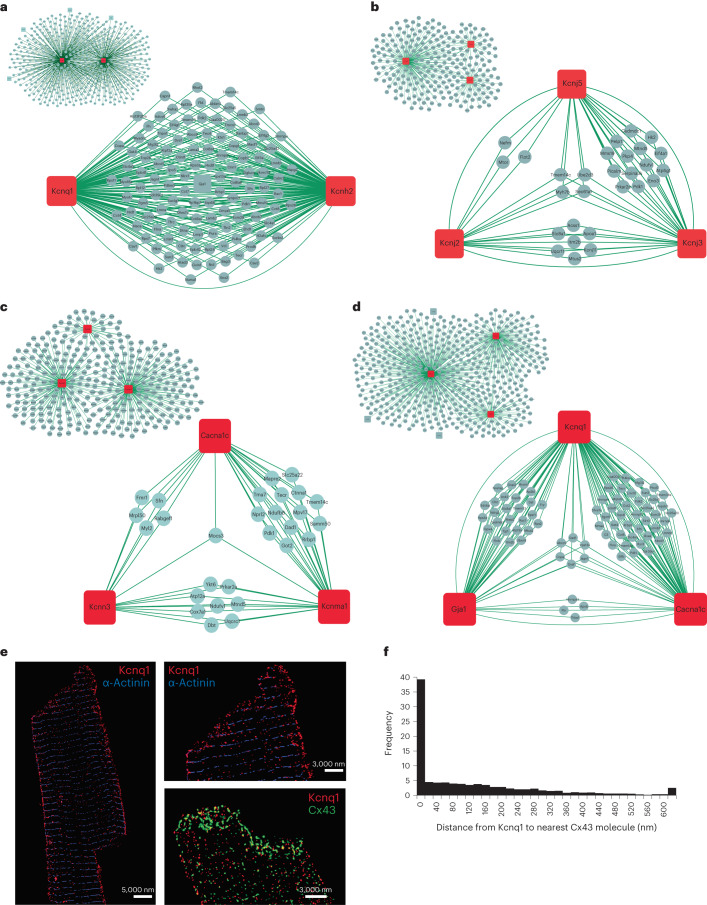
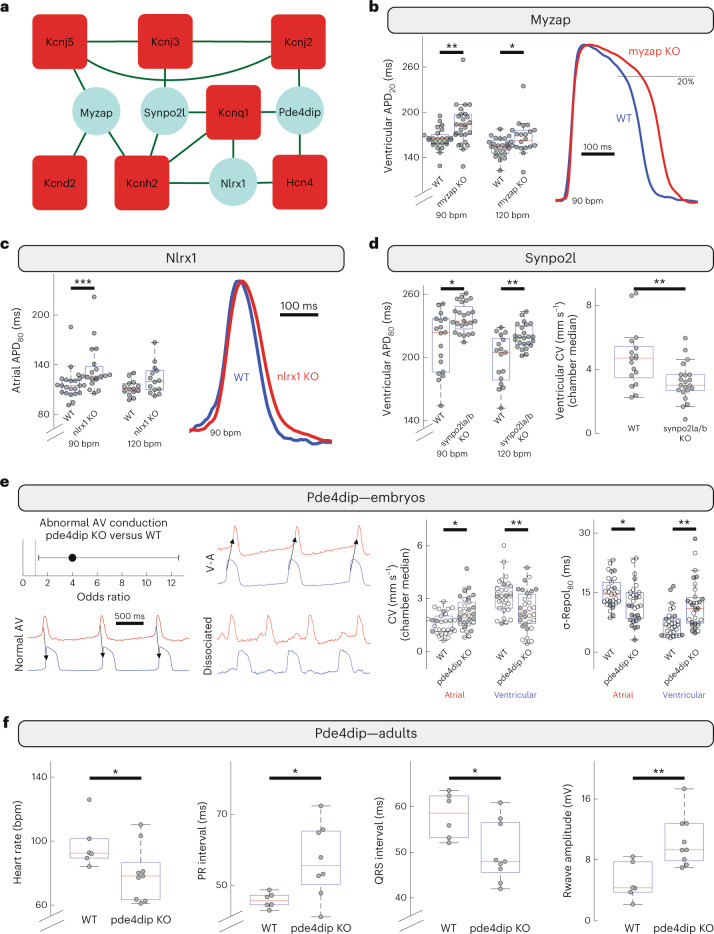
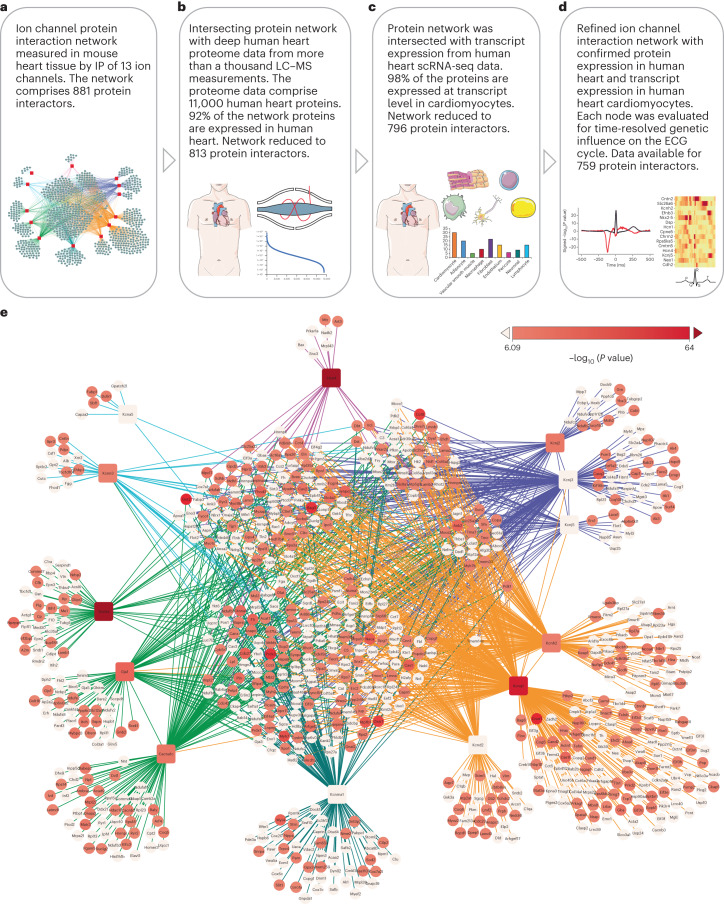
Protein-protein interactions are essential for normal cellular processes and signaling events. Defining these interaction networks is therefore crucial for understanding complex cellular functions and interpretation of disease-associated gene variants. We need to build a comprehensive picture of the interactions, their affinities and interdependencies in the specific organ to decipher hitherto poorly understood signaling mechanisms through ion channels. Here we report the experimental identification of the ensemble of protein interactors for 13 types of ion channels in murine cardiac tissue. Of these, we validated the functional importance of ten interactors on cardiac electrophysiology through genetic knockouts in zebrafish, gene silencing in mice, super-resolution microscopy and patch clamp experiments. Furthermore, we establish a computational framework to reconstruct human cardiomyocyte ion channel networks from deep proteome mapping of human heart tissue and human heart single-cell gene expression data. Finally, we integrate the ion channel interactome with human population genetics data to identify proteins that influence the electrocardiogram (ECG). We demonstrate that the combined channel network is enriched for proteins influencing the ECG, with 44% of the network proteins significantly associated with an ECG phenotype. Altogether, we define interactomes of 13 major cardiac ion channels, contextualize their relevance to human electrophysiology and validate functional roles of ten interactors, including two regulators of the sodium current (epsin-2 and gelsolin). Overall, our data provide a roadmap for our understanding of the molecular machinery that regulates cardiac electrophysiology.

Keywords: Cardiovascular biology; Data integration; Protein analysis; Proteomics.


Conflict of interest statement

Competing interestsThe authors declare no competing interests.

Figures

Fig. 1
Fig. 1. MS evaluation of cardiac ion channel IPs.
a, Workflow of the study. We performed MS measurements of immunoprecipitated channels and their interactors and of control IPs from quadruplicate murine cardiac tissue lysates. Deep proteome measurements of the membrane-enriched mouse heart samples utilized in the IP experiments were also performed. Bioinformatics network analyses prioritized interactors for functional evaluation. A subset of interactors were evaluated for their functional impact on cardiac electrophysiology by STORM imaging, optical mapping in zebrafish KOs, and patch clamping of cardiomyocytes from mice with interactor genes silenced. From multi-omics data integration, the impact of each interactor in human electrophysiology is evaluated. b, Dendrogram from unsupervised hierarchical cluster analysis of protein intensities of proteins identified in IP experiments show that the four replicate experiments all cluster together. The clustering follows the bait replicates. c, Pearson correlation coefficients for protein intensities of the four Cacna1c replicate pulldown experiments. Pearson correlation coefficients are indicated in each scatter plot. Parts of the figure were drawn by using pictures from Servier Medical Art. Servier Medical Art by Servier is licensed under a Creative Commons Attribution 3.0 Unported License (https://creativecommons.org/licenses/by/3.0/). Source data
Fig. 2
Fig. 2. Volcano plot representation for analysis of significant interactors for each channel bait.
Volcano plots for each ion channel bait. a, Cacna1c. b, Kcnma1. c, Kcnn3. d, Kcnq1. e, Kcnh2. f, Kcnj5. g, Kcnj3. h, Kcnj2. i, Kcnd2. j, Kcna5. k, Gja1. l, Hcn4. m, Scn5a. All dots represent a protein, where the negative logarithm (base 10) of t-test-derived P value is shown as a function of logarithmic (base 2) ratios of protein intensities in bait pulldowns relative to controls. The control comparator is based on median protein intensities across 64 IP experiments, IgG pulldowns and scaled proteome measurements as well as imputation, and the black line indicates an FDR-based cutoff that considers the fold change difference of protein intensities to demarcate the specific from nonspecific interactors. The claim to significance was based on FDR of a two-sided t-test and s0 value (s0 controls the relative importance of t-test-based P value and difference between means). For details, see Extended Data Fig. 2b and Supplementary Table 2. Proteins shown as light-blue dots represent specific interactors for the bait, red dot is the bait protein itself, dark-blue dot represents interactors with previously reported functional influence on the bait, and yellow dots are protein interactors that we have prioritized for functional investigations based on evaluation of the acquired MS data. Source data
Fig. 3
Fig. 3. Functional evaluation of channel interactors by gene knock out in zebrafish.
The functional consequences after acute KO of six interactors of three major ion channels—Kcnq1 (Nebl and Nrap), Cacna1c (Inf2) and Scn5a (Glipr2, Epn2 and Gsn)—were evaluated in zebrafish. a, Compared with control siblings (WT, n = 16 fish), KO of the gene encoding Kcnq1-interacting nebl (nebl KO, n = 23) led to prolongation of the ventricular action potential starting shortly after the plateau, with the greatest effect size at slower heart rate and later in repolarization (APD80, action potential duration measured at 80% recovery; bpm, beats per minute; **P = 8.4 × 10−3; *P = 0.037 by two-sided Mann–Whitney U test; exemplar amplitude-normalized optical action potentials shown below), reduced ventricular CV (sinus rhythm; **P = 4.2 × 10−3 by idem; exemplar relative activation time maps are zero-referenced to activation of the AV-Ring; white stars indicate area of global earliest activation, isochrones denote 5 ms intervals), and increased spatial dispersion of repolarization (σ-Repol80, standard deviation of repolarization time at 80% recovery across the chamber; sinus rhythm; **P = 8.74 × 10−3, idem; in exemplar relative repolarization80 time maps, each chamber is zero-referenced to median repolarization time). b, KO of Kcnq1-interacting nrap (n = 29) led to prolongation of ventricular action potential with greatest effect size in early repolarization (APD20) and at faster heart rates (*P = 0.016; **P = 5.22 × 10−3, idem, nWT = 27). c, Knockdown of Cacna1c-interacting inf2 (n = 10) caused a significant decrease in ventricular CV (***P = 7.2 × 10−4, idem, nWT = 7). d, KO of Scn5a-interacting glipr2/glipr2l (n = 14) decreased ventricular CV (*P = 0.013) and rate of the action potential upstroke (Vmax; ***P = 2.61 × 10−4, exemplar amplitude normalized action potential upstrokes shown) as well as increasing ventricular APD (**P = 2.7 × 10−3, all by idem, nWT = 9). e, KO of Scn5a-interacting epn2 (n = 16) resulted in decreased ventricular CV (*P = 0.020) and increased ventricular APD80 (*P = 0.035, idem, nWT = 18). f, Decrease in ventricular CV was also observed after KO of Scn5a-interacting gsna/b (n = 11, *P = 0.027, idem, nWT = 10). Each point in the box plots corresponds to an individual zebrafish embryo. Box plots indicate 25th/50th/75th percentiles, while whiskers extend to the most extreme data within 1.5× of interquartile range beyond box limits. Source data
Fig. 4
Fig. 4. shRNA silencing of sodium channel interactors, Epn2 and Gsn, increase sodium current density in mouse ventricular cardiomyocytes.
a, Voltage clamp protocol (top) and representative sodium current (INa) traces measured from adult cardiomyocytes expressing only GFP (GFP; bottom left) or GFP as well as shRNA for Epn2 (Epn2 knockdown (KD); bottom right). b, Current (I) to voltage (Vm) relationship of INa obtained from cardiomyocytes that were not injected (‘control’; solid circles), expressing only GFP (GFP; open squares) or from expressing GFP and shRNA for Epn2 (Epn2 KD; open diamonds). The data show increased peak sodium current density in Epn2 KD (*P = 0.014, linear mixed-effects analysis followed by Bonferroni post hoc analysis for multiple comparison testing). c, Sodium current activation measured for Epn2 KD, GFP or uninjected controls. d, Representative INa traces in GFP-expressing cardiomyocytes (bottom left) and in Gsn2 KD cardiomyocytes (bottom right). e, I to Vm relationship of INa for Gsn KD cardiomyocytes compared to that of controls (maximum sodium current trending to be increased for Gsn KD, P = 0.181, linear mixed-effects analysis followed by post hoc Bonferroni correction). f, INa activation curves. The activation curve is negatively shifted in Gsn KD cardiomyocytes compared to that of myocytes expressing only GFP (V1/2,Gsn KD = −57.4 ± 0.63 mV; V1/2,GFP = −53.4 ± 0.95 mV, *P = 0.037 linear mixed-effects analysis, followed by Bonferroni post hoc analysis for multiple comparison tests, control: n = 10 cells obtained from 3 mice; GFP: n = 9 cells obtained from 3 mice; Epn2 KD: n = 9 cells obtained from 4 mice; Gsn KD: n = 8 cells obtained from 4 mice; data are presented as mean ± standard error of the mean). g, Two-color STORM images for Scn5a (green) and Gsn (red) show 30% of Gsn clusters localizing within 20 nm of Scn5a clusters, 15 cells obtained from 3 mice in independent experiments. ‘Control’ are cardiomyocytes isolated from WT animals. ‘GFP’ are cardiomyocytes isolated from animals injected with an empty AAV vector. ‘Epn2 KD’ are cardiomyocytes isolated from mice with Epn2 silencing and ‘Gsn KD’ from mice with Gsn silencing. Multiple animals per group were necessary due to the limited number of datapoints that can be obtained from a single animal. Source data
Fig. 5
Fig. 5. Inter-channel networks. Networks of shared proteins between channels found to interact.
ad, Kcnq1 and Kcnh2 (a), between Kcnj2, Kcnj3 and Kcnj5 (b), between Cacna1c, Kcnn3 and Kcnma1 (c), and between Kcnq1, Gja1 and Cacna1c (d). The inset panels show all shared interactors for these channels. The bait proteins are shown in red squares and the interactors in light-blue circles. Measured interactions are indicated by lines. Note the interactions between channel proteins. e, STORM images of murine cardiomyocytes for Kcnq1 (red) and Gja1 (green). α-Actinin shown in blue as a control. f, Quantification of images as those shown in e shows that 40% of Kcnq1 clusters localize within 20 nm from Gja1 clusters. Twenty cells were examined over three mice in independent experiments. Source data
Fig. 6
Fig. 6. Functional evaluation of interactors shared across multiple channel networks.
Four proteins that each interact with three different ion channels were functionally investigated. a, Interactions identified for Myzap, Nlrx1, Pde4dip and Synpo2l. Bait proteins are shown in red, interactors in light blue and interactions in green. b, Acute KO in zebrafish of the gene encoding myzap (n = 25 fish) resulted in prolonged ventricular APD (APD20; **P = 2.85 × 10−3; *P = 0.018 by two-sided Mann–Whitney U test; exemplar amplitude-normalized optical action potentials shown) compared to control siblings (WT, n = 25). c, KO of nlrx1 (n = 21) mainly affected atrial APD, with a greater effect size in late repolarization (APD80) and at slower heart rates (nWT = 21, ***P = 7.64 × 10−4 by idem; exemplar amplitude normalized optical action potentials shown). d, KO of synpo2la/b (n = 23) led to prolonged ventricular APD at multiple paced heart rates with greatest effect size late in repolarization (nWT = 17, *P = 0.014; **P = 5.04 × 10−3, idem) and reduced ventricular CV (sinus rhythm; **P = 0.015, idem). e, KO of pde4dip (n = 30) resulted in hearts more prone to abnormal AV conduction (nWT = 30, odds ratio and 95% CI shown; P = 0.029 by Fisher’s exact test; exemplars show normal atrioventricular conduction versus retrograde conduction or AV dissociation), decreased ventricular CV and increased spatial dispersion of ventricular repolarization (standard deviation of repolarization time across the chamber), but with inverted effects in the atrial chamber (intrinsic rhythm; CV: *P = 6.24 × 10−3; **P = 5.86 × 10−3; σ-Repol80: *P = 0.013; **P = 1.66 × 10−4, idem). This reduces the differential between the chambers, which was observed in pde4dip-deficient fish with both abnormal AV conduction (filled markers) and normal (open markers). This suggests episodic abnormal AV conduction resulting in electrical remodeling with persisting effects during periods of normal AV conduction. f, In adult zebrafish, pde4dip deficiency (n = 9) resulted in slower heart rate (*P = 0.049), longer PR and shorter QRS intervals (*P = 0.029 and P = 0.036, respectively), and greater R wave magnitude (**P = 0.0095, all by idem, nWT = 6). Each point in the box plots corresponds to an individual zebrafish. Box plots indicate 25th/50th/75th percentiles, while whiskers extend to the most extreme data within 1.5× of interquartile range beyond box limits. Source data
Fig. 7
Fig. 7. Network nodes associated with genetic influence on human heart ECG.
a, We constructed a combined protein–protein interaction network of all 13 channel interactomes, which in total comprise 881 protein interactors. Channel bait proteins are shown in red squares, interactors in gray-blue circles. Edges are colored to indicate clusters of ion channels that contribute to similar electrophysiological components. b, The network from a was filtered for proteins that were measured in human heart samples by analyzing more than a thousand MS-based proteomics measurement files from human heart samples. Ninety-two percent of the proteins in the network were identified in the human heart samples (details in Supplementary Fig. 4a and Supplementary Table 9). c, We utilized human heart single-nucleus RNA sequencing data to determine which of the interactors were expressed in human cardiomyocytes. We found evidence of expression for 98% of the interactors (details in Supplementary Fig. 4b and Supplementary Table 9). d, The remaining 796 human heart, cardiomyocyte-expressed, interactors were evaluated using ECG plotter tool. For each protein, this generates a time series of associations across the ECG cycle. For each protein, we report the most significant association. e, Refined network of the 13 channel bait proteins and their human heart-cardiomyocyte-expressed interactors. Bait proteins are depicted in squares, interactors in circles. The color of the nodes indicates the significance of the influence on the ECG as determined by ECG plotter. A darker red color indicates a more significant association. The 340 proteins with a significant influence (P < 8.23 × 10−7 resulting network supports the notion that the combined ion channel network is enriched for proteins that influence the cardiac ECG. GWAS P values were extracted from Verweij et al. and adjusted for multiple comparisons (details in Methods and Source Data Fig. 7). Parts of the figure were drawn by using pictures from Servier Medical Art. Servier Medical Art by Servier is licensed under a Creative Commons Attribution 3.0 Unported License (https://creativecommons.org/licenses/by/3.0/). Source data
Extended Data Fig. 1
Extended Data Fig. 1. Immunoblot validation of bait immunoprecipitations.
Immunoprecipitated channels Scn5a a), Kcnq1 b), and Cacna1c c) evaluated by western blot. d) Inf2 (Cacna1c interactor) was immunoprecipitated from murine cardiac tissue and evaluated by western blotting for the presence of Cacna1c (left panel, probed with IRDye 800CW secondary antibody) to confirm co-immunoprecipitation with Inf2. The same blot was evaluated for presence of Inf2 (right panel, probed with IRDye 680LT secondary antibody) to ensure that Inf2 was immunoprecipitated. In all the panels, black arrows denote the band of interest. The lowermost arrow in Panel B shows the Kcnq1 monomer band and the higher order oligomers are shown by the upper arrows. UF denotes unbound fraction of the immunoprecipitation (IP) experiment. The immunoblot validation was carried out thrice for panels A-C and twice for panel D with reproducible results. e) LC-MS/MS analysis of Inf2 IPs evaluating Cacna1c (left) and Inf2 protein abundances (right). Triplicate immunoprecipitations were performed from murine cardiac tissue using antibodies against Inf2 or IgG. Precipitated proteins were evaluated by mass spectrometry. Inf2 was abundantly present in the three Inf2 IPs and was absent in the triplicate IgG control Ips (right). The calcium channel protein Cacna1c was identified in all six immunoprecipitations but was a hundred-fold more abundant in the Inf2 IPs than in the control IPs (left). Source data
Extended Data Fig. 2
Extended Data Fig. 2. Correlation coefficients and imputation strategy for mass spectrometry data.
a) Heat map visualizing Pearson correlation coefficients for all measured protein intensities across all experiments. The experiments were carried out in quadruplicates (named as _01, _02, _03, _04) and the figure shows the Pearson correlation values between all the baits and their replicates calculated from the log2 transformed raw intensities of all identified proteins. The darker shade of blue indicates a higher Pearson correlation. The numbers in blue on the right side depict the mean Pearson correlation coefficient for each set of four replicates per bait IP. b) Distributions showing the source of protein intensities used in the comparative analysis of each control. As seen, most data come from the median of all measured IP experiments. If no value was present in the median value, a value was used from control IgG pulldown experiments. If no value was available from both the above sources, a scaled proteome measurement was imputed. And in the few cases where no value was obtainable from the proteome either, the value was imputed from a left shifted normal distribution. Source data
Extended Data Fig. 3
Extended Data Fig. 3. Previously reported interaction partners.
Interaction network of a) Kcnq1. b) Kcnh2. c) Cacna1c. d) Kcnma1. e) Kcnj5. f) Kcnn3. g) Kcnj2. h) Hcn4. i) Kcna5. j) Kcnj3. k) Kcnd2. l) Gja1. m) Scn5a (baits shown in red squares) with their previously reported interaction partners (shown in red circles). The networks wherein there are more than one red square, the centre protein is the bait. The gray circles/squares represent the novel interaction partners identified in this study.
Extended Data Fig. 4
Extended Data Fig. 4. Exemplar ECGs from adult zebrafish gene knockouts (KO) and their wildtype (WT) siblings.
Signal-average trace (black) overlaid R-aligned traces from individual beats (green). a) Nrap knockout ECGs displayed repolarization abnormalities such that T-waves were not discernible from signal noise (red underscored period). b) ECGs from inf2 knockout fish had continued rising activity throughout the PR segment without achieving an isoelectric level as typically seen in wildtype or other knockouts (red underscored period). c) ECGs from pde4dip knockout fish displayed greater variance in signal waveform between individual beats showing substantial deviations from mean well in excess of typical noise (extrema envelope in red).
Extended Data Fig. 5
Extended Data Fig. 5. Real Time PCR of Epn2, Glipr2 and Gsn from murine cardiomyocytes.
Transcript abundance for Epn2 (a), Glipr2 (b) and Gsn (c) in hearts of AAV9-shRNA injected mice were compared to that of GAPDH (control). Relative Quantification (RQ) was calculated as 2CT and normalized to control mice injected with empty AAV-EGFP vector. Statistical significance was calculated by two-sided Student’s t test, no adjustments were made for multiple comparisons. The RNA samples were obtained from five AAV-shRNA injected mice for each gene. (n = 5 mice for each condition; **** P < 0.0001; *** P = 0.0007; Data are presented as mean values +/− SD’). Source data
Extended Data Fig. 6
Extended Data Fig. 6. Effects ion electrophysiological parameters upon knock down of novel sodium channel interactors.
Cardiomyocytes were harvested from mice that were either non-injected (control; closed circles), injected with AAV9 containing the GFP coding region (open squares) or with AAV9 containing the coding region for GFP, as well as shRNA to knockdown (KD) the protein of interest. Multiple animals per group were necessary due to the limited number of data points that can be obtained from a single animal. (a) Glipr2 was evaluated. Glipr2 KD in cardiomyocytes had no effect on sodium current density (control, n = 10 cells obtained from 3 mice; GFP, n = 9 cells obtained from 3 mice; Glipr2 KD, n = 7 cells obtained from 4 mice). (b) Steady-state voltage dependence of inactivation (control, n = 10 cells obtained from 3 mice; GFP, n = 8 cells obtained from 3 mice; Glipr2 KD, n = 9 cells obtained from 4 mice) and activation (c) were also unaffected. (d) Peak sodium current density recorded from HL1 cells treated with siRNA targeting Glipr2 was larger than that of control. (e) Peak sodium current density recorded from HL1 cells treated with siRNA targeting Epn2 was less than that of control cells. Control, n = 38 cells; Glipr2 KD, n = 16 cells; Epn2 KD n = 16. (f–g) The steady-state voltage dependence of inactivation of INa measured were unaffected by reduced expression of Epn2 (F) or Gsn (G), measured in adult murine cardiomyocytes harvested from mice injected with AAV9 (control n = 10 cells obtained from 3 mice; GFP n = 8 cells obtained from 3 mice; Epn2 KD n = 8 cells obtained from 4 mice; Gsn KD n = 10 cells obtained from 4 mice). Data are presented as mean values +/− SEM. (h) Protein abundances of Glipr2 (top), Epn2 (middle) and Gsn (bottom) measured across replicate immunoprecipitations as outlined from murine cardiac tissue. Glipr2 and Epn2 were exclusively identified in the four Scn5a (Nav1.5) replicates. Gsn was consistently measured at high abundance in the four Nav1.5 immunoprecipitations but was also present in the Kcnq1 (Kv7.1) immunoprecipitations as well as in some of the Kcnd2 (Kv4.2) immunoprecipitations. Gsn was more than a hundred-fold more abundant in the Nav1.5 IPs. Source data
Extended Data Fig. 7
Extended Data Fig. 7. Shared interactome of Cacna1c and Gja1.
a) Protein abundances of Cacna1c (Cav1.2) and Gja1 (Cx43) measured by mass spectrometry evaluation of quadruplicate immunoprecipitations of Cacna1c (left) and of Gja1 (right) from murine cardiac tissue. Cav1.2 was precipitated by the Cav1.2 IPs as well as by the Cx43 IPs. Similarly, Cx43 was immunoprecipitated by the Cx43 IPs as well as by the Cav1.2 IPs. b) Protein interaction network outlining the 10 shared interactors we identified for the networks of Cacna1c and Gja1.
Extended Data Fig. 8
Extended Data Fig. 8. Greater ECG parameter variability in adult pde4dip knockout (KO) zebrafish compared to wildtype siblings (WT).
Some ECG parameters had similar median values between WT (n = 6 fish) and pde4dip knockout (n = 9) groups (NS p > 0.05); however, the pde4dip group had much greater variance in P wave duration ( p = 0.013; panel a) and corrected QT interval ( p = 0.014, both by 2-sided Conover squared-ranks test for homogeneity of variance; panel b). Each point in the boxplots corresponds to an individual zebrafish. Boxplots indicate 25th/50th/75th percentiles, while whiskers extend to the most extreme data within 1.5x of interquartile range beyond box limits. Source data
Extended Data Fig. 9
Extended Data Fig. 9. Genetic ECG signatures of the key interactors of cardiac ion channels identified in this study and studies using zebrafish acute knockouts.
Genetic ECG signatures for a) Nebl, b) Nrap, c) Inf2, d) Glipr2, e) Gsn, f) Epn2, g) Myzap, h) Nlrx1, i) Pde4dip and j) Synpo2l with their respective maximum p-values shown on the upper right corner. The black line shows the average ECG curve of the full cohort used by Verweij et al., centered at the R wave ± 500 ms. The red line depicts the -log10(p value) of the association (signed to show the direction of association) for each of the 500 spatiotemporal data points of the ECG curve with the ECG morphology phenotype, that is, showing the strength of association of the genetic loci of a gene with each 2 ms window of the ECG. GWAS P-values were extracted from Verweij et al. and adjusted for multiple comparisons (see methods for details).

References

    1. Abriel H, Rougier JS, Jalife J. Ion channel macromolecular complexes in cardiomyocytes: roles in sudden cardiac death. Circ. Res. 2015;116:1971–1988. doi: 10.1161/CIRCRESAHA.116.305017. - DOI - PMC - PubMed
    1. Grandi E, et al. Potassium channels in the heart: structure, function and regulation. J. Physiol. 2017;595:2209–2228. doi: 10.1113/JP272864. - DOI - PMC - PubMed
    1. Koenig SN, Mohler PJ. The evolving role of ankyrin-B in cardiovascular disease. Heart Rhythm. 2017;14:1884–1889. doi: 10.1016/j.hrthm.2017.07.032. - DOI - PMC - PubMed
    1. Becchetti A, Petroni G, Arcangeli A. Ion channel conformations regulate integrin-dependent signaling. Trends Cell Biol. 2019;29:298–307. doi: 10.1016/j.tcb.2018.12.005. - DOI - PubMed
    1. Kaczmarek LK. Non-conducting functions of voltage-gated ion channels. Nat. Rev. Neurosci. 2006;7:761–771. doi: 10.1038/nrn1988. - DOI - PubMed