Molecular stratification of the human fetal vaginal epithelium by spatial transcriptome analysis
- PMID: 38666303
- PMCID: PMC11612642
- DOI: 10.3724/abbs.2024063
Molecular stratification of the human fetal vaginal epithelium by spatial transcriptome analysis
Abstract
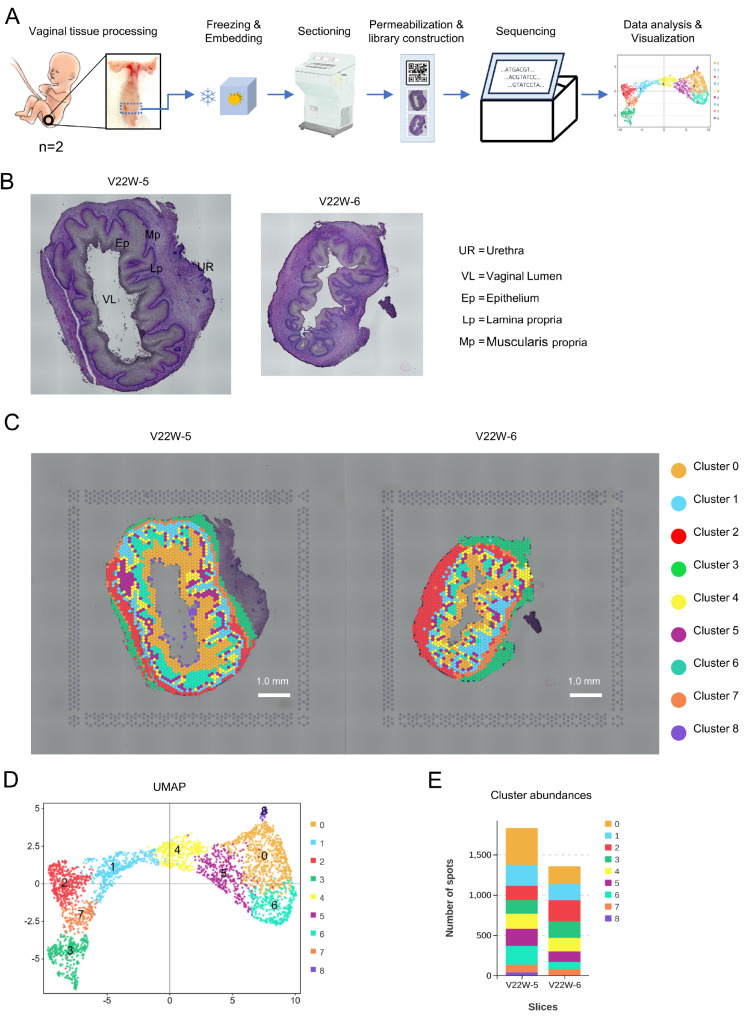
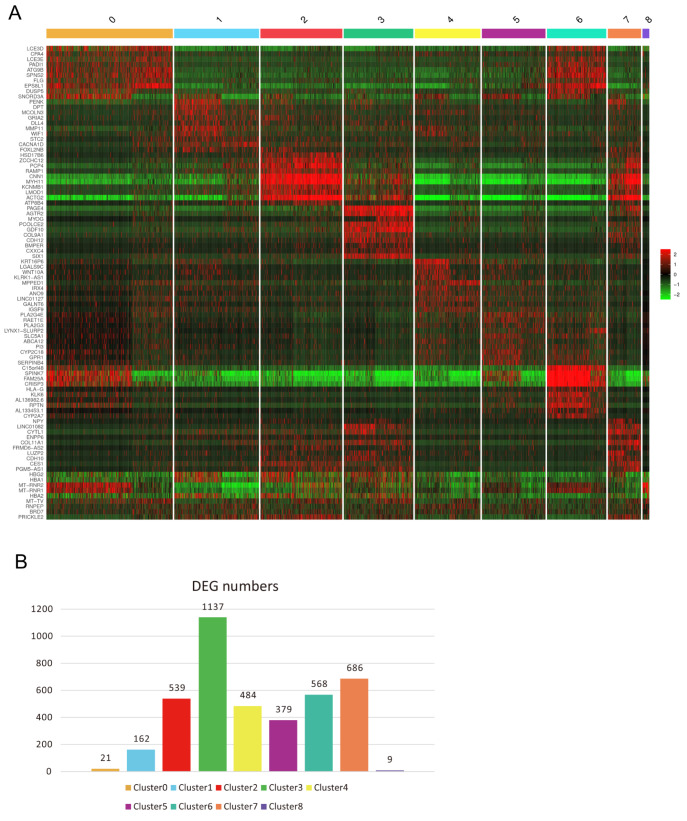
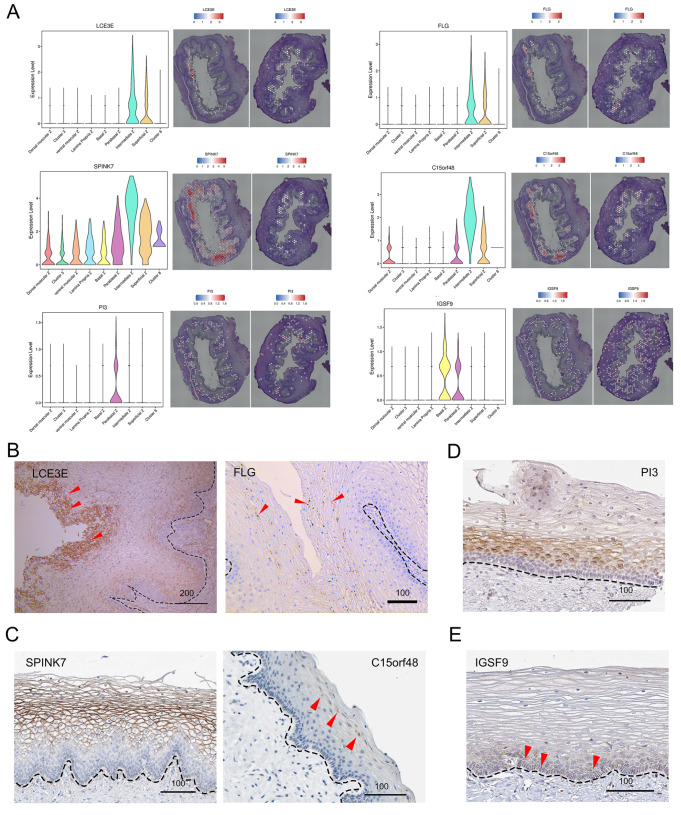
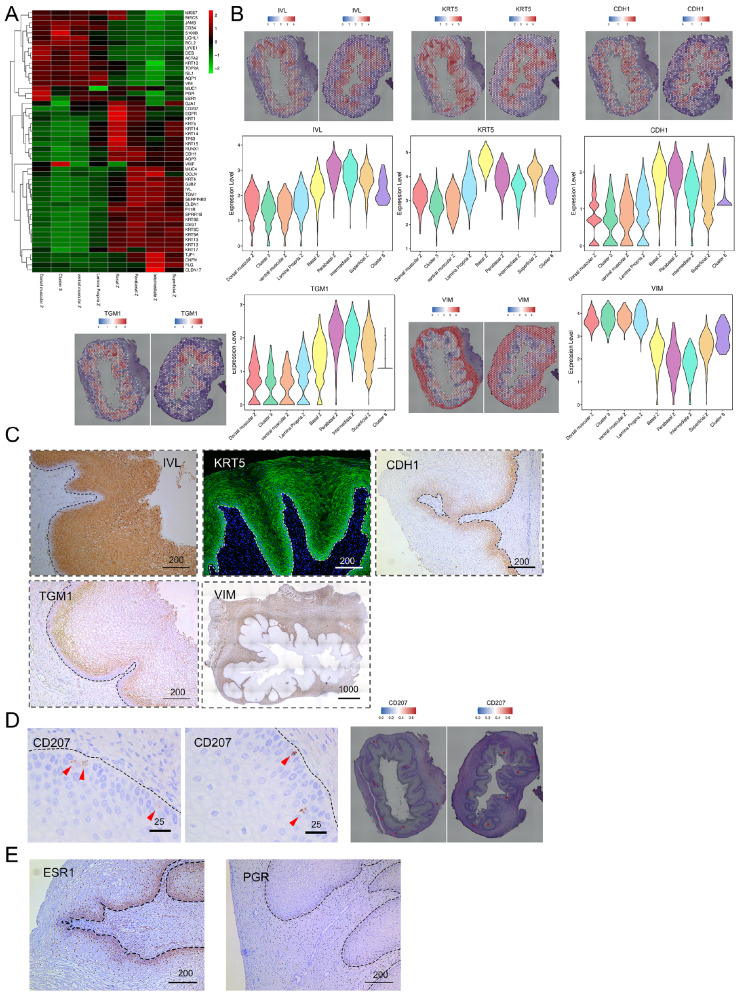
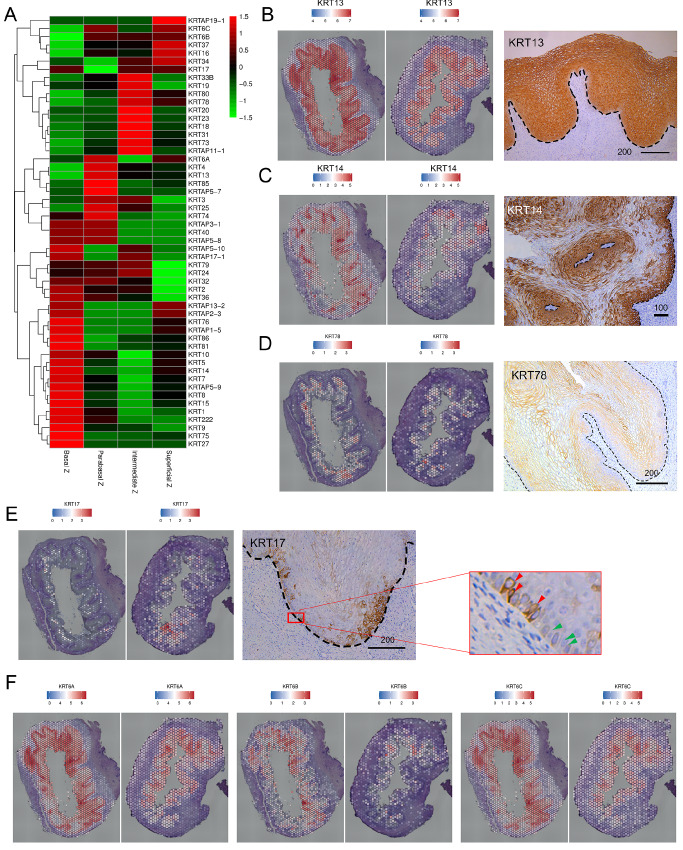
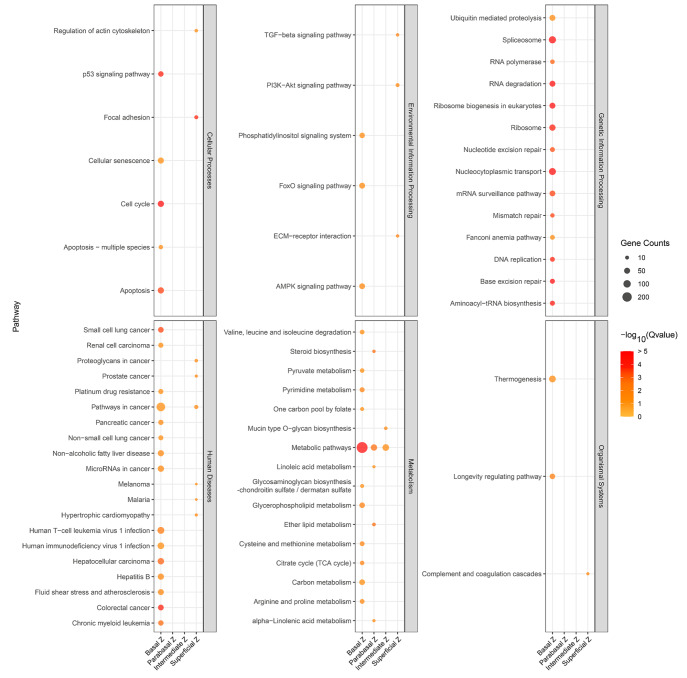
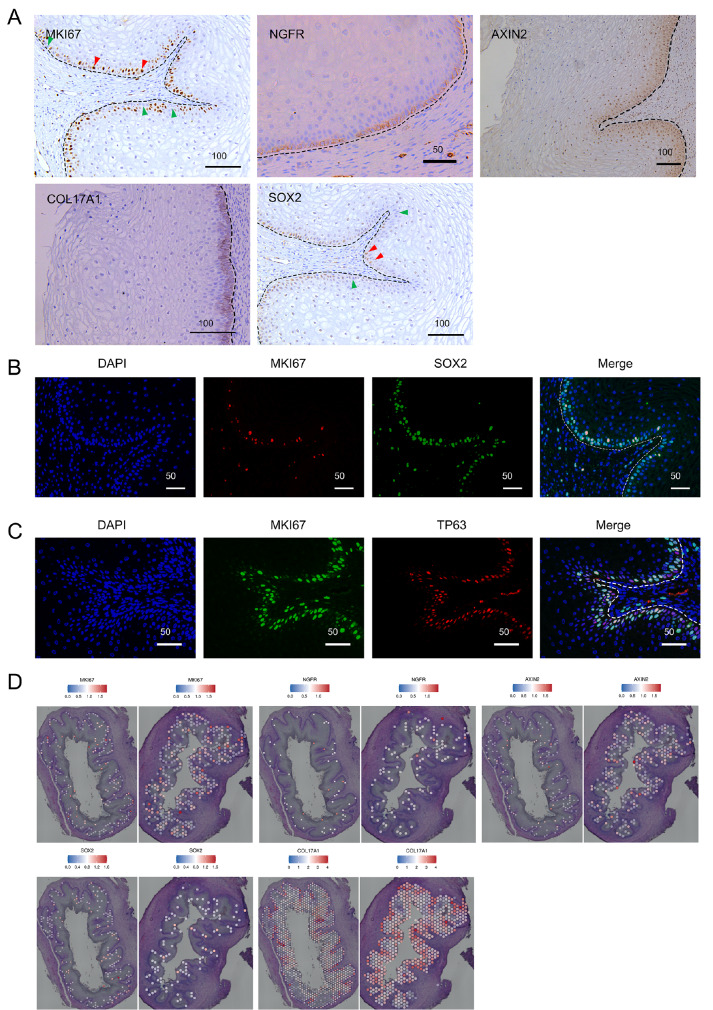
The human vaginal epithelium is a crucial component of numerous reproductive processes and serves as a vital protective barrier against pathogenic invasion. Despite its significance, a comprehensive exploration of its molecular profiles, including molecular expression and distribution across its multiple layers, has not been performed. In this study, we perform a spatial transcriptomic analysis within the vaginal wall of human fetuses to fill this knowledge gap. We successfully categorize the vaginal epithelium into four distinct zones based on transcriptomic profiles and anatomical features. This approach reveals unique transcriptomic signatures within these regions, allowing us to identify differentially expressed genes and uncover novel markers for distinct regions of the vaginal epithelium. Additionally, our findings highlight the varied expressions of keratin ( KRT) genes across different zones of the vaginal epithelium, with a gradual shift in expression patterns observed from the basal layer to the surface/superficial layer. This suggests a potential differentiation trajectory of the human vaginal epithelium, shedding light on the dynamic nature of this tissue. Furthermore, abundant biological processes are found to be enriched in the basal zone by KEGG pathway analysis, indicating an active state of the basal zone cells. Subsequently, the expressions of latent stem cell markers in the basal zone are identified. In summary, our research provides a crucial understanding of human vaginal epithelial cells and the complex mechanisms of the vaginal mucosa, with potential applications in vaginal reconstruction and drug delivery, making this atlas a valuable tool for future research in women's health and reproductive medicine.
Keywords: keratin; spatial transcriptomics; vaginal epithelium.
Conflict of interest statement
The authors declare that they have no conflict of interest.
Figures
Similar articles
-
Molecular mechanisms of development of the human fetal female reproductive tract.Differentiation. 2017 Sep-Oct;97:54-72. doi: 10.1016/j.diff.2017.07.003. Epub 2017 Jul 29. Differentiation. 2017. PMID: 29053991 Free PMC article.
-
Keratin expression reveals mosaic differentiation in vaginal epithelium.Am J Obstet Gynecol. 1993 Dec;169(6):1603-7. doi: 10.1016/0002-9378(93)90444-n. Am J Obstet Gynecol. 1993. PMID: 7505531
-
Ezrin is a key element in the human vagina.Maturitas. 2008 May 20;60(1):31-41. doi: 10.1016/j.maturitas.2008.03.007. Epub 2008 May 16. Maturitas. 2008. PMID: 18486367
-
A Kaleidoscope of Keratin Gene Expression and the Mosaic of Its Regulatory Mechanisms.Int J Mol Sci. 2023 Mar 15;24(6):5603. doi: 10.3390/ijms24065603. Int J Mol Sci. 2023. PMID: 36982676 Free PMC article. Review.
-
The development of the human vaginal fornix and the portio cervicis.Clin Anat. 2021 Oct;34(7):1059-1067. doi: 10.1002/ca.23729. Epub 2021 Feb 27. Clin Anat. 2021. PMID: 33580897 Free PMC article. Review.
References
-
- Hofsjo A, Bergmark K, Blomgren B, Jahren H, Bohm-Starke N. Radiotherapy for cervical cancer - impact on the vaginal epithelium and sexual function. Acta Oncologica. . 2018;57:338–345. doi: 10.1080/0284186X.2017.1400684. - DOI - PubMed
-
- Odeblad E. Intracavitary circulation of aqueous material in the human vagina. Acta Obstet Gynecol Scand. . 1964;43:360–368. doi: 10.3109/00016346409162686. - DOI - PubMed
-
- Shapiro RL, DeLong K, Zulfiqar F, Carter D, Better M, Ensign LM. In vitro and ex vivo models for evaluating vaginal drug delivery systems . Adv Drug Deliver Rev. . 2022;191:114543. doi: 10.1016/j.addr.2022.114543. - DOI - PMC - PubMed
-
- Machado RM, Palmeira-de-Oliveira A, Gaspar C, Martinez-de-Oliveira J, Palmeira-de-Oliveira R. Studies and methodologies on vaginal drug permeation. Adv Drug Deliver Rev. . 2015;92:14–26. doi: 10.1016/j.addr.2015.02.003. - DOI - PubMed
MeSH terms
Substances
LinkOut - more resources
Full Text Sources
Research Materials
Miscellaneous