. 2024 Jul 10;75(13):4148-4164.
doi: 10.1093/jxb/erae185.

Nitrate transporter protein NPF5.12 and major latex-like protein MLP6 are important defense factors against Verticillium longisporum

Affiliations

Nitrate transporter protein NPF5.12 and major latex-like protein MLP6 are important defense factors against Verticillium longisporum

Fredrik Dölfors et al. J Exp Bot. .

Abstract

Plant defense responses to the soil-borne fungus Verticillium longisporum causing stem stripe disease on oilseed rape (Brassica napus) are poorly understood. In this study, a population of recombinant inbred lines (RILs) using the Arabidopsis accessions Sei-0 and Can-0 was established. Composite interval mapping, transcriptome data, and T-DNA mutant screening identified the NITRATE/PEPTIDE TRANSPORTER FAMILY 5.12 (AtNPF5.12) gene as being associated with disease susceptibility in Can-0. Co-immunoprecipitation revealed interaction between AtNPF5.12 and the MAJOR LATEX PROTEIN family member AtMLP6, and fluorescence microscopy confirmed this interaction in the plasma membrane and endoplasmic reticulum. CRISPR/Cas9 technology was applied to mutate the NPF5.12 and MLP6 genes in B. napus. Elevated fungal growth in the npf5.12 mlp6 double mutant of both oilseed rape and Arabidopsis demonstrated the importance of these genes in defense against V. longisporum. Colonization of this fungus depends also on available nitrates in the host root. Accordingly, the negative effect of nitrate depletion on fungal growth was less pronounced in Atnpf5.12 plants with impaired nitrate transport. In addition, suberin staining revealed involvement of the NPF5.12 and MLP6 genes in suberin barrier formation. Together, these results demonstrate a dependency on multiple plant factors that leads to successful V. longisporum root infection.

Keywords: Brassica napus; Verticillium longisporum; Arabidopsis; MLP6; NPF5.12; major latex protein; nitrate.


Conflict of interest statement

The authors declare that there are no conflicts of interest.

Figures
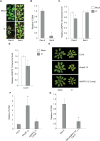
Fig. 1.
Fig. 1.
Phenotype and fungal DNA quantification in different Arabidopsis genotypes. (A) Disease symptoms of soil-grown Arabidopsis Can-0 and Sei-0 plants. Photos taken 21 days post-inoculation (dpi) with V. longisporum VL1. (B) Relative fungal DNA content in Sei-0 (0.1-fold) plant roots compared with Can-0 at 14 dpi. Bar chart represents means ±SE (n=6 biological replicates, 20 plants for each plant line and replicate). (C) Relative transcript levels of AtNPF5.12 in roots of Can-0 (0.8-fold) and Sei-0 plants. Data from V. longisporum (Vl) inoculated plants are relative to data from mock-treated plants at 2 dpi. Bar chart represents means ±SE (n=6 biological replicates of >25 plants for each plant line and treatment, repeated twice). (D) Relative transcript levels of V. longisporum (Vl) inoculated AtNPF5.12 roots (0.7-fold) compared with mock-treated plants at 2 dpi. Bar chart represents means ±SE (n=6 replicates of >20 plants for each treatment, repeated twice). (E) Disease symptoms of soil-grown Arabidopsis Col-0, Atnpf5.12, and Atnpf5.12 Compl. plants at 21 dpi. Atnpf5.12 Compl. plants are complemented with the native gene and promoter (pAtNPF5.12Col-0:AtNPF5.12Col-0). (F) Relative fungal DNA content in in vitro grown roots of V. longisporum inoculated Atnpf5.12 (5-fold) and Atnpf5.12 complemented lines (Compl. plants). The data are relative to Col-0 at 14 dpi. Bar chart represents means ±SE (n=6 biological replicates of 20 plants for each plant line). (G) Relative V. longisporum DNA content in roots of inoculated p35S:AtNPF5.12Col-0 complemented plants (0.3-fold). The data are relative to Can-0 at 14 dpi. Bar chart represents means ±SE (n=6 biological replicates of 20 plants for each plant line). Plants in (B–G) were grown in a hydroponic system. All transcription data were normalized to AtACTIN2. Asterisks represent significant difference by Student’s t-test: *P≤0.05; **P≤0.01.
Fig. 2.
Fig. 2.
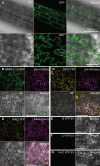
Cellular localization and interaction between NPN5.12 and MLP6 proteins. (A) Fluorescence microscopy images of roots (upper panel) and leaves (lower panel) from p35S:AtNPF5.12-GFP transgenic Arabidopsis plants. The AtNPF5.12–GFP protein fusion localizes in the plasma membrane. (B) Confocal microscope image of leaves from N. benthamiana plants, 4 d post-co-infiltration with a pAtNPF5.12:AtNPF5.12-GFP construct and a plasma membrane-localized mCherry marker. (C, D) Reconstituted yellow fluorescent protein (YFP) signal in N. benthamiana plants, 4 d post-infiltration with pSITE-cEYFP-AtNPF5.12 and pSITE-nEYFP-AtMLP6 BiFC constructs, together with a plasma membrane-localized (C) or endoplasmic reticulum-localized (D) mCherry marker. (E–G) empty vector pSITE-nEYFP, pSITE-cEYFP and pSITE-nEYFP coinfiltrated with pSITE-cEYFP as negative controls. BF, bright field; Merged, composite image; GFP, green fluorescence; YFP, yellow fluorescence; pm-mCherry, plasma membrane mCherry marker; ER-Cherry, endoplasmic reticulum mCherry marker. Scale bar (B–G) = 100 µm.
Fig. 3.
Fig. 3.
Phenotypes and fungal quantification in Arabidopsis mutants. (A) Relative fungal DNA content in roots of in vitro grown V. longisporum inoculated Atnpf5.12 (2.5-fold), Atmlp6 (1.8-fold), and Atnpf5.12 x Atmlp6 (6.5-fold) plants at 14 dpi. The data are relative to inoculated Col-0. Bar chart represents means ±SE (n=6 biological replicates of 20 plants for each plant line). (B) Relative AtMLP6 transcript levels in V. longisporum (Vl) inoculated roots of Col-0 (0.45-fold), Atnpf5.12 (0.2-fold), and Atmlp6 plants. The data are relative to mock-treated control plants at 2 dpi. Bar chart represents means ±SE (n=5 biological replicates of >20 plants for each plant line and treatment). Asterisks represent significant difference by Student’s t-test: *P≤0.05; **P≤0.01; ***P≤0.001. (C) Disease symptoms of soil-grown Col-0, Atnpf5.12, Atmlp6, Atnpf5.12 × Atmlp6 plants, 18 dpi with V. longisporum.
Fig. 4.
Fig. 4.
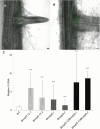
Responses to V. longisporum inoculation of Brassica napus and genome edited BnNPF5.12 and BnMLP lines. (A, B) Confocal microscopy image of 14-day-old B. napus cv. Kumily (WT) (A), and Bnnpf5.12-1 (B) inoculated by V. longisporum (Vl43:GFP). Photos taken 7 d post-infection. Scale bars: 50 µm. (C) Quantification of V. longisporum (Vl) DNA in Bnnpf5.12-1 (6-fold), Bnnpf5.12-2 (3.3-fold), Bnmlp6-1 (2.8-fold), Bnmlp6-2 (1.3-fold), Bnnpf5.12/Bnmlp6-1 (7.6-fold), and Bnnpf5.12/Bnmlp6-2 (8.7-fold) relative to WT. Bar chart represents mean fold change ±SD Vl DNA (n≥4 biological replicates of 10 roots for each plant line). The experiment was repeated twice. Asterisks represent statistical significance compared with WT (Student’s t-test: *P≤0.05; **P≤0.01; ***P≤0.001).
Fig. 5.
Fig. 5.
Suberin staining and quantification in genome edited Bnnpf5.12-1 and Bnmlp6-1 B. napus roots. (A, B) Fluorol Yellow 088 stained 14-day old roots of mock-treated and (A) V. longisporum inoculated (B) B. napus cv. Kumily (WT). (C, D) Mock-treated (C) and fungal inoculated (D) Bnnpf5.12-1 mutant. (E, F) Mock-treated (E) and fungal inoculated (F) Bnmlp6-1 mutant. (G) Quantification of Fluorol Yellow 088 fluorescence intensity in fungal infected (Vl) and mock-treated B. napus cv. Kumily (WT) and Bnnpf5.12-1 and Bnmlp6-1 mutant roots. Statistical significances are based on ANOVA/Tukey’s multiple comparisons of means (n≥4 roots per line and treatment, P≤0.001). Photographs were taken and quantification was performed 7 d post-treatment. Scale bars: 50 µm. FY, Fluorol Yellow 088; Merge, brightfield and FY composite image. The experiment was performed twice.
Fig. 6.
Fig. 6.
A proposed working model for the plant–V. longisporum interaction. (A) Verticillium longisporum (VL1, red line) hyphae enter the root at lateral root emergence sites. Disruption of the endodermal suberin lamellae enables hyphal entry into the vasculature. (B) NPF5.12 proteins transport nitrates from the vacuole to the apoplastic space. Two days post-infection, NPF5.12 and MLP6 transcriptionally reprogram. This change limits available nitrates to the pathogen and restricts fungal growth in susceptible plants. MLP6 migrate systemically though the vasculature. (C) NPF5.12 and MLP6 contribute to suberin deposition in the endodermis. The MLP6 carrier protein transports suberin monomers from the endoplasmic reticulum (ER) to the cell periphery. ABC-proteins transport suberin monomers to the apoplast. NPF5.12 contributes by transporting indole butyric acid (IBA), which is converted to indole acetic acid (IAA) in peroxisomes. Accumulation of endodermal IAA activates several Gly–Asp–Ser–Leu (GDSL)-type esterase/lipase proteins (GELPs), which polymerizes the suberin. (D) This process is interrupted by VL1 infection, causing loss of suberin polymerization. (E) VL1 infection and NPF5.12/MLP6 reprogramming trigger salicylic acid (SA) accumulation at two dpi. MLP6 mRNA and proteins migrate through plasmodesmata and phloem to increase WKRY70 transcription. WRKY70 contributes to transcriptional PR1 gene activation, and at the same time PDF1.2 repression.

Similar articles

Cited by

References

    1. Alonso JM, Stepanova AN, Leisse TJ, et al.. 2003. Genome-wide insertional mutagenesis of Arabidopsis thaliana. Science 301, 653–657. - PubMed
    1. Andersen TG, Naseer S, Ursache R, Wybouw B, Smet W, De Rybel B, Vermeer JEM, Geldner N.. 2018. Diffusible repression of cytokinin signalling produces endodermal symmetry and passage cells. Nature 555, 529–533. - PMC - PubMed
    1. Bae S, Park J, Kim JS.. 2014. Cas-OFFinder: a fast and versatile algorithm that searches for potential off-target sites of Cas9 RNA-guided endonucleases. Bioinformatics 30, 1473–1475. - PMC - PubMed
    1. Barberon M, Vermeer J, De Bellis D, et al.. 2016. Adaptation of root function by nutrient-induced plasticity of endodermal differentiation. Cell 164, 447–459. - PubMed
    1. Benjamini Y, Hochberg Y.. 1995. Controlling the false discovery rate: a practical and powerful approach to multiple testing. Journal of the Royal Statistical Society. Series B 57, 289–300.

MeSH terms