Review
. 2024 Apr 16;13(4):364.
doi: 10.3390/antibiotics13040364.

Echinacea Reduces Antibiotics by Preventing Respiratory Infections: A Meta-Analysis (ERA-PRIMA)

Affiliations
Review

Echinacea Reduces Antibiotics by Preventing Respiratory Infections: A Meta-Analysis (ERA-PRIMA)

Giuseppe Gancitano et al. Antibiotics (Basel). .

Abstract

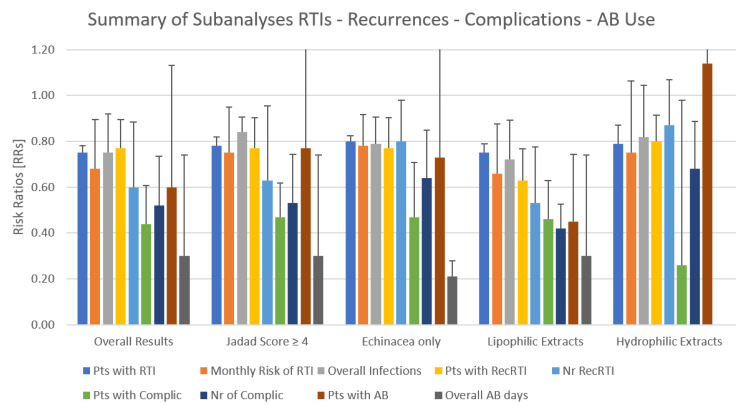
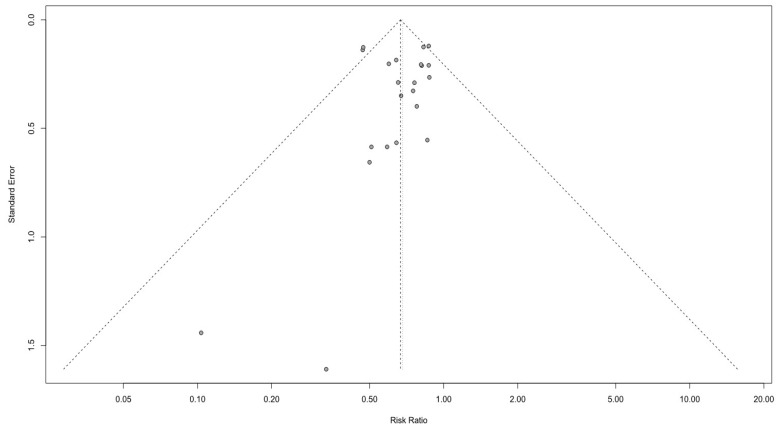
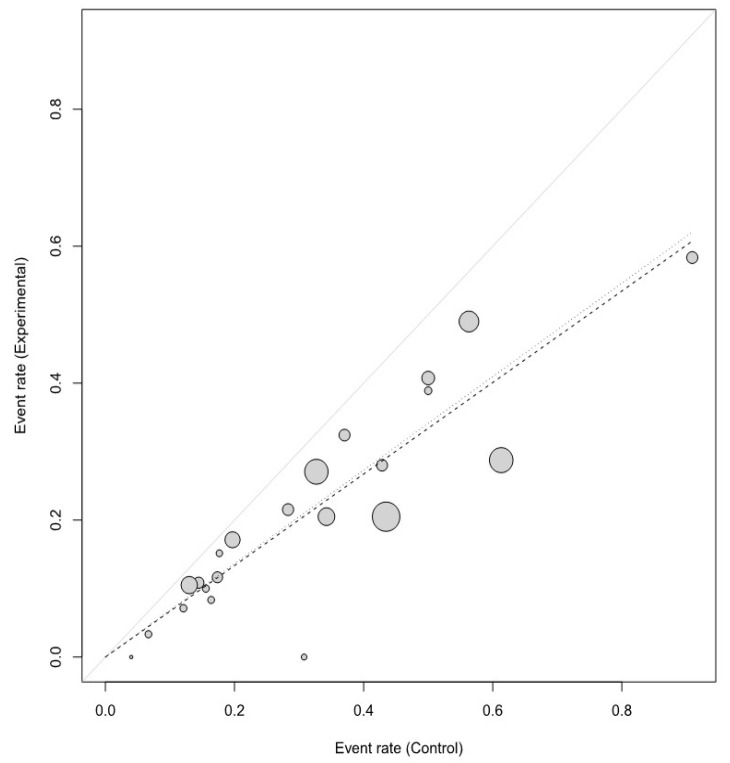
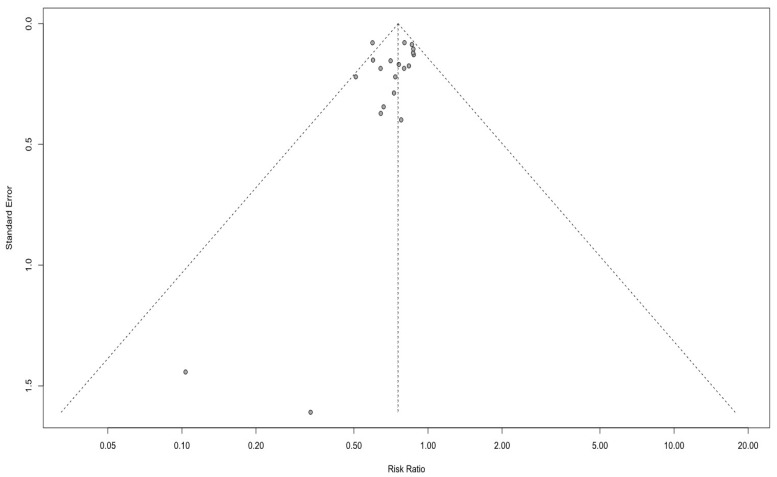
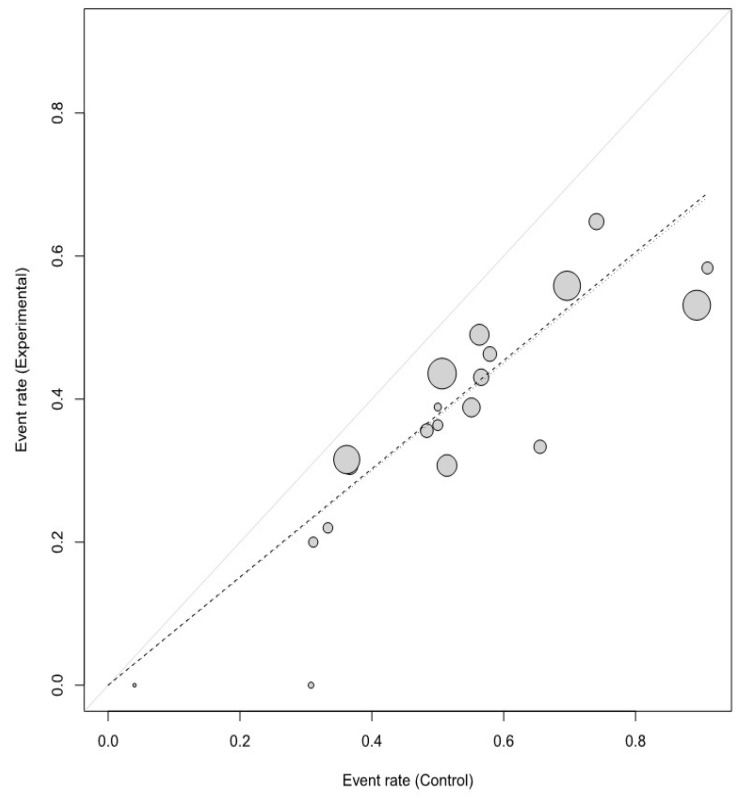
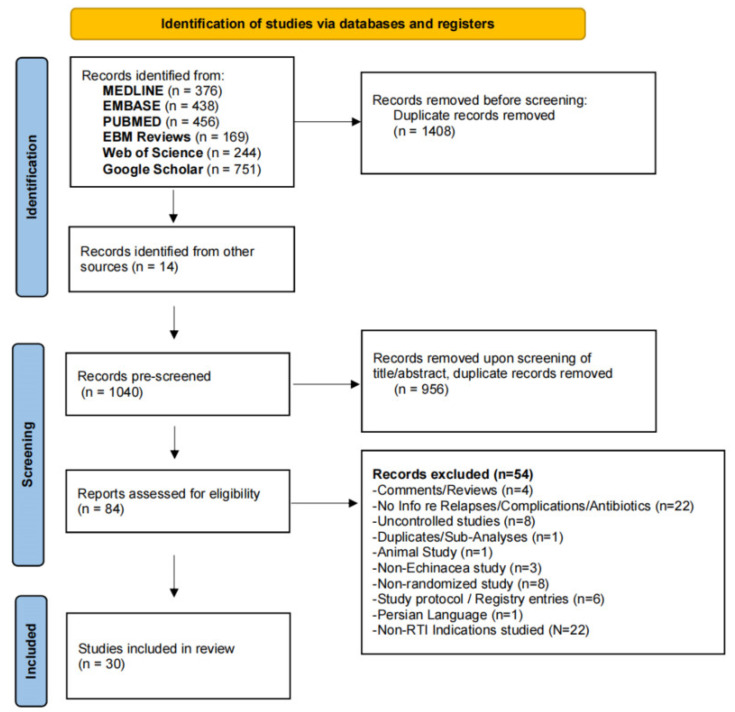
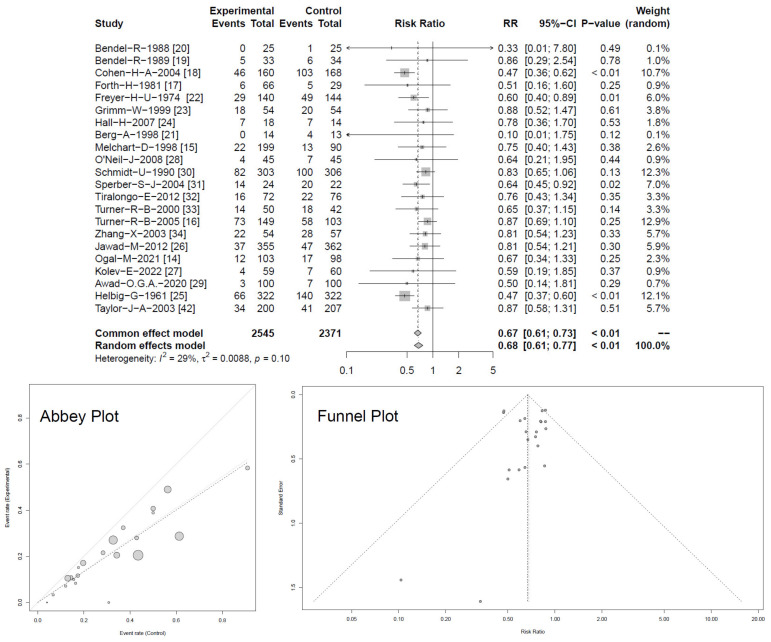
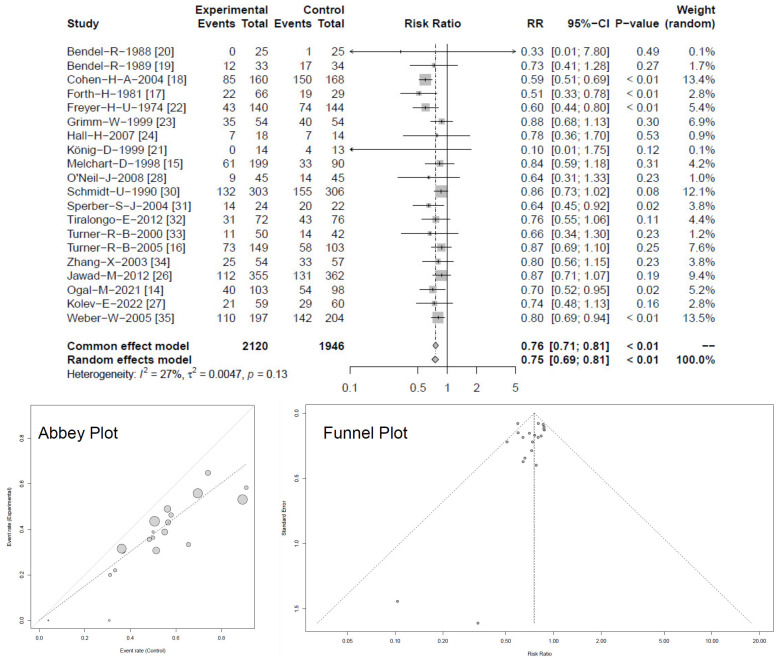
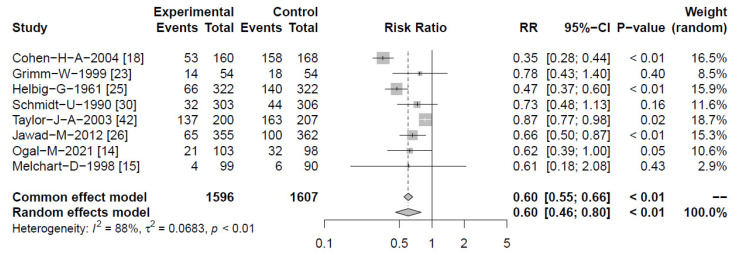
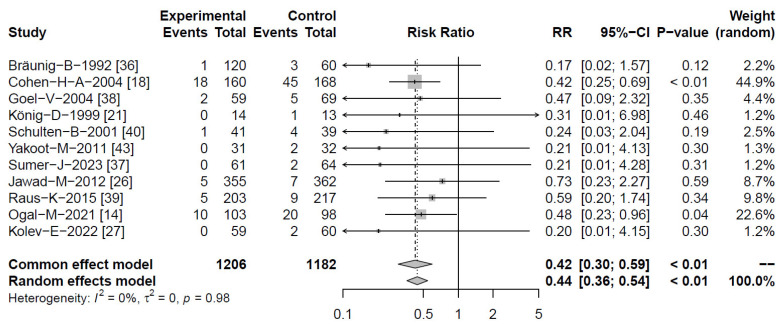
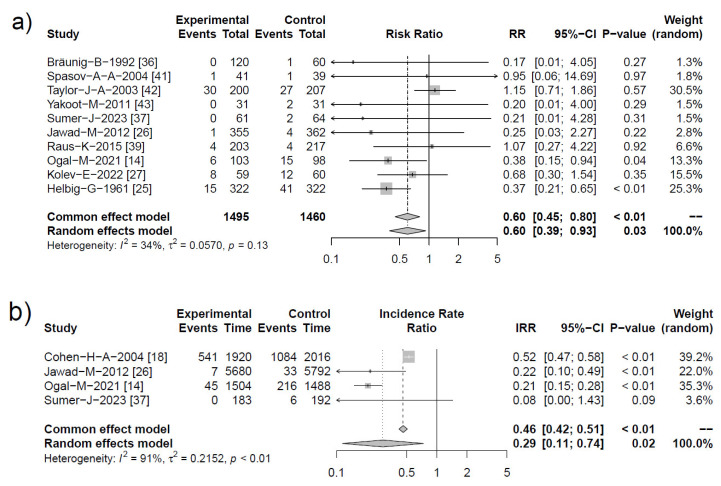
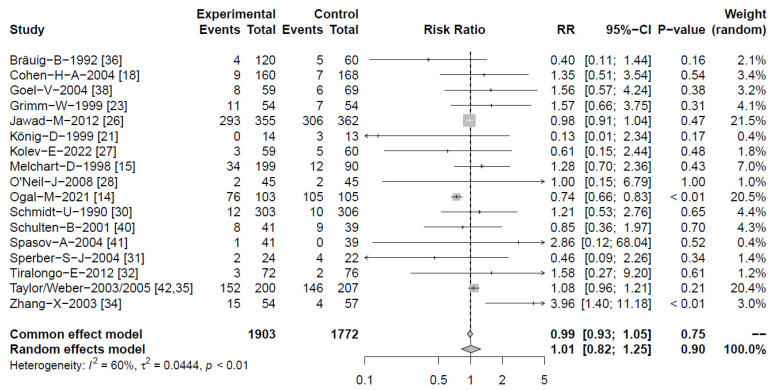
Respiratory tract infections (RTIs) are the leading cause of antibiotic prescriptions, primarily due to the risk for secondary bacterial infections. In this study, we examined whether Echinacea could reduce the need for antibiotics by preventing RTIs and their complications, and subsequently investigated its safety profile. A comprehensive search of EMBASE, PubMed, Google Scholar, Cochrane DARE and clinicaltrials.gov identified 30 clinical trials (39 comparisons) studying Echinacea for the prevention or treatment of RTIs in 5652 subjects. Echinacea significantly reduced the monthly RTI occurrence, risk ratio (RR) 0.68 (95% CI 0.61-0.77) and number of patients with ≥1 RTI, RR = 0.75 [95% CI 0.69-0.81] corresponding to an odds ratio 0.53 [95% CI 0.42-0.67]. Echinacea reduced the risk of recurrent infections (RR = 0.60; 95% CI 0.46-0.80), RTI complications (RR = 0.44; 95% CI 0.36-0.54) and the need for antibiotic therapy (RR = 0.60; 95% CI 0.39-0.93), with total antibiotic therapy days reduced by 70% (IRR = 0.29; 95% CI 0.11-0.74). Alcoholic extracts from freshly harvested Echinacea purpurea were the strongest, with an 80% reduction of antibiotic treatment days, IRR 0.21 [95% CI 0.15-0.28]. An equal number of adverse events occurred with Echinacea and control treatment. Echinacea can safely prevent RTIs and associated complications, thereby decreasing the demand for antibiotics. Relevant differences exist between Echinacea preparations.

Keywords: Echinacea; antibiotics; complications; prevention; recurrent RTIs; respiratory tract infections.


Conflict of interest statement

R.S., W.C.A. and S.L.J. received honoraria from A.Vogel AG Switzerland for consulting work. G.H. received honoraria for statistical evaluation of this meta-analysis. The other authors declare no conflicts of interest.

Figures

Figure A1
Figure A1
Graphical illustration of sub-analysis results.
Figure A2
Figure A2
Funnel plot in detail referred to Figure 2 of main text.
Figure A3
Figure A3
Abbey plot in detail referred to Figure 2 of main text.
Figure A4
Figure A4
Funnel plot in detail referred to Figure 3 of main text.
Figure A5
Figure A5
Abbey plot in detail referred to Figure 3 of main text.
Figure 1
Figure 1
Flow chart of included and excluded studies.
Figure 2
Figure 2
Forest plot showing meta-analysis of overall risk for occurrence of RTIs between groups with Abbey and Funnel plots, indicating low risk of publication bias (for clearer Abbey and Funnel plots see Appendix B Figure A2 and Figure A3). Shown are “events” (RTIs), “total” (participants) for Echinacea (“experimental”) and control, risk ratios (RR) employing a common and random effect model, heterogeneity (I2), confidence intervals (95%-CI), p-value and individual weight of respective studies.
Figure 3
Figure 3
Forest plot showing meta-analysis of proportion of Echinacea-treated subjects with ≥1 RTI compared with control (for clearer Abbey and Funnel plots see Appendix B Figure A4 and Figure A5). Shown are “events” (pts with RTIs), “total” (participants) for Echinacea (“experimental”) and control, risk ratios (RR) employing a common and random effect model, heterogeneity (I2), confidence intervals (95%-CI), p-value and individual weight of respective studies.
Figure 4
Figure 4
Forest plot showing meta-analysis of proportion of Echinacea-treated subjects experiencing recurrent RTIs/relapses compared with control. Shown are “events” (pts with recurrences), “total” (participants) for Echinacea (“experimental”) and control, risk ratios (RR) employing a common and random effect model, heterogeneity (I2), confidence intervals (95%-CI), p-value and individual weight of respective studies.
Figure 5
Figure 5
Forest plots showing meta-analysis of proportion of Echinacea-treated subjects experiencing complications compared with control. Shown are “events” (complications), “total” (participants) for Echinacea (“experimental”) and placebo risk ratios (RR) employing a common and random effect model, heterogeneity (I2), confidence intervals (95%-CI), p-value and individual weight of respective studies.
Figure 6
Figure 6
Forest plots showing meta-analysis of: (a) number of Echinacea-treated subjects receiving antibiotic therapy compared with control. Shown are “events” (pts or days with antibiotics), “total” (participants) for Echinacea (“experimental”) and placebo, risk ratios (RR) employing a common and random effect model, heterogeneity (I2), confidence intervals (95%-CI), p-value and individual weight of respective studies. (b) Number of overall antibiotic treatment days, showing individual risk ratio (IRR). Most studies reported the number of patients receiving antibiotic therapy.
Figure 7
Figure 7
Information regarding occurrence of AEs from 17 clinical studies. Forest plots showing meta-analysis of proportion of Echinacea-treated subjects experiencing AEs compared with control. Shown are “events” (AEs), “total” (participants) for Echinacea (“experimental”) and placebo risk ratios (RR) employing a common and random effect model, heterogeneity (I2), confidence intervals (95%-CI), p-value and individual weight of respective studies.

References

    1. Nunes-Silva C., Vilares A.T., Schweitzer V., Castanhinha S., Martins A., Lopes M.J., Ascoli-Bartoli T., Canelas G., Keir H.R., Cunha F., et al. Non-COVID-19 respiratory viral infection. Breathe. 2022;18:210151. doi: 10.1183/20734735.0151-2021. - DOI - PMC - PubMed
    1. Jin X., Ren J., Li R., Gao Y., Zhang H., Li J., Zhang J., Wang X., Wang G. Global burden of upper respiratory infections in 204 countries and territories, from 1990 to 2019. eClinicalMedicine. 2021;37:100986. doi: 10.1016/j.eclinm.2021.100986. - DOI - PMC - PubMed
    1. GBD 2015 Disease and Injury Incidence and Prevalence Collaborators Global, regional, and national incidence, prevalence, and years lived with disability for 310 diseases and injuries, 1990–2015: A systematic analysis for the Global Burden of Disease Study 2015. Lancet. 2016;388:1545–1602. doi: 10.1016/s0140-6736(16)31678-6. Erratum in Lancet 2017, 389, e1. - DOI - PMC - PubMed
    1. WHO. 2019. [(accessed on 1 February 2024)]. Available online: https://www.who.int/news-room/fact-sheets/detail/the-top-10-causes-of-death.
    1. Lang K. What do we know about covid in immunocompromised people? BMJ. 2023;383:1612. doi: 10.1136/bmj.p1612. - DOI - PubMed

LinkOut - more resources