. 2024 Apr 7;14(4):179.
doi: 10.3390/bios14040179.

Characterization of PDGF-Induced Subcellular Calcium Regulation through Calcium Channels in Airway Smooth Muscle Cells by FRET Biosensors

Affiliations

Characterization of PDGF-Induced Subcellular Calcium Regulation through Calcium Channels in Airway Smooth Muscle Cells by FRET Biosensors

Mingxing Ouyang et al. Biosensors (Basel). .

Abstract

The homeostasis of cellular calcium is fundamental for many physiological processes, while the calcium levels remain inhomogeneous within cells. During the onset of asthma, epithelial and inflammatory cells secrete platelet-derived growth factor (PDGF), inducing the proliferation and migration of airway smooth muscle (ASM) to the epidermal layer, narrowing the airway. The regulation of ASM cells by PDGF is closely related to the conduction of calcium signals. In this work, we generated subcellular-targeted FRET biosensors to investigate calcium regulation in the different compartments of ASM cells. A PDGF-induced cytoplasmic calcium [Ca2+]C increase was attributed to both extracellular calcium influx and endoplasmic reticulum (ER) calcium [Ca2+]ER release, which was partially regulated by the PLC-IP3R pathway. Interestingly, the removal of the extracellular calcium influx led to inhibited ER calcium release, likely through inhibitory effects on the calcium-dependent activation of the ER ryanodine receptor. The inhibition of the L-type calcium channel on the plasma membrane or the SERCA pump on the ER resulted in both reduced [Ca2+]C and [Ca2+]ER from PDGF stimulation, while IP3R channel inhibition led to reduced [Ca2+]C only. The inhibited SERCA pump caused an immediate [Ca2+]C increase and [Ca2+]ER decrease, indicating active calcium exchange between the cytosol and ER storage in resting cells. PDGF-induced calcium at the outer mitochondrial membrane sub-region showed a similar regulatory response to cytosolic calcium, not influenced by the inhibition of the mitochondrial calcium uniporter channel. Therefore, our work identifies calcium flow pathways among the extracellular medium, cell cytosol, and ER via regulatory calcium channels. Specifically, extracellular calcium flow has an essential function in fully activating ER calcium release.

Keywords: FRET biosensor; airway smooth muscle cells; calcium channels; calcium signal; platelet-derived growth factor (PDGF); subcellular calcium regulation.


Conflict of interest statement

The authors declare no conflicts of interest.

Figures
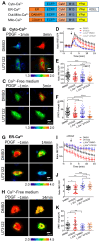
Figure 1
Figure 1
PDGF-induced calcium changes in cell cytoplasm and ER storage. The calcium concentrations were measured by calcium FRET biosensors. (A) Depictions of the four types of calcium FRET biosensors, as described in the Methods. (B,C) Ratiometric FRET images of the Cyto-Ca2+ biosensor induced with PDGF (50 ng/mL) in ASM cells pretreated with DMSO (as control) or U73122 (10 μM) in a normal culture medium (B) or calcium-free culture medium (C). (D) Quantified time-course curves of the cytoplasmic calcium FRET ratio (FRET/ECFP) in the ASM cells under the (B,C) conditions in a normal or Ca2+-free medium. (E,F) Statistical comparisons of the peak values of the FRET/ECFP ratio (E) and the FRET change rates (F) from the quantified curves in (D). Sample sizes of the Cyto-Ca2+ FRET measurements for DMSO, U73122, (−)Ca2+/DMSO, and (−)Ca2+/U73122 are 55, 40, 72, 66, respectively. (G,H) Ratiometric FRET images of the ER-Ca2+ biosensor induced with PDGF in ASM cells pretreated with DMSO or U73122 in a normal medium (G) or Ca2+-free medium (H). (IK) Quantified time-course curves of the ER calcium FRET ratio (I) and statistical comparisons of the peak values of the FRET/ECFP ratio (J) and FRET change rates (K) under the various conditions of (G,H). Sample sizes of the ER-Ca2+ FRET measurements for DMSO, U73122, (−)Ca2+/DMSO, and (−)Ca2+/U73122 are 58, 47, 45, 47, respectively. *, **, ***, and **** indicate p values < 0.05, 0.01, 0.001, and 0.0001 to denote significant differences.
Figure 2
Figure 2
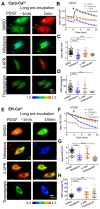
PDGF-induced calcium changes in cell cytoplasm and ER storage with one-hour pre-incubation of calcium channel inhibitors. (A) Ratiometric FRET images of Cyto-Ca2+ biosensor induced with PDGF in ASM cells pretreated for one hour with DMSO (as control), 2-APB (100 μM), nifedipine (10 μM), and thapsigargin (10 μM). (B) Quantified time-course curves of cytoplasmic calcium FRET ratio (FRET/ECFP) in ASM cells under (A) conditions. (C,D) Statistical comparisons of peak values of FRET/ECFP ratio (C) and FRET change rates (D) from quantified curves in (B). Sample sizes of Cyto-Ca2+ FRET measurements for DMSO, 2-APB, nifedipine, and thapsigargin are 66, 53, 49, 51, respectively. (E) Ratiometric FRET images of ER-Ca2+ biosensor induced with PDGF in ASM cells pretreated with DMSO, 2-APB, nifedipine, and thapsigargin. (FH) Quantified time-course curves of ER calcium FRET ratio (F) and statistical comparisons of peak values of FRET/ECFP ratio (G) and FRET change rates (H) under various conditions of (E). Sample sizes of ER-Ca2+ FRET measurements for DMSO, 2-APB, nifedipine, and thapsigargin are 53, 52, 50, 71, respectively. *, **, ***, and **** indicate p values < 0.05, 0.01, 0.001, and 0.0001 to denote significant differences.
Figure 3
Figure 3
PDGF-induced calcium changes in cell cytosol and ER storage under immediate addition of calcium channel inhibitors before microscopic imaging. (AD) Ratiometric FRET images of Cyto-Ca2+ biosensor induced with PDGF in ASM cells with immediate addition of DMSO (as control), 2-APB (100 μM), nifedipine (10 μM), and thapsigargin (10 μM) (A); corresponding quantified time-course curves of cytoplasmic calcium FRET ratio (FRET/ECFP) (B); and statistical comparisons of peak values of FRET ratio (C) and FRET change rates (D). Sample sizes of Cyto-Ca2+ FRET for DMSO, 2-APB, nifedipine, and thapsigargin are 37, 36, 32, 32, respectively. (EH) Ratiometric FRET images of ER-Ca2+ biosensor induced with PDGF in ASM cells with immediate addition of DMSO, 2-APB, nifedipine, and thapsigargin (E); quantified time-course curves of ER calcium FRET ratio (F); and statistical comparisons of peak values of FRET/ECFP ratio (G) and FRET change rates (H). Sample sizes of ER-Ca2+ FRET for DMSO, 2-APB, nifedipine, and thapsigargin are 37, 42, 38, 38, respectively. ***, and **** indicate p values < 0.001, and 0.0001 to denote significant differences.
Figure 4
Figure 4
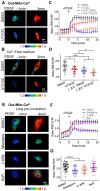
PDGF-induced calcium changes at the outer mitochondrial membrane measured by the Out-Mito-Ca2+ FRET biosensor. (A,B) PDGF-induced ratiometric FRET images of ASM cells pretreated with DMSO or U73122 (10 μM) in normal culture medium (A) or calcium-free medium (B). (C,D) Quantified time-course curves of Out-Mito-Ca2+ FRET ratio (C), and statistical comparisons of peak values of FRET/ECFP ratio (D) under (A,B) conditions. Sample sizes for DMSO, U73122, (−)Ca2+/DMSO, and (−)Ca2+/U73122 are 33, 33, 40, 33, respectively. (E) Ratiometric FRET images of Out-Mito-Ca2+ biosensor induced by PDGF in ASM cells with one-hour pre-incubation of DMSO, 2-APB (100 μM), nifedipine (10 μM), and RuR (10 μM). (F,G) Quantified time-course curves of Out-Mito-Ca2+ FRET ratio (F) and statistical comparisons of peak values of FRET/ECFP ratio (G). Sample sizes of Out-Mito-Ca2+ FRET for DMSO, 2-APB, nifedipine, thapsigargin, and RuR are 48, 38, 36, 36, respectively. *, ***, and **** indicate p values < 0.05, 0.001, and 0.0001 to denote significant differences.
Figure 5
Figure 5
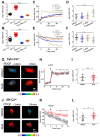
Characterization of calcium levels in cellular compartments. (A,B) Statistical comparisons of calcium FRET levels in cellular cytoplasm (Cyto-Ca2+), ER (ER-Ca2+), and outer mitochondrial membrane (Out-Mito Ca2+ in resting ASM cells (A) or with PDGF stimulation (at 5 min)) (B). The ratio values and sample sizes for cases without/with PDGF stimulation: Cyto-Ca2+ (1.6 ± 0.022, N = 87)/(2.05 ± 0.05, N = 87), ER-Ca2+ (3.9 ± 0.046, N = 78)/(3.7 ± 0.043, N = 78), and Out-Mito-Ca2+ (1.3 ± 0.021, N = 48)/(1.58 ± 0.032, N = 48), respectively. (CF) The time courses (average values) and FRET ratio comparisons of cytosolic calcium (peak values) (C,D) and ER (at 25 min) (E,F) calcium levels in ASM cells treated with DMSO, nifedipine, 2-APB, and thapsigargin. (GI) Ratiometric FRET images of Cyto-Ca2+ biosensor induced with PDGF (G), time courses of cytosolic calcium FRET ratio (H), and statistical comparison of peak values of FRET/ECFP ratio (I) in ASM cells pretreated with DMSO or RuR (10 μM). (JL) Ratiometric FRET images of ER-Ca2+ biosensor induced with PDGF (J) and time courses (K) and statistical comparison (at 14 min) of FRET/ECFP ratio (L) in ASM cells pretreated with DMSO or RuR (10 μM). **, ***, and **** indicate p values < 0.01, 0.001, and 0.0001 to denote significant differences.
Figure 6
Figure 6
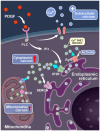
Illustration of PDGF-induced calcium exchange between different compartments of cells. The diagrams show the signaling-mediated Ca2+ ion flow pathways between the extracellular medium, cell cytosol, endoplasmic reticulum, and mitochondria.

Similar articles

Cited by

References

    1. Bidaux G., Flourakis M., Thebault S., Zholos A., Beck B., Gkika D., Roudbaraki M., Bonnal J.L., Mauroy B., Shuba Y., et al. Prostate cell differentiation status determines transient receptor potential melastatin member 8 channel subcellular localization and function. J. Clin. Investig. 2007;117:1647–1657. doi: 10.1172/JCI30168. - DOI - PMC - PubMed
    1. Egan C.G., Wainwright C.L., Wadsworth R.M., Nixon G.F. PDGF-induced signaling in proliferating and differentiated vascular smooth muscle: Effects of altered intracellular Ca2+ regulation. Cardiovasc. Res. 2005;67:308–316. doi: 10.1016/j.cardiores.2005.03.019. - DOI - PubMed
    1. Patergnani S., Danese A., Bouhamida E., Aguiari G., Previati M., Pinton P., Giorgi C. Various Aspects of Calcium Signaling in the Regulation of Apoptosis, Autophagy, Cell Proliferation, and Cancer. Int. J. Mol. Sci. 2020;21:8323. doi: 10.3390/ijms21218323. - DOI - PMC - PubMed
    1. Pingel J., Vandenrijt J., Kampmann M.L., Andersen J.D. Altered gene expression levels of genes related to muscle function in adults with cerebral palsy. Tissue Cell. 2022;76:101744. doi: 10.1016/j.tice.2022.101744. - DOI - PubMed
    1. Du X., Zhi J., Yang D., Wang Q., Luo X., Deng X. Research progress in the mechanism of calcium ion on contraction and relaxation of airway smooth muscle cells. J. Recept. Signal Transduct. Res. 2021;41:117–122. doi: 10.1080/10799893.2020.1806315. - DOI - PubMed

MeSH terms

LinkOut - more resources