. 2024 Apr 10;10(4):89.
doi: 10.3390/jimaging10040089.

Subjective Straylight Index: A Visual Test for Retinal Contrast Assessment as a Function of Veiling Glare

Affiliations

Subjective Straylight Index: A Visual Test for Retinal Contrast Assessment as a Function of Veiling Glare

Francisco J Ávila et al. J Imaging. .

Abstract

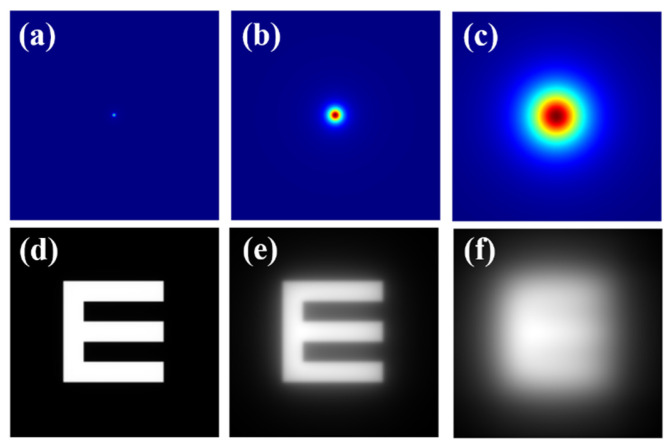
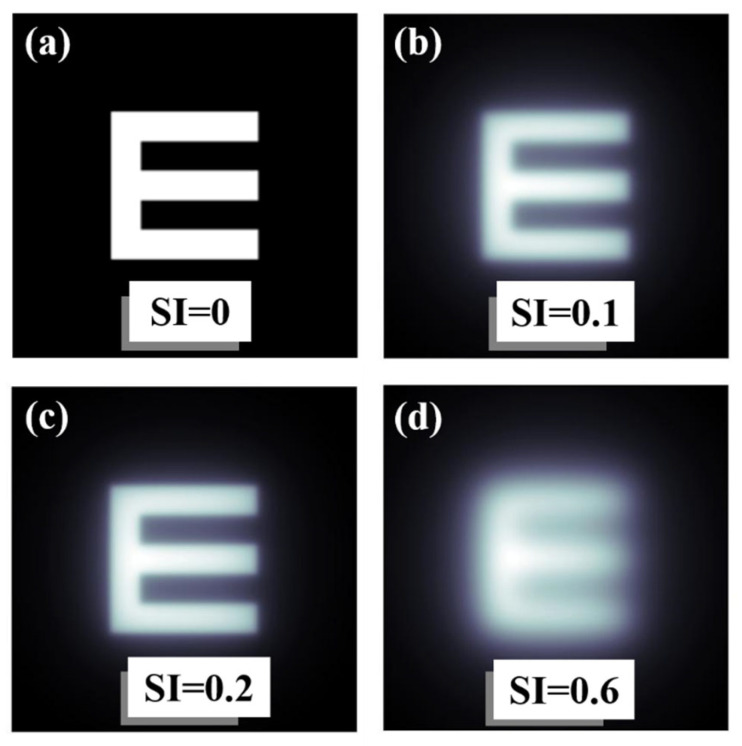
Spatial aspects of visual performance are usually evaluated through visual acuity charts and contrast sensitivity (CS) tests. CS tests are generated by vanishing the contrast level of the visual charts. However, the quality of retinal images can be affected by both ocular aberrations and scattering effects and none of those factors are incorporated as parameters in visual tests in clinical practice. We propose a new computational methodology to generate visual acuity charts affected by ocular scattering effects. The generation of glare effects on the visual tests is reached by combining an ocular straylight meter methodology with the Commission Internationale de l'Eclairage's (CIE) general disability glare formula. A new function for retinal contrast assessment is proposed, the subjective straylight function (SSF), which provides the maximum tolerance to the perception of straylight in an observed visual acuity test. Once the SSF is obtained, the subjective straylight index (SSI) is defined as the area under the SSF curve. Results report the normal values of the SSI in a population of 30 young healthy subjects (19 ± 1 years old), a peak centered at SSI = 0.46 of a normal distribution was found. SSI was also evaluated as a function of both spatial and temporal aspects of vision. Ocular wavefront measures revealed a statistical correlation of the SSI with defocus and trefoil terms. In addition, the time recovery (TR) after induced total disability glare and the SSI were related; in particular, the higher the RT, the greater the SSI value for high- and mid-contrast levels of the visual test. No relationships were found for low contrast visual targets. To conclude, a new computational method for retinal contrast assessment as a function of ocular straylight was proposed as a complementary subjective test for visual function performance.

Keywords: glare spread function; image processing; ocular aberrations; ocular straylight; recovery time; straylight index; visual acuity.


Conflict of interest statement

The authors declare no conflicts of interest.

Figures

Figure 1
Figure 1
Top row: (a) diffraction-limited PSF (i.e., no straylight contribution); (b) GSF for θ = 4°; (c) GSF for θ = 8°. Bottom row: retinal images simulated for the PSF and GSFs shown at the upper row (df).
Figure 2
Figure 2
Scheme of the SI principle (a); simulated retinal images affected by different SI values (be). Retinal images were simulated in a straylight eye model (reported in [35]) using Zemax 13 optical design software (Zemax OpticStudio, LCC, Arlington Capital Partners, Washington, DC, USA).
Figure 3
Figure 3
Convolutional image processing to obtain the SI parameter as a function of the glare angle (θ) of the glare spread function.
Figure 4
Figure 4
Numerical results of SI values obtained from computer generated retinal images affected by straylight (i.e., characterized by the GSF (θ)).
Figure 5
Figure 5
Image processing procedure to generate veiling glare in any digital image quantified by SI (θ).
Figure 6
Figure 6
Examples of an E-letter optotype affected by different values of SI. Straylight-free (a) and optotypes affected by SI = 0.1 (b), SI = 0.2 (c) and SI = 0.6 (d) values.
Figure 7
Figure 7
Visual acuity charts for different values of visual acuity and straylight index. Straylight-free VA charts (a,d) and for SI = 0.5 (b,e) and SI = 1.0 (c,f) values.
Figure 8
Figure 8
Temporal phases of disability glare vision after flash-lighting until baseline vision is recovered (a); simulated retinal images as a function of the contrast of the visual target and ocular straylight (b). Blue bar corresponds to normal vision; green and orange to medium and high straylight in discomfort glare regime and finally red bar corresponds to a severe degree of straylight in disability glare vision.
Figure 9
Figure 9
Histogram representation of the SSI value for all participants. A gaussian fit (R2 = 0.82) was found with a peak centered at SSI = 0.46.
Figure 10
Figure 10
SSFs for two subjects with different SSI values.
Figure 11
Figure 11
SSI as a function of defocus (a) and trefoil (b) terms. The red lines correspond to the linear statistical correlations of SSI with both defocus (R2 = 0.39, p = 0.03) and trefoil (R2 = 0.46, p = 0.012) terms.
Figure 12
Figure 12
SSI as a function of RT for 100% (a) and for 50% visual test contrast levels (b). Blue lines correspond to linear statistical correlations.

References

    1. Xiao N., Xu S., Li Z.-K., Tang M., Mao R., Yang T., Ma S.-X., Wang P.-H., Li M.-T., Sunilkumar A., et al. A single photoreceptor splits perception and entrainment by cotransmission. Nature. 2023;623:562–570. doi: 10.1038/s41586-023-06681-6. - DOI - PMC - PubMed
    1. Liu L., Wang Y., Liu J., Liu W. Retinal-image quality and contrast sensitivity function in eyes with epiretinal membrane: A cross-sectional observational clinical study. BMC Ophthalmol. 2018;18:290. doi: 10.1186/s12886-018-0957-1. - DOI - PMC - PubMed
    1. Maurer D., Mondloch C.J., Lewis T. L Effects of early visual deprivation on perceptual and cognitive development. Prog. Brain Res. 2007;164:87–104. - PubMed
    1. Tran N., Chiu S., Tian Y., Wildsoet C.F. The significance of retinal image contrast and spatial frequency composition for eye growth modulation in young chicks. Vis. Res. 2008;48:1655–1662. doi: 10.1016/j.visres.2008.03.022. - DOI - PMC - PubMed
    1. Jindra L.F., Zemon V. Contrast sensitivity testing: A more complete assessment of vision. J. Cataract. Refract. Surg. 1989;15:141–148. doi: 10.1016/S0886-3350(89)80002-1. - DOI - PubMed

LinkOut - more resources