

SARS-CoV-2 Viral Shedding and Rapid Antigen Test Performance - Respiratory Virus Transmission Network, November 2022-May 2023
- PMID: 38668391
- PMCID: PMC11065460
- DOI: 10.15585/mmwr.mm7316a2
SARS-CoV-2 Viral Shedding and Rapid Antigen Test Performance - Respiratory Virus Transmission Network, November 2022-May 2023
Abstract
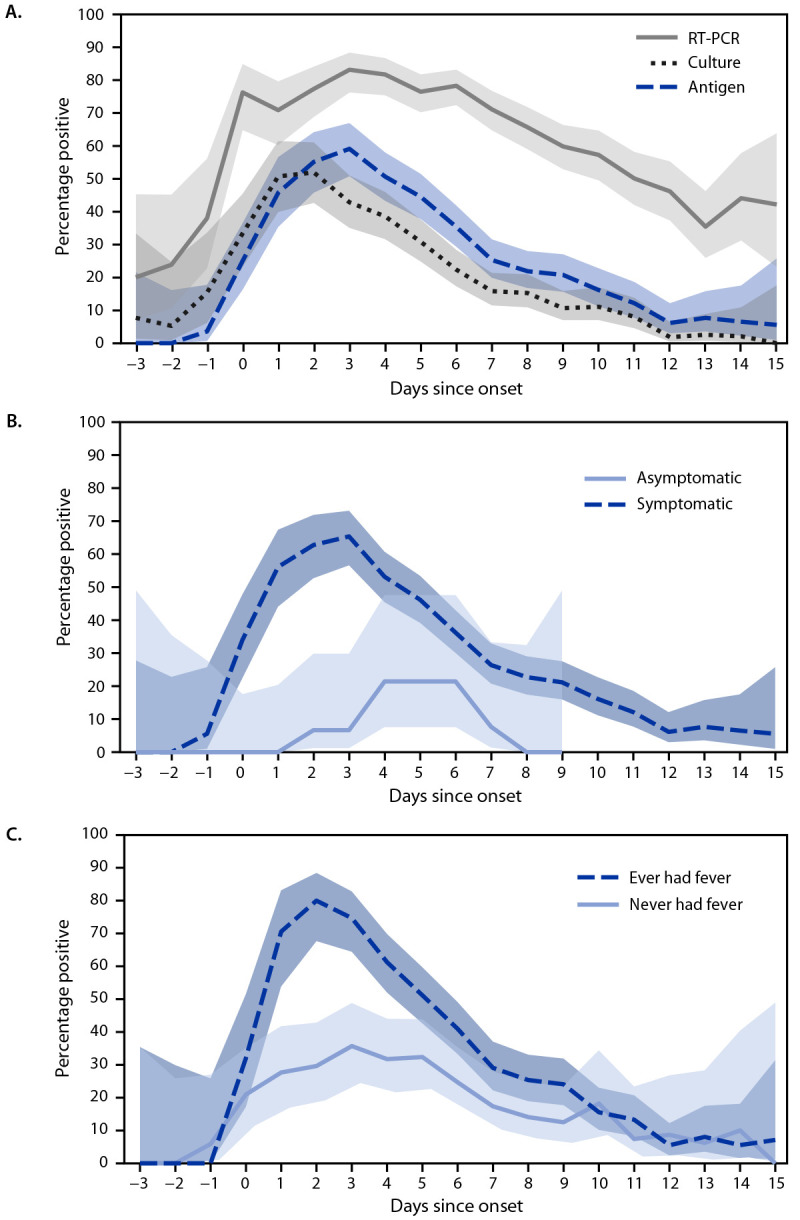
As population immunity to SARS-CoV-2 evolves and new variants emerge, the role and accuracy of antigen tests remain active questions. To describe recent test performance, the detection of SARS-CoV-2 by antigen testing was compared with that by reverse transcription-polymerase chain reaction (RT-PCR) and viral culture testing during November 2022-May 2023. Participants who were enrolled in a household transmission study completed daily symptom diaries and collected two nasal swabs (tested for SARS-CoV-2 via RT-PCR, culture, and antigen tests) each day for 10 days after enrollment. Among participants with SARS-CoV-2 infection, the percentages of positive antigen, RT-PCR, and culture results were calculated each day from the onset of symptoms or, in asymptomatic persons, from the date of the first positive test result. Antigen test sensitivity was calculated using RT-PCR and viral culture as references. The peak percentage of positive antigen (59.0%) and RT-PCR (83.0%) results occurred 3 days after onset, and the peak percentage of positive culture results (52%) occurred 2 days after onset. The sensitivity of antigen tests was 47% (95% CI = 44%-50%) and 80% (95% CI = 76%-85%) using RT-PCR and culture, respectively, as references. Clinicians should be aware of the lower sensitivity of antigen testing compared with RT-PCR, which might lead to false-negative results. This finding has implications for timely initiation of SARS-CoV-2 antiviral treatment, when early diagnosis is essential; clinicians should consider RT-PCR for persons for whom antiviral treatment is recommended. Persons in the community who are at high risk for severe COVID-19 illness and eligible for antiviral treatment should seek testing from health care providers with the goal of obtaining a more sensitive diagnostic test than antigen tests (i.e., an RT-PCR test).
Conflict of interest statement
All authors have completed and submitted the International Committee of Medical Journal Editors form for disclosure of potential conflicts of interest. Edwin J. Asturias reports grant support from Pfizer, consulting fees from Hillevax and Moderna, and payment from Merck for a lecture delivered at the Latin American Vaccine Summit. Carlos G. Grijalva reports support from the Food and Drug Administration and grants from the National Institutes of Health (NIH) and Syneos Health. Son H. McLaren reports institutional support from the Respiratory Virus Transmission Network, receipt of the Ken Graff Young Investigator Award from the American Academy of Pediatrics, Section on Emergency Medicine, institutional support from the National Center for Advancing Translational Science, the National Heart, Lung, and Blood Institute, and the Doris Duke Charitable Foundation COVID-19 Fund to Retain Clinician-Scientists. Suchitra Rao reports grant support from Biofire. Melissa S. Stockwell reports institutional support from the University of Washington, Boston Children’s Hospital, Westat, and New York University, and service as the Associate Director of the American Academy of Pediatrics Pediatric Research in Office Settings Research Network (payment to the trustees of Columbia University). Huong Q. Nguyen reports research support from CSL Seqirus, GSK, and ModernaTX, and an honorarium from ModernaTX for participating in a consultancy group, outside the submitted work. No other potential conflicts of interest were disclosed.
Figures

Similar articles
-
Rapid, point-of-care antigen and molecular-based tests for diagnosis of SARS-CoV-2 infection.Cochrane Database Syst Rev. 2021 Mar 24;3(3):CD013705. doi: 10.1002/14651858.CD013705.pub2. Cochrane Database Syst Rev. 2021. Update in: Cochrane Database Syst Rev. 2022 Jul 22;7:CD013705. doi: 10.1002/14651858.CD013705.pub3. PMID: 33760236 Free PMC article. Updated.
-
Sensitivity and Specificity of SARS-CoV-2 Rapid Antigen Detection Tests Using Oral, Anterior Nasal, and Nasopharyngeal Swabs: a Diagnostic Accuracy Study.Microbiol Spectr. 2022 Feb 23;10(1):e0202921. doi: 10.1128/spectrum.02029-21. Epub 2022 Feb 2. Microbiol Spectr. 2022. PMID: 35107327 Free PMC article.
-
Comparative evaluation of RT-PCR and antigen-based rapid diagnostic tests (Ag-RDTs) for SARS-CoV-2 detection: performance, variant specificity, and clinical implications.Microbiol Spectr. 2024 Jun 4;12(6):e0007324. doi: 10.1128/spectrum.00073-24. Epub 2024 Apr 29. Microbiol Spectr. 2024. PMID: 38683014 Free PMC article.
-
Rapid SARS-CoV-2 antigen detection assay in comparison with real-time RT-PCR assay for laboratory diagnosis of COVID-19 in Thailand.Virol J. 2020 Nov 13;17(1):177. doi: 10.1186/s12985-020-01452-5. Virol J. 2020. PMID: 33187528 Free PMC article.
-
Comparison of diagnostic accuracy of rapid antigen tests for COVID-19 compared to the viral genetic test in adults: a systematic review and meta-analysis.JBI Evid Synth. 2024 Oct 1;22(10):1939-2002. doi: 10.11124/JBIES-23-00291. JBI Evid Synth. 2024. PMID: 39188132 Free PMC article.
Cited by
-
Risk period for transmission of SARS-CoV-2 and seasonal influenza: a rapid review.Infect Control Hosp Epidemiol. 2025 Feb 24;46(3):1-9. doi: 10.1017/ice.2025.11. Online ahead of print. Infect Control Hosp Epidemiol. 2025. PMID: 39989317 Free PMC article. Review.
-
A Randomized Trial of At-Home COVID-19 Tests, Telemedicine, and Rapid Prescription Delivery for Immunocompromised Individuals.Mayo Clin Proc Innov Qual Outcomes. 2025 May 22;9(3):100627. doi: 10.1016/j.mayocpiqo.2025.100627. eCollection 2025 Jun. Mayo Clin Proc Innov Qual Outcomes. 2025. PMID: 40503088 Free PMC article.
-
Before Venous Sinus Thrombosis is Attributed to Hyperhomocysteinemia, Alternative Causes Must be Thoroughly Ruled Out.Ann Afr Med. 2024 Nov 8;24(1):206-7. doi: 10.4103/aam.aam_130_24. Online ahead of print. Ann Afr Med. 2024. PMID: 39513465 Free PMC article. No abstract available.
-
Key Insights into Respiratory Virus Testing: Sensitivity and Clinical Implications.Microorganisms. 2025 Jan 2;13(1):63. doi: 10.3390/microorganisms13010063. Microorganisms. 2025. PMID: 39858831 Free PMC article. Review.
-
Comparison of NADAL COVID IgG/IgM rapid test and DiaSorin Liaison SARS-CoV-2 S1/S2 IgG assay across different blood sources and substrates.Microbiol Spectr. 2025 Jul;13(7):e0335024. doi: 10.1128/spectrum.03350-24. Epub 2025 Jun 2. Microbiol Spectr. 2025. PMID: 40454936 Free PMC article.
References
-
- Almendares O, Prince-Guerra JL, Nolen LD, et al.; CDC COVID-19 Surge Diagnostic Testing Laboratory. Performance characteristics of the Abbott BinaxNOW SARS-CoV-2 antigen test in comparison to real-time reverse transcriptase PCR and viral culture in community testing sites during November 2020. J Clin Microbiol 2022;60:e0174221. 10.1128/JCM.01742-21 - DOI - PMC - PubMed
MeSH terms
Substances
Grants and funding
LinkOut - more resources
Full Text Sources
Medical
Research Materials
Miscellaneous
