. 2024 Mar 22;12(4):232.
doi: 10.3390/toxics12040232.

Perfluorooctanesulfonic Acid Alters Pro-Cancer Phenotypes and Metabolic and Transcriptional Signatures in Testicular Germ Cell Tumors

Affiliations

Perfluorooctanesulfonic Acid Alters Pro-Cancer Phenotypes and Metabolic and Transcriptional Signatures in Testicular Germ Cell Tumors

Raya I Boyd et al. Toxics. .

Abstract

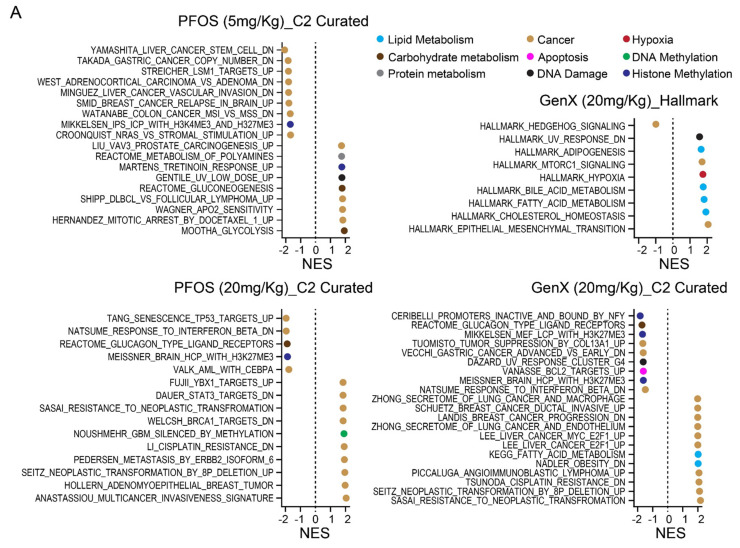
The potential effects of poly- and perfluoroalkyl substances (PFAS) are a recently emergent human and environmental health concern. There is a consistent link between PFAS exposure and cancer, but the mechanisms are poorly understood. Although epidemiological evidence supporting PFAS exposure and cancer in general is conflicting, there is relatively strong evidence linking PFAS and testicular germ cell tumors (TGCTs). However, no mechanistic studies have been performed to date concerning PFAS and TGCTs. In this report, the effects of the legacy PFAS perfluorooctanesulfonic acid (PFOS) and the newer "clean energy" PFAS lithium bis(trifluoromethylsulfonyl)imide (LiTFSi, called HQ-115), on the tumorigenicity of TGCTs in mice, TGCT cell survival, and metabolite production, as well as gene regulation were investigated. In vitro, the proliferation and survival of both chemo-sensitive and -resistant TGCT cells were minimally affected by a wide range of PFOS and HQ-115 concentrations. However, both chemicals promoted the growth of TGCT cells in mouse xenografts at doses consistent with human exposure but induced minimal acute toxicity, as assessed by total body, kidney, and testis weight. PFOS, but not HQ-115, increased liver weight. Transcriptomic alterations of PFOS-exposed normal mouse testes were dominated by cancer-related pathways and gene expression alterations associated with the H3K27me3 polycomb pathway and DNA methylation, epigenetic pathways that were previously showed to be critical for the survival of TGCT cells after cisplatin-based chemotherapy. Similar patterns of PFOS-mediated gene expression occurred in PFOS-exposed cells in vitro. Metabolomic studies revealed that PFOS also altered metabolites associated with steroid biosynthesis and fatty acid metabolism in TGCT cells, consistent with the proposed ability of PFAS to mimic fatty acid-based ligands controlling lipid metabolism and the proposed role of PFAS as endocrine disrupters. Our data, is the first cell and animal based study on PFAS in TGCTs, support a pro-tumorigenic effect of PFAS on TGCT biology and suggests epigenetic, metabolic, and endocrine disruption as potential mechanisms of action that are consistent with the non-mutagenic nature of the PFAS class.

Keywords: GenX; H3K27me3; HQ-115; LiTFSI; PFOS; fatty acid metabolism; metabolomics; steroid synthesis; testicular cancer; transcriptomics.


Conflict of interest statement

The authors declare no conflict of interest.

Figures

Figure 1
Figure 1
Schematic of experimental protocols.
Figure 2
Figure 2
PFOS and HQ-115 are not acutely toxic and do not alter the proliferation of TGCT cells in vitro. TGCT cells lines 2102EP, 2102EP-C1, NT2/D1, and NT2/D1-A4 were treated with 10 pM to 1 mM doses of PFOS and HQ-115 for 4 days, and cell viability was assessed. Cell viability (%) is the CellTiter-Glo signal compared to untreated vehicle control. Data represent mean +/− standard error of the mean of four biological replicates, and are representative of two independent experiments.
Figure 3
Figure 3
PFOS and HQ-115 promote TGCT growth in vivo. (A) TGCT xenograft (as described in Materials and Methods) of 2102EP-C1 cells treated for 15 consecutive days with 10 mg/kg PFOS or vehicle control. Tumor volume over time, percent tumor volume change (from day 1 of treatment to day 15 of treatment), and testis, kidney, and liver weight are presented. Data represent mean +/− standard error of the mean, and are representative of two independent experiments. ** p ≤ 0.01, *** p ≤0.005, **** p ≤ 0.001. (B) TGCT xenograft of 2102EP-C1 cells treated for 15 days with 1 mg/kg (1 HQ in figure) and 10 mg/kg HQ-115 (10 HQ in figure) or vehicle control. Tumor volume over time, percent tumor volume change (from day 1 of treatment to day 15 of treatment), and testis, kidney and liver weight are presented. Data represent mean +/− standard error of the mean. ** p ≤ 0.01, *** p ≤0.005, **** p ≤ 0.001.
Figure 4
Figure 4
PFOS and GenX alter gene expression associated with fatty acid and steroid synthesis and metabolism, H3K27me3, DNA methylation, and other pathways associated with pro-cancer phenotypes in mouse testes. Results of the RNA-seq analysis of mouse testes after oral treatment with 5 mg/kg and 20 mg/kg per body weight of PFOS or 20 mg/kg per body weight of GenX for 15 consecutive days compared to vehicle control. (A) Gene set enrichment analysis (GSEA) of gene sets among the top 15 ranked by normalized enrichment score (NES) altered by PFOS or GenX treatments. Complete lists are in Supplemental Table S1. (B) Representative gene set enrichment plots.
Figure 4
Figure 4
PFOS and GenX alter gene expression associated with fatty acid and steroid synthesis and metabolism, H3K27me3, DNA methylation, and other pathways associated with pro-cancer phenotypes in mouse testes. Results of the RNA-seq analysis of mouse testes after oral treatment with 5 mg/kg and 20 mg/kg per body weight of PFOS or 20 mg/kg per body weight of GenX for 15 consecutive days compared to vehicle control. (A) Gene set enrichment analysis (GSEA) of gene sets among the top 15 ranked by normalized enrichment score (NES) altered by PFOS or GenX treatments. Complete lists are in Supplemental Table S1. (B) Representative gene set enrichment plots.
Figure 5
Figure 5
PFOS alters gene expression associated with H3K27me3, DNA methylation, and other pathways associated with pro-cancer phenotypes in human TGCT cells. Results of the RNA-seq analysis of 2102EP TGCT cells treated with 10 nM or 5 µM PFOS and 2012EP-C1 TGCT cells treated with 10 nM PFOS for 4 days compared to vehicle control. Gene set enrichment analysis (GSEA) showing gene sets and representative gene set enrichment plots among the top 15 ranked by normalized enrichment score (NES) altered by PFOS. Complete lists are in Supplemental Table S2.
Figure 5
Figure 5
PFOS alters gene expression associated with H3K27me3, DNA methylation, and other pathways associated with pro-cancer phenotypes in human TGCT cells. Results of the RNA-seq analysis of 2102EP TGCT cells treated with 10 nM or 5 µM PFOS and 2012EP-C1 TGCT cells treated with 10 nM PFOS for 4 days compared to vehicle control. Gene set enrichment analysis (GSEA) showing gene sets and representative gene set enrichment plots among the top 15 ranked by normalized enrichment score (NES) altered by PFOS. Complete lists are in Supplemental Table S2.
Figure 6
Figure 6
PFOS alters metabolite profiles of TGCT cells. GC-MS metabolite profiling of 2102EP and 2102EP-C1 cells treated for 4 days with 10 nM and 100 nM PFOS. Enrichment pathway analysis was performed with MetaboAnalyst 5.0.
Figure 7
Figure 7
PFOS alters metabolite products associated with fatty acid and steroid biosynthesis in TGCT cells. 2102EP and 2102EP-C1 cells were treated for 4 days with 10 nM and 100 nM PFOS. (A) Compilation of most commonly significantly enriched metabolic pathways as performed with MetaboAnalyst 5.0 across cell lines and treatments. (B) Univariate analysis demonstrating significantly altered fatty acid-related metabolites upon PFOS treatments. Metabolite units are in peak area adjusted for internal standard. Data represent mean +/− standard error of the mean. * p ≤ 0.05, ** p ≤ 0.01.

References

    1. Interstate Technology and Regulatory Council PFAS Technical and Regulatory Guidance Document and Fact Sheets. 2022. [(accessed on 10 December 2022)]. Available online: https://pfas-1.itrcweb.org/wp-content/uploads/2022/09/PFAS-Guidance-Docu....
    1. Organization for Economic Co-Operation and Development Toward a New Comprehensive Global Database oF Per- and Polyfluoroalkyl Substance (PFAS): Summary Report on Updating the OECD 2007 List of Per- and Polyfluoroalkyl Substances (PFAS) 2018. [(accessed on 10 December 2023)]. Available online: https://www.oecd.org/officialdocuments/publicdisplaydocumentpdf/?cote=EN....
    1. Sunderland E.M., Hu X.C., Dassuncao C., Tokranov A.K., Wagner C.C., Allen J.G. A review of the pathways of human exposure to poly- and perfluoroalkyl substances (PFAS) and present understanding of health effects. J. Expo. Sci. Environ. Epidemiol. 2019;29:131–147. doi: 10.1038/s41370-018-0094-1. - DOI - PMC - PubMed
    1. Anderko L., Pennea E. Exposures to per-and polyfluoroalkyl substances (PFAS): Potential risks to reproductive and children’s health. Curr. Probl. Pediatr. Adolesc. Health Care. 2020;50:100760. doi: 10.1016/j.cppeds.2020.100760. - DOI - PubMed
    1. Wikström S., Lin P.I., Lindh C.H., Shu H., Bornehag C.G. Maternal serum levels of perfluoroalkyl substances in early pregnancy and offspring birth weight. Pediatr. Res. 2020;87:1093–1099. doi: 10.1038/s41390-019-0720-1. - DOI - PMC - PubMed