

Evaluation of a Proportional Response Addition Approach to Mixture Risk Assessment and Predictive Toxicology Using Data on Four Trihalomethanes from the U.S. EPA's Multiple-Purpose Design Study
- PMID: 38668462
- PMCID: PMC11053411
- DOI: 10.3390/toxics12040240
Evaluation of a Proportional Response Addition Approach to Mixture Risk Assessment and Predictive Toxicology Using Data on Four Trihalomethanes from the U.S. EPA's Multiple-Purpose Design Study
Abstract
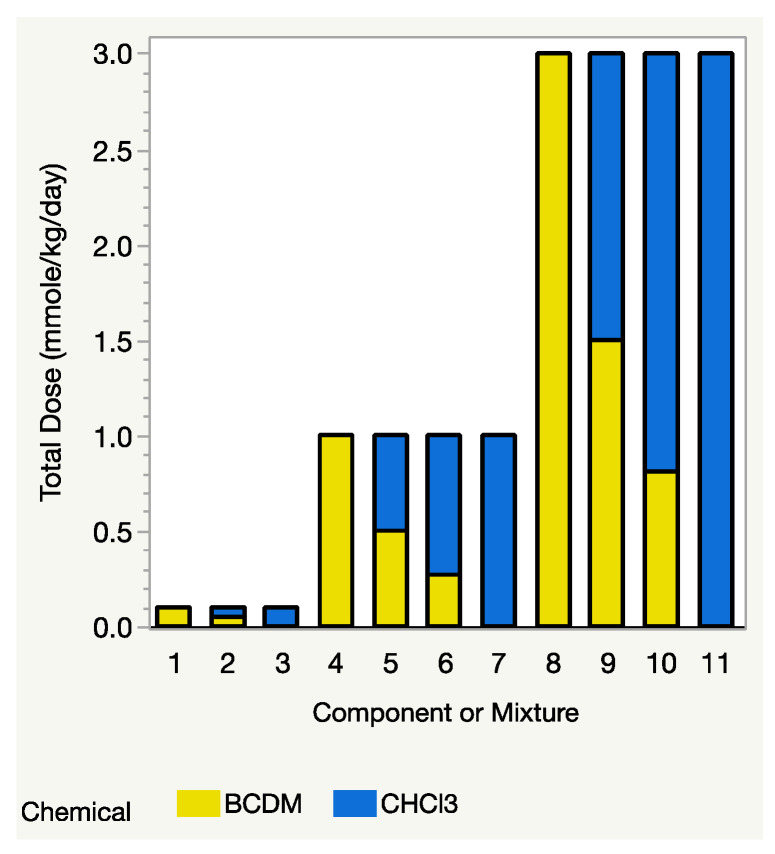
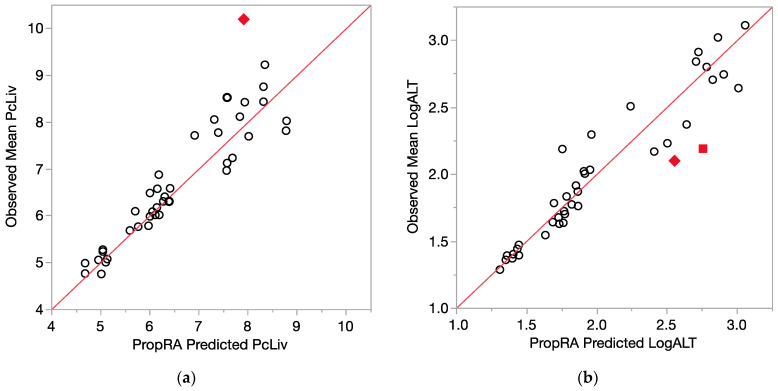
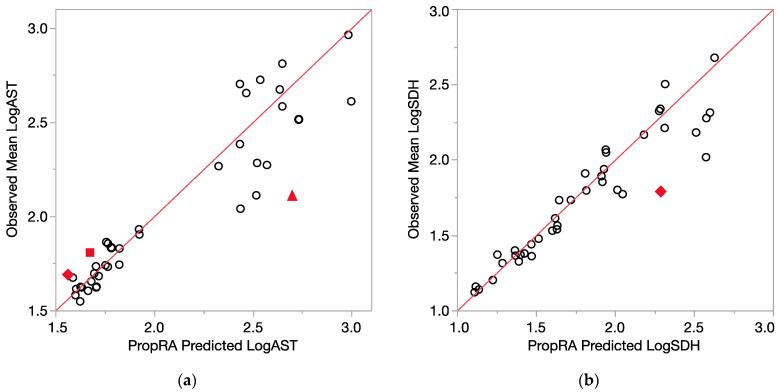
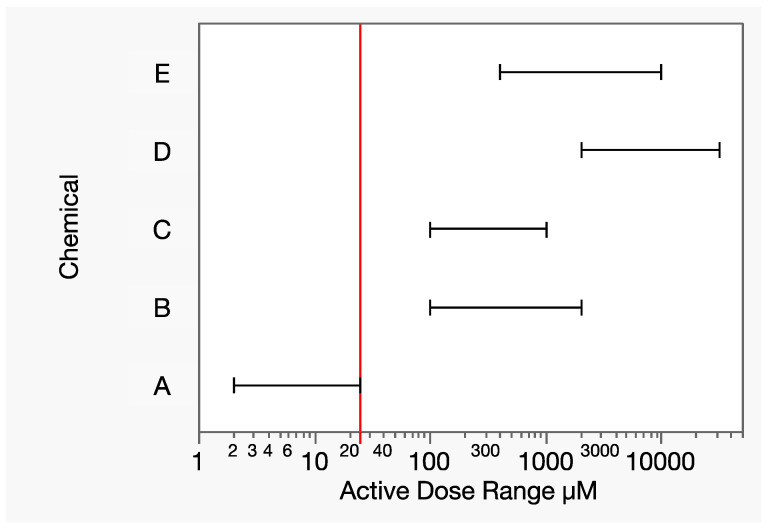
In this study, proportional response addition (Prop-RA), a model for predicting response from chemical mixture exposure, is demonstrated and evaluated by statistically analyzing data on all possible binary combinations of the four regulated trihalomethanes (THMs). These THMs were the subject of a multipurpose toxicology study specifically designed to evaluate Prop-RA. The experimental design used a set of doses common to all components and mixtures, providing hepatotoxicity data on the four single THMs and the binary combinations. In Prop-RA, the contribution of each component to mixture toxicity is proportional to its fraction in the mixture based on its response at the total mixture dose. The primary analysis consisted of 160 evaluations. Statistically significant departures from the Prop-RA prediction were found for seven evaluations, with three predications that were greater than and four that were less than the predicted response; interaction magnitudes (n-fold difference in response vs. prediction) ranged from 1.3 to 1.4 for the former and 2.6 to 3.8 for the latter. These predictions support the idea that Prop-RA works best with chemicals where the effective dose ranges overlap. Prop-RA does not assume the similarity of toxic action or independence, but it can be applied to a mixture of components that affect the same organ/system, with perhaps unknown toxic modes of action.
Keywords: Scheffé confidence interval; hepatotoxicity; independent action; linear contrasts; mixture risk estimation; predictive computational toxicology; toxicological interaction.
Conflict of interest statement
Author Linda K. Teuschler was employed by the company LK Teuschler & Associates, St. Petersburg; and author Richard C. Hertzberg was employed by the company Biomathematics Consulting. The U.S. EPA participated in the design of the study; in the collection, analyses, and interpretation of data; in the writing of the manuscript; and in the decision to publish the results. The remaining authors declare that the research was conducted in the absence of any commercial or financial relationships that could be construed as a potential conflict of interest.
Figures
Similar articles
-
Evaluation of the Interaction-Based Hazard Index Formula Using Data on Four Trihalomethanes from U.S. EPA's Multiple-Purpose Design Study.Toxics. 2024 Apr 23;12(5):305. doi: 10.3390/toxics12050305. Toxics. 2024. PMID: 38787084 Free PMC article.
-
A four-step approach to evaluate mixtures for consistency with dose addition.Toxicology. 2013 Nov 16;313(2-3):134-44. doi: 10.1016/j.tox.2012.10.016. Epub 2012 Nov 9. Toxicology. 2013. PMID: 23146763
-
Toxicology and carcinogenesis studies of a binary mixture of 3,3',4,4',5-pentachlorobiphenyl (PCB 126) (Cas No. 57465-28-8) and 2,3',4,4',5-pentachlorobiphenyl (PCB 118) (Cas No. 31508-00-6) in female Harlan Sprague-Dawley rats (gavage studies).Natl Toxicol Program Tech Rep Ser. 2006 Nov;(531):1-218. Natl Toxicol Program Tech Rep Ser. 2006. PMID: 17342196
-
Evaluating the similarity of complex drinking-water disinfection by-product mixtures: overview of the issues.J Toxicol Environ Health A. 2009;72(7):429-36. doi: 10.1080/15287390802608890. J Toxicol Environ Health A. 2009. PMID: 19267305 Review.
-
Can mode of action predict mixture toxicity for risk assessment?Toxicol Appl Pharmacol. 2004 Dec 1;201(2):85-96. doi: 10.1016/j.taap.2004.05.005. Toxicol Appl Pharmacol. 2004. PMID: 15541748 Review.
Cited by
-
Evaluation of the Interaction-Based Hazard Index Formula Using Data on Four Trihalomethanes from U.S. EPA's Multiple-Purpose Design Study.Toxics. 2024 Apr 23;12(5):305. doi: 10.3390/toxics12050305. Toxics. 2024. PMID: 38787084 Free PMC article.
References
-
- Hertzberg R.C., Mumtaz M.M. Component-based risk assessment approaches with additivity and interactions. In: Rider C.V., Simmons J.E., editors. Chemical Mixtures and Combined Chemical and Nonchemical Stressors: Exposure, Toxicity, Analysis, and Risk. Springer International Publishing; Berlin/Heidelberg, Germany: 2018. pp. 369–420.
-
- EFSA International Frameworks Dealing with Human Risk Assessment of Combined Exposure to Multiple Chemicals. EFSA J. 2013;11:3313.
-
- Dinse G.E., Umbach D.M. Dose-response modeling. In: Rider C.V., Simmons J.E., editors. Chemical Mixtures and Combined Chemical and Nonchemical Stressors: Exposure, Toxicity, Analysis, and Risk. Springer International Publishing; Berlin/Heidelberg, Germany: 2018. pp. 205–234.
-
- Gennings C. Comparing predicted additivity models to observed mixture data. In: Rider C.V., Simmons J.E., editors. Chemical Mixtures and Combined Chemical and Nonchemical Stressors: Exposure, Toxicity, Analysis, and Risk. Springer International Publishing; Berlin/Heidelberg, Germany: 2018. pp. 291–306.
Grants and funding
LinkOut - more resources
Full Text Sources
Research Materials
