. 2024 Apr 26;10(17):eadj9581.
doi: 10.1126/sciadv.adj9581. Epub 2024 Apr 26.

Inputs to the locus coeruleus from the periaqueductal gray and rostroventral medulla shape opioid-mediated descending pain modulation

Affiliations

Inputs to the locus coeruleus from the periaqueductal gray and rostroventral medulla shape opioid-mediated descending pain modulation

Susan T Lubejko et al. Sci Adv. .

Abstract

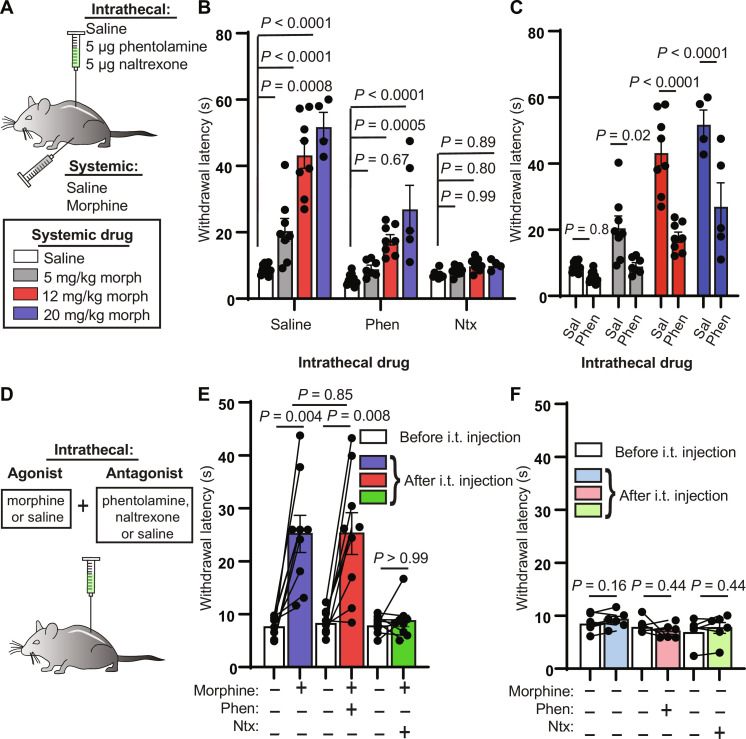
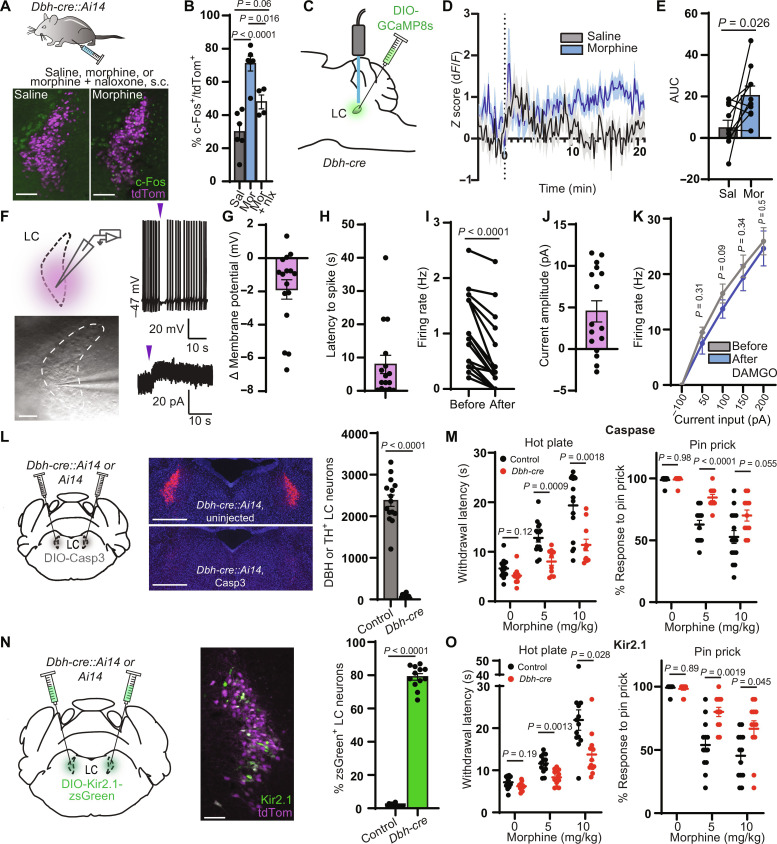
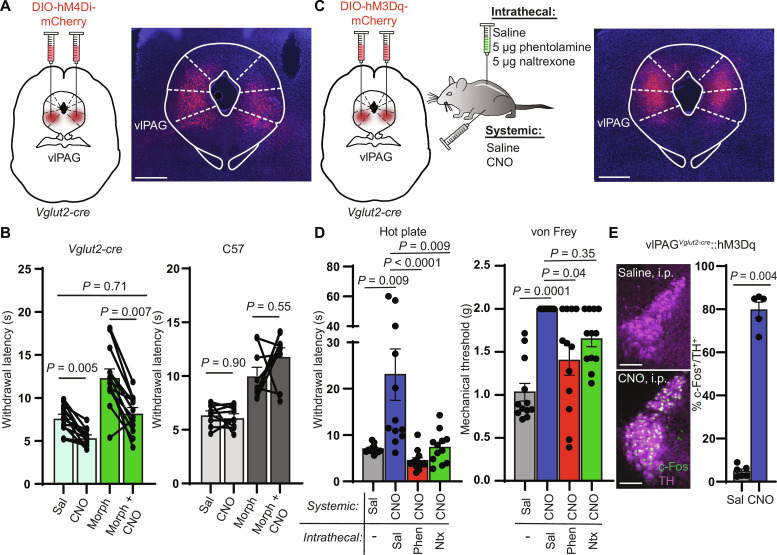
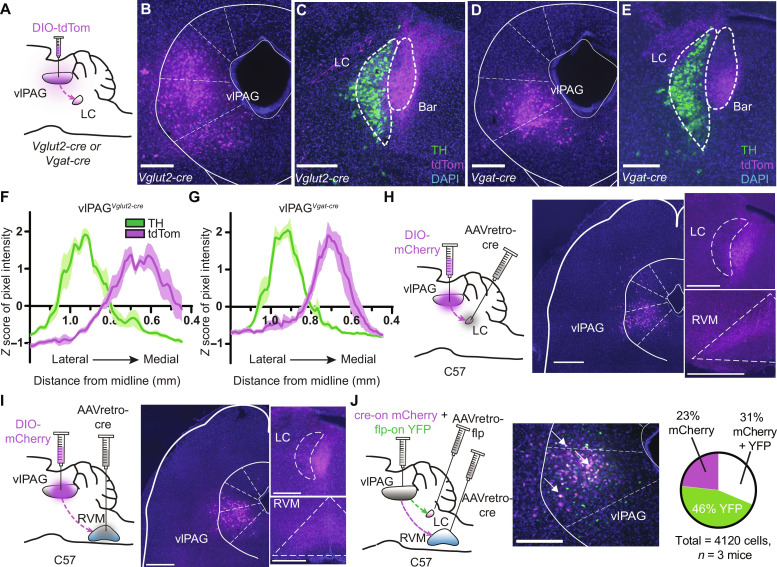
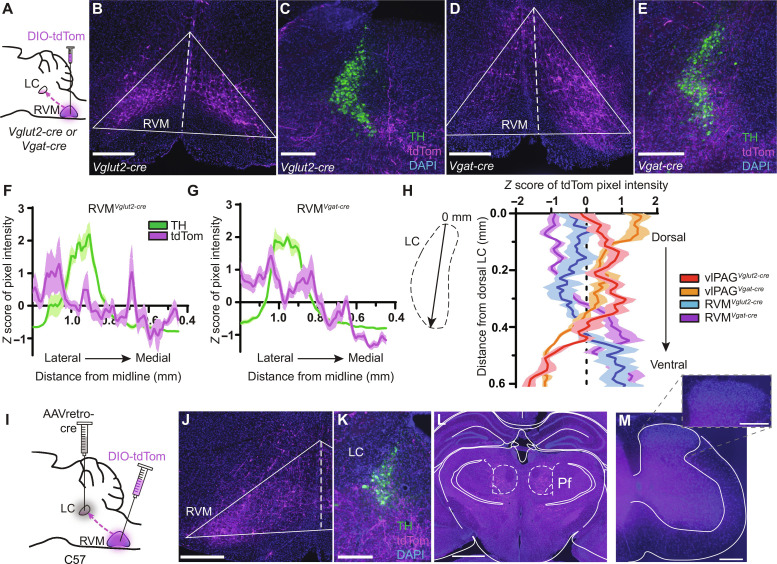
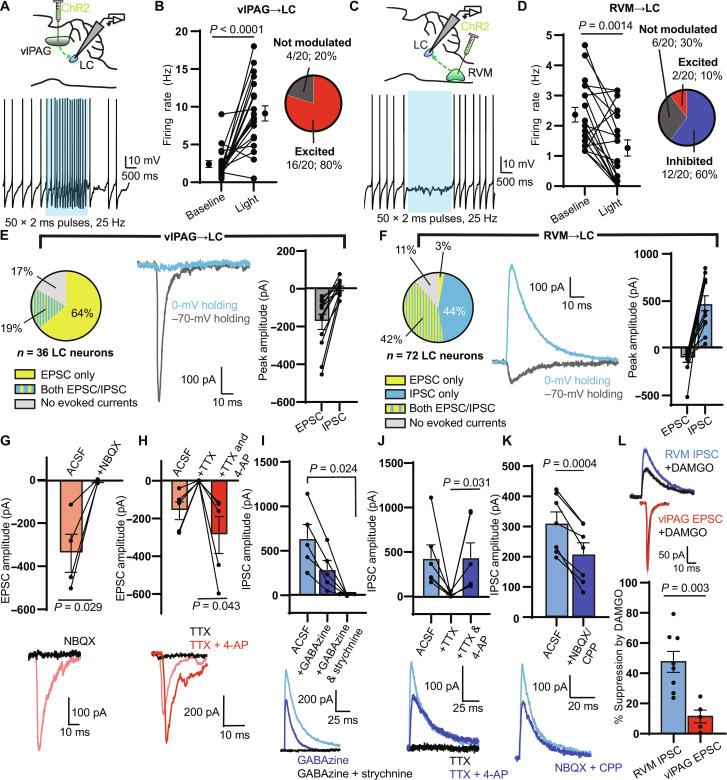
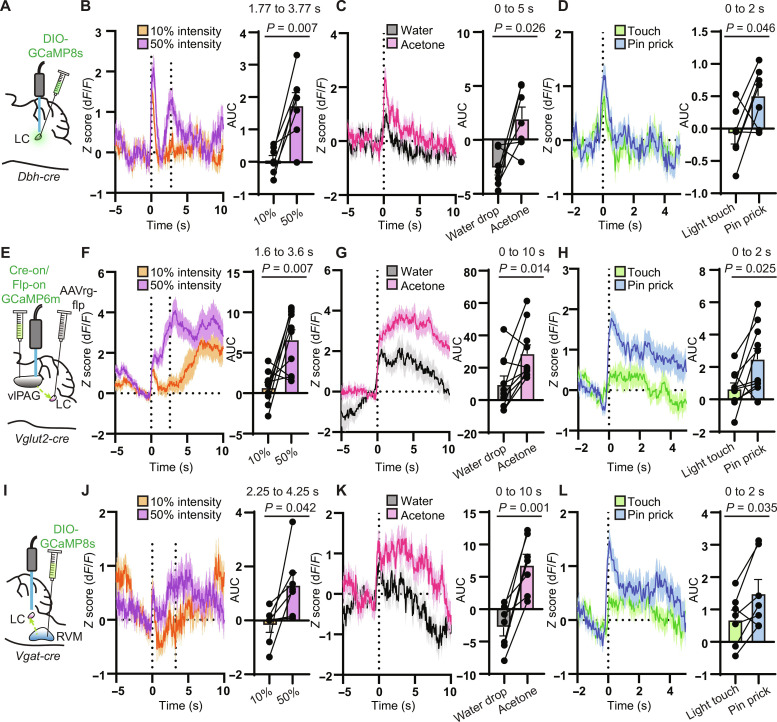
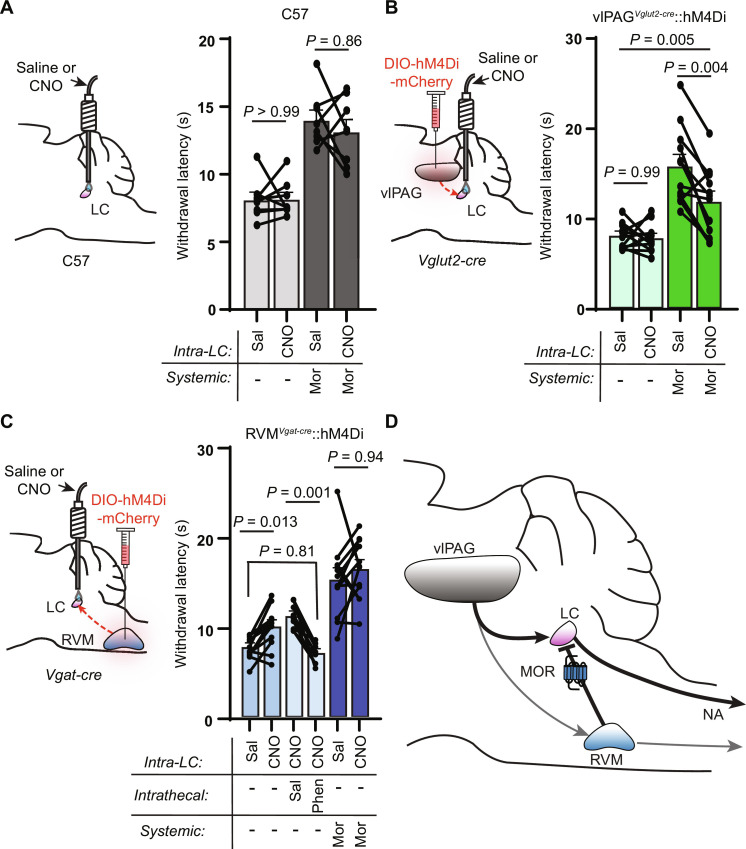
The supraspinal descending pain modulatory system (DPMS) shapes pain perception via monoaminergic modulation of sensory information in the spinal cord. However, the role and synaptic mechanisms of descending noradrenergic signaling remain unclear. Here, we establish that noradrenergic neurons of the locus coeruleus (LC) are essential for supraspinal opioid antinociception. While much previous work has emphasized the role of descending serotonergic pathways, we find that opioid antinociception is primarily driven by excitatory output from the ventrolateral periaqueductal gray (vlPAG) to the LC. Furthermore, we identify a previously unknown opioid-sensitive inhibitory input from the rostroventromedial medulla (RVM), the suppression of which disinhibits LC neurons to drive spinal noradrenergic antinociception. We describe pain-related activity throughout this circuit and report the presence of prominent bifurcating outputs from the vlPAG to the LC and the RVM. Our findings substantially revise current models of the DPMS and establish a supraspinal antinociceptive pathway that may contribute to multiple forms of descending pain modulation.


Figures

Fig. 1.
Fig. 1.. Intrathecal noradrenergic and opioidergic antagonists attenuate systemic morphine antinociception.
(A) Schematic of intrathecal and systemic injection combinations and morphine doses. (B) Hot plate withdrawal latencies resulting from increasing doses (0, 5, 12, and 20 mg/kg, s.c.) of morphine grouped by intrathecal antagonist [saline versus 5 μg of phentolamine versus 5 μg of naltrexone; ordinary two-way analysis of variance (ANOVA) with Tukey’s multiple comparisons test; intrathecal drug effect, P < 0.0001, F2,81 = 95.35]. (C) Same data as in (B) from intrathecal saline and phentolamine groups reorganized by systemic morphine dose to facilitate comparisons (ordinary two-way ANOVA with Sidak’s multiple comparisons test; intrathecal drug effect, P < 0.0001, F1,52 = 63.07). (D) Intrathecal coadministration of morphine (2.5 μg) or saline with saline, phentolamine, or naltrexone. (E) Hot plate withdrawal latencies before (white) and after (blue, saline; red, phentolamine; green, naltrexone) intrathecal (i.t.) injection of morphine and antagonist (pre- versus post-intrathecal injection, n = 9 pairs each, two-sided Wilcoxon matched-pairs signed rank test; post-intrathecal morphine + saline versus post-intrathecal morphine + phentolamine, n = 9 saline, n = 9 phentolamine, two-sided Mann-Whitney test). (F) Hot plate withdrawal latencies before (white) and after (light blue, saline; pink, phentolamine; light green, naltrexone) intrathecal injection of saline and antagonist (pre- versus post-intrathecal injection, n = 6 pairs each, two-sided Wilcoxon matched-pairs signed rank test). All graphs depict means ± SEM.
Fig. 2.
Fig. 2.. LC activity is required for systemic morphine antinociception.
(A) c-Fos expression after injection. Scale bars, 150 μm. (B) Percentage of LC neurons that colocalize with c-Fos (five to eight images per mouse; n = 6 saline, n = 6 morphine, n = 4 naloxone; one-way ANOVA with Tukey’s multiple comparisons test, P < 0.0001, F2,13 = 20.97). (C) Injection of GCaMP8s and fiber implantation for fiber photometry. (D) Average normalized Ca2+ response to morphine or saline at time 0 (n = 10 mice). (E) Area under the curve (AUC) from 0 to 20 min (two-sided paired t test: t = 2.652, n = 10 pairs). (F) Left: Slice recordings from LC neurons with light-evoked uncaging. Scale bar, 150 μm. Right: Representative traces of CNV-Y-DAMGO uncaging (purple arrows, 50 ms; 365-nm LED, 84 mW) in current (top) and voltage clamp (bottom). (G to J) Response to CNV-Y-DAMGO uncaging (n = 16 cells). (G) Change in membrane potential. (H) Latency to spike after uncaging. (I) Tonic firing rate in the 10 s before and after uncaging (P < 0.0001, two-sided Wilcoxon matched-pairs signed rank test). (J) Outward current amplitude. (K) f-I curves before and after DAMGO bath application (n = 7 cells; two-sided Wilcoxon matched-pairs signed rank test at each current level). (L) Quantification of neuronal ablation by AAV-DIO-Casp3 (scale bars, 500 μm; n = 11 Dbh-cre, n = 15 control; two-sided Mann-Whitney test). (M) Left: Hot plate withdrawal latencies after morphine. Right: Response to 10 hind paw pin pricks (n = 11 Dbh-cre, n = 15 control; two-way repeated-measures ANOVA with Sidak’s multiple comparisons test; hot plate: P = 0.0006, F1,24 = 15.67; pin: P = 0.0006, F1,24 = 15.52. (N) Representative image of zsGreen expression in the LC (scale bar, 150 μm) and quantification of viral coverage (n = 12 Dbh-cre, n = 13 control; two-sided Mann-Whitney test). (O) Same as (M) for Kir2.1 silencing (n = 12 Dbh-cre, n = 13 control; two-way repeated-measures ANOVA with Sidak’s multiple comparisons test, hot plate: P = 0.001, F1,23 = 14.30; pin: P = 0.0004, F1,23 = 17.20). Data reported as means ± SEM.
Fig. 3.
Fig. 3.. vlPAG activity is required for systemic morphine antinociception and drives spinal NA–dependent antinociception.
(A) Bilateral vlPAG AAV-DIO-hM4Di-mCherry injections in Vglut2-cre mice with representative image of viral expression. Scale bar, 500 μm. (B) Left: Hot plate withdrawal latencies of vlPAGVglut2-cre::hM4Di mice administered CNO (3 mg/kg i.p.) versus saline without (light green bars) and with morphine (5 mg/kg s.c.) (dark green bars) (two-way repeated-measures ANOVA with Tukey’s multiple comparisons test; n = 13 mice; saline versus CNO effect, P < 0.0001, F1,12 = 56.93). Right: Withdrawal latencies of non–virus-injected controls (two-way repeated-measures ANOVA with Tukey’s multiple comparisons test; n = 9 mice; saline versus CNO effect, P = 0.32, F1,8 = 1.143). (C) Bilateral vlPAG AAV-DIO-hM3Dq-mCherry injections in Vglut2-cre mice, combinations of systemic CNO with intrathecal antagonists, and representative image of viral expression. Scale bar, 500 μm. (D) Left: Withdrawal latencies after systemic saline or CNO and intrathecal saline, phentolamine (5 μg), or naltrexone (5 μg) (Friedman test with Dunn’s multiple comparisons test, n = 12 subjects, P < 0.0001, Friedman statistic = 26.40). Right: Von Frey mechanical thresholds (Friedman test with Dunn’s multiple comparisons test, n = 12 subjects, P = 0.0001, Friedman statistic = 21.00). (E) Representative images of c-Fos immunohistochemistry in TH-positive LC neurons of vlPAGVglut2-cre::hM3Dq mice after systemic injection of saline (top) or CNO (bottom). Scale bars, 150 μm. Right: % of TH-positive LC neurons that colocalize with green c-Fos signal (five to eight images analyzed per mouse; n = 6 saline, n = 5 CNO, two-sided Mann-Whitney test). Data in each graph reported as means ± SEM.
Fig. 4.
Fig. 4.. Anatomical characterization of inputs to the LC from the vlPAG.
(A) vlPAG injection of AAV-DIO-tdTom in Vglut2- or Vgat-cre mice. (B) Vglut2-cre injection site. (C) vlPAGVglut2-cre terminals (magenta) and TH (green) in the peri-LC. Bar, Barrington’s nucleus. (D) Vgat-cre injection site. (E) vlPAGVgat-cre terminals. Scale bars, 300 μm [(B) to (E)]. (F) Quantification of magenta and green pixel intensity in the peri-LC of vlPAGVglut2-cre::tdTom mice normalized by z score (n = 6 LC slices from three mice). (G) Same as (F) for vlPAGVgat-cre::tdTom. (H) Left: Injections of AAVretro-cre in the LC and AAV-DIO-mCherry in the vlPAG of wild-type mice. Middle: Image of mCherry+ vlPAG neurons. Right: Resulting terminals in the LC and RVM. Scale bars, 500 μm. (I) Same as (H) for vlPAG→RVM neurons. Scale bars, 500 μm. (J) Left: Orthogonal recombinase strategy to label vlPAG neurons that project to the RVM and LC. Middle: Representative image of mCherry (magenta) and YFP (green). Arrows indicate double-labeled (white) neurons. Scale bar, 300 μm. Right: Quantification of mCherry and YFP in the vlPAG.
Fig. 5.
Fig. 5.. Anatomical characterization of inputs to the LC from the RVM.
(A) RVM injection of AAV-DIO-tdTom in Vglut2- or Vgat-cre mice. (B) Vglut2-cre injection site. (C) RVMVglut2-cre terminals (magenta) and TH (green) in the peri-LC. (D) Vgat-cre injection site. (E) RVMVgat-cre terminals. Scale bars, 300 μm (B to E). (F) Quantification of magenta and green pixel intensity in the peri-LC of RVMVglut2-cre::tdTom mice normalized by z score (n = 6 LC slices from three mice). (G) Same as (F) for RVMVgat-cre::tdTom. (H) Quantification of terminal intensity across the somatic LC DV axis for all projection origin and cell type combinations (n = 6 LC slices from three mice each). (I) Injections of AAVretro-cre in the LC and AAV-DIO-tdTom in the RVM of wild-type mice. (J) tdTom+ RVM neurons. (K) Resulting terminals in the LC and peri-LC. Scale bars, 300 μm [(J) and (K)]. (L) tdTom+ fibers in the bilateral thalamic parafascicular nucleus. Scale bar, 1 mm. (M) Representative lumbar spinal section. Inset: Zoom in of the dorsal horn. Scale bars, 300 μm.
Fig. 6.
Fig. 6.. Electrophysiological characterization of inputs from the vlPAG and RVM to the LC.
(A) Top: vlPAG ChR2 viral injection for LC slice electrophysiology. Bottom: Representative trace of tonic spiking during a 2-s blue LED stimulus (470 nm, 50 × 2-ms pulses, 25 Hz, 18 mW). (B) Left: Firing rate before and during the stimulus (n = 20 neurons; two-sided Wilcoxon matched-pairs signed rank test). Right: Categorization of neurons as “excited” (z score of spiking during versus before light > 2), “inhibited” (z score < −2), or “not modulated.” (C) Same as (A) for ChR2 expressed in the RVM. (D) Same as (B) for RVM terminal stimulation (n = 20 neurons; two-sided Wilcoxon matched-pairs signed rank test). (E) Left: Proportion of LC neurons with oEPSCs and oIPSCs during vlPAG terminal stimulation (1 × 5-ms pulse, 18 mW). Middle: Representative example of an oEPSC and oIPSC in a single LC neuron. Right: Peak amplitude of oEPSCs and oIPSCs (n = 12 neurons). (F) Same as (E) for RVM terminal stimulation (n = 12 neurons). (G to K) Top: Summary bar graphs of oEPSC/IPSC amplitude. Bottom: Representative examples. (G) NBQX effect on vlPAG oEPSC amplitude (two-sided paired t test: t = 3.950, n = 4 pairs). (H) TTX and 4-AP effect on vlPAG oEPSC amplitude (two-sided paired t test: t = 2.926, n = 5 pairs). (I) Effect of GABAzine and strychnine on RVM oIPSC (repeated-measures one-way ANOVA with Dunnett’s multiple comparisons test, P = 0.013, F1.087,4.348 = 16.32, n = 5 cells). (J) Same as (H) for RVM oIPSCs (two-sided Wilcoxon matched-pairs signed rank test, n = 6 pairs). (K) Effect of NBQX and CPP on RVM oIPSC amplitude (two-sided paired t test: t = 6.976, n = 7 pairs). (L) Top: Examples of RVM oIPSCs (blue) and vlPAG oEPSCs (red) after bath application of DAMGO (1 μM; black). Bottom: Opioid sensitivity reported as % suppression of amplitude (two-sided unpaired t test: t = 3.785, n = 8 RVM oIPSC, n = 5 vlPAG oEPSC). All summary data reported as means ± SEM.
Fig. 7.
Fig. 7.. LC, vlPAG→LC, and RVM→LC neurons are responsive to noxious stimuli.
(A) Injection of AAV-DIO-GCaMP8s in Dbh-cre mice and fiber placement in the right LC. (B) Left: Normalized fluorescence change during the Hargreaves assay at 10% (orange) and 50% (purple) light intensity with light on at t = 0 s. The average withdrawal response to 50% intensity occurred at 2.77 s (n = 7 mice, 6 trials each). Right: AUC analysis per mouse from 1 s before to 1 s after the paw withdrawal (two-sided paired t test: t = 4.012). (C) Left: Fluorescence response to acetone or room temperature water on the hind paw (n = 7 mice, 4 trials each). Right: AUC analysis from 0 to 5 s (two-sided paired t test: t = 2.944). (D) Left: Fluorescence response to light touch with a 0.16-g von Frey fiber versus pin prick (n = 7 mice, 6 trials each). Right: AUC analysis from 0 to 2 s (two-sided paired t test: t = 2.510). (E) Injection of AAVretro-FlpO in the LC of Vglut2-cre mice and Cre-on/Flp-on GCaMP6m with fiber over right PAG. (F) Same as (B) for vlPAG→LC neurons. Average withdrawal at 2.60 s (n = 10 mice, 6 trials each; two-sided paired t test: t = 3.507). (G) Same as (C) for vlPAG→LC. AUC analysis taken from 0 to 10 s (n = 10 mice, 4 trials each; Wilcoxon matched-pairs signed rank test). (H) Same as (D) for vlPAG→LC (n = 10 mice, 6 trials each; two-sided paired t test: t = 2.698). (I) Injection of AAV-DIO-GCaMP8s in the RVM of Vgat-cre mice with fiber over right LC. (J) Same as (F) for RVM→LC terminals. Average withdrawal at 3.25 s (n = 7 mice, 6 trials each; two-sided paired t test: t = 2.570). (K) Same as (G) for RVM→LC terminals (n = 7 mice, 4 trials each; two-sided paired t test: t = 5.646). (L) Same as (H) for RVM→LC terminals (n = 7 mice, 6 trials each; two-sided paired t test: t = 2.721). Graphs represent means ± SEM.
Fig. 8.
Fig. 8.. Pathway-specific modulation of vlPAG and RVM terminals in the LC modulates nociceptive behavior.
(A) Left: Bilateral cannula placement over the LC in uninjected control mice. Right: Hot plate withdrawal latencies of control mice microinfused in the LC with saline (150 nl) versus CNO (3 μM, 150 nl) without (light gray) and with morphine (5 mg/kg s.c.) (dark gray; two-way repeated-measures ANOVA with Tukey’s multiple comparisons test; n = 8 mice; saline versus CNO effect, P = 0.4178, F1,7 = 0.7412). (B) Left: Bilateral viral injection of AAV-DIO-hM4Di-mCherry in the vlPAG of Vglut2-cre mice with bilateral cannula placement over the LC. Right: Hot plate withdrawal latencies after microinfusion with saline versus CNO without (light green) and with morphine (5 mg/kg s.c.) (dark green; two-way repeated-measures ANOVA with Sidak’s multiple comparisons test; n = 12 mice; saline versus CNO effect, P = 0.0022, F1,11 = 15.72). (C) Left: Bilateral viral injection of AAV-DIO-hM4Di-mCherry in the RVM of Vgat-cre mice with bilateral cannula placement over the LC. Right: Hot plate withdrawal latencies after microinfusion of saline versus CNO (blue bars, n = 12 mice), microinfusion of CNO with intrathecal injections of saline versus phentolamine (5 μg, light blue bars, n = 9 mice), and microinfusion of saline versus CNO with morphine (5 mg/kg s.c.) (dark blue, n = 12 mice; mixed-effects analysis with matching across row and Tukey’s multiple comparisons test, P < 0.0001, F2.560,25.09 = 27.36). (D) Circuit diagram of DPMS inputs to the LC and their opioid sensitivity. Data in each graph reported as means ± SEM.

Update of

References

    1. Millan M. J., Descending control of pain. Prog. Neurobiol. 66, 355–474 (2002). - PubMed
    1. François A., Low S. A., Sypek E. I., Christensen A. J., Sotoudeh C., Beier K. T., Ramakrishnan C., Ritola K. D., Sharif-Naeini R., Deisseroth K., Delp S. L., Malenka R. C., Luo L., Hantman A. W., Scherrer G., A brainstem-spinal cord inhibitory circuit for mechanical pain modulation by GABA and Enkephalins. Neuron 93, 822–839.e6 (2017). - PMC - PubMed
    1. Basbaum A., Fields H. L., Endogenous pain control systems: Brainstem spinal pathways and endorphin circuitry. Annu. Rev. Neurosci. 7, 309–338 (1984). - PubMed
    1. Heinricher M. M., Tavares I., Leith J. L., Lumb B. M., Descending control of nociception: Specificity, recruitment and plasticity. Brain Res. Rev. 60, 214–225 (2009). - PMC - PubMed
    1. Lau B. K., Vaughan C. W., Descending modulation of pain: The GABA disinhibition hypothesis of analgesia. Curr. Opin. Neurobiol. 29, 159–164 (2014). - PubMed

Publication types

Substances