. 2024 Apr 26;10(17):eadn3760.
doi: 10.1126/sciadv.adn3760. Epub 2024 Apr 26.

Vagus nerve stimulation modulates distinct acetylcholine receptors on B cells and limits the germinal center response

Affiliations

Vagus nerve stimulation modulates distinct acetylcholine receptors on B cells and limits the germinal center response

Izumi Kurata-Sato et al. Sci Adv. .

Abstract

Acetylcholine is produced in the spleen in response to vagus nerve activation; however, the effects on antibody production have been largely unexplored. Here, we use a chronic vagus nerve stimulation (VNS) mouse model to study the effect of VNS on T-dependent B cell responses. We observed lower titers of high-affinity IgG and fewer antigen-specific germinal center (GC) B cells. GC B cells from chronic VNS mice exhibited altered mRNA and protein expression suggesting increased apoptosis and impaired plasma cell differentiation. Follicular dendritic cell (FDC) cluster dispersal and altered gene expression suggested poor function. The absence of acetylcholine-producing CD4+ T cells diminished these alterations. In vitro studies revealed that α7 and α9 nicotinic acetylcholine receptors (nAChRs) directly regulated B cell production of TNF, a cytokine crucial to FDC clustering. α4 nAChR inhibited coligation of CD19 to the B cell receptor, presumably decreasing B cell survival. Thus, VNS-induced GC impairment can be attributed to distinct effects of nAChRs on B cells.


Figures

Fig. 1.
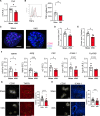
Fig. 1.. Chronic VNS reduces the GC response.
Mice implanted with a stimulation electrode on the left cervical vagus nerve received 5 min of VNS twice a day for 4 weeks while they were freely moving; a TD B cell response was assessed in these animals. (A) Schema of chronic vagus implant and home cage with integrated VNS system. (B) Experimental schema of chronic VNS. (C) Quantification of high-affinity (NP2) and low-affinity (NP25) anti-NP antibody titers in serum. (D) ELISpot assays of anti-NP antibody secreting cells on day 14 postimmunization. (E) Total GC B cells in spleen on day 14. Representative flow cytometry plots for each condition. (F) GC formation in spleen on day 14. Representative image of chronic VNS and sham spleens stained with anti-B220 (blue) antibody and peanut agglutinin (PNA; white). B220+ PNA+ spots were analyzed as GC. Scale bars, 100 μm. Five or six GCs were assessed with two different slides per mouse. Each dot represents an individual GC (top right) and individual mouse (bottom right). (G) NP-specific GC B cells in spleen on day 14. Representative flow cytometry plots for each condition. Data are shown as mean ± SEM with each symbol representing an individual mouse. Data are combined from two independent experiments. Asterisks indicate significant differences (*P < 0.05) obtained using two-way analysis of variance (ANOVA) (C) and Mann-Whitney U test [(D) to (G)]. CA, carotid artery; VN, vagus nerve; IJV, internal jugular vein. (A) and (B) Created with BioRender.com. OD, optical density.
Fig. 2.
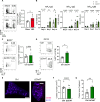
Fig. 2.. Alteration of GC B cell composition and survival.
Splenic B cells were collected from VNS and sham mice on day 14 and analyzed. (A) Centrocytes (LZ GC B cells) and centroblasts (DZ GC B cells) in VNS mice. (B) Frequency of active caspase-3+ apoptotic cells in distinct GC B cell subsets assessed with flow cytometry. (C) Gene expression of sorted live NP+ GC B cells was assessed with qRT-PCR. Relative expression to Polr2a is shown. (D) Blimp1 expression of NP-GC B cells was assessed with flow cytometry. Representative histograms for sham (black) and VNS (red) condition. Tinted gray histogram indicates a fluorescence-minus-one (FMO) control. Geometric mean fluorescent intensity was compared. (E) UMAP of GC B cell of sham and VNS mice. NP+ GL7+ B cells were sorted from four sham and four VNS mice and underwent single-cell analysis. After quality control, one sham and one VNS mouse were omitted from analysis because of the limited GC B cell numbers (<50). Each cluster was annotated using differentially expressed genes with the other clusters found by single-cell RNA sequencing (details shown in supplementary figures). (F) Proportion of each GC B cell cluster. Data are shown as mean ± SEM with each symbol representing an individual mouse from two [(A) to (D)] or single [(E) and (F)] independent experiments. Asterisks indicate significant differences (*P < 0.05 and **P < 0.01) obtained using Mann-Whitney U test. R.E, relative expression; FI, fluorescent intensity.
Fig. 3.
Fig. 3.. Chronic VNS causes FDC dispersion, decreased TNF production by GC B cells, and altered FDC gene expression.
Spleens were harvested from chronic VNS and sham mice at day 14 and analyzed. (A) TNF gene expression in total GC B cells sorted from the spleens at day 14. The expression was assessed by qRT-PCR. (B) TNFα expression of NP-GC B cells was assessed with flow cytometry. Representative histograms for sham (black) and chronic VNS (red) condition. Tinted gray histogram indicates FMO control. Geometric mean fluorescent intensity was compared. (C) Representative image of chronic VNS and sham spleens stained with anti-CD35 (magenta), anti-B220 (blue) and anti-CD3 (green) antibodies. Magenta spots were analyzed as FDC clusters. Scale bars, 1000 μm. FDC cluster numbers (D) and areas (E) were assessed. Two different slides per mouse were analyzed and averaged. Cluster numbers were counted manually. Areas were assessed with ImageJ software. Each dot represents an individual mouse. (F) Gene expression in FDCs sorted from chronic VNS and sham mice at day 14. Expression of the indicated genes was assessed by qRT-PCR. (G) TNFR1 and (H) ICAM-1 expression in FDC clusters on day 14. Representative image of chronic VNS and sham spleens stained with anti-CD35 (white), anti-TNFR1 (red), and anti–ICAM-1 (blue) antibodies. Fluorescence intensity of TNFR1 and ICAM-1 in CD35+ lesion (yellow circle) was measured with ImageJ. Scale bars, 100 μm. Six clusters were assessed with two different slides per mouse. Five mice were assessed in each group. Each dot represents an individual cluster. Data are shown as mean ± SEM. Each symbol representing individual mouse combined from two independent cohorts. Asterisks indicate significant differences (*P < 0.05, ***P < 0.001, and ****P < 0.0001) obtained using Mann-Whitney U test.
Fig. 4.
Fig. 4.. CD4+ ChAT+ T cells impair the GC B cell response during chronic VNS.
(A) Frequency of ChAT+ T cells was analyzed using ChATeGFP reporter mice. Chronic VNS and sham mice were analyzed on day 14. (B) NP-specific antibody titers in serum from CD4-cre ChATWT (control) and CD4-cre ChAT flox/flox (ΔChAT) mice. Total (C) and NP-specific (D) GC B cells in spleens on day 14. (E) Representative images of splenic FDC clusters in control and ΔChAT mice. The numbers (F) and areas (G) were assessed using the same method as Fig. 3B. Data are shown as mean ± SEM with each symbol representing an individual mouse from one (A) or two [(B) to (D)] independent cohorts. Asterisks indicate significant differences (*P < 0.05, **P < 0.01) obtained using two-way ANOVA (B) or Mann-Whitney U test [(A), (C), (D), (F), and (G)].
Fig. 5.
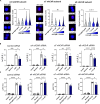
Fig. 5.. ACh directly regulates TLR9 signaling and BCR-mediated Akt phosphorylation via nicotinic receptors.
(A) TNF mRNA in nicotine exposed, CpG-treated FO B cells. Splenic FO B cells from untreated mice were sorted using flow cytometry and incubated with 2.5 μM CpG and/or the indicated amount of nicotine. Cells were collected after 4 hours incubation, and qRT-PCR was performed. (B) NF-κB p65 translocation to nucleus following CpG stimulation with or without nicotine exposure. Total B cells were isolated from untreated mice using magnetic sorting. Cells were incubated with the indicated amount of nicotine and/or 1.0 μM CpG for an hour. NF-κB p65 translocation was assessed by comparing similarity of 4′,6-diamidino-2-phenylindole (DAPI) and NF-κB staining morphology using imaging cytometry. (C) Scheme of BCR signaling pathways. Created with BioRender.com. (D) Phosphorylation of Akt (S473) following BCR activation with or without nicotine exposure. Splenocytes were collected from untreated mice and stimulated with or without nicotine and anti-IgM F(ab′)2. Phosphorylated Akt in FO B cells was quantified using flow cytometry. (E) Proximity ligation assay with membrane IgM and CD19. Total B cells were isolated from untreated mice and incubated with anti-IgM F(ab′)2 with or without nicotine. Proximity of membrane IgM and CD19 was assessed by counting signal spots. Three mice were assessed per condition, and three independent fields were analyzed per sample. (F) Phosphorylation of CD19 following BCR activation and nicotine exposure assessed using the same method as (D). Each dot represents an individual mouse. Data are shown as mean ± SEM [(A), (B), (D), and (F)]. Data from two to three independent experiments were combined and assessed. Hash marks indicate significant differences (#P < 0.05, ##P < 0.01, ###P < 0.001, and ####P < 0.0001) obtained using one-way repeated measure ANOVA test with Geisser-Greenhouse correction. Asterisks indicate significant differences (***P < 0.001, and ****P < 0.0001) obtained using paired t test. BF, bright field; N, nicotine.
Fig. 6.
Fig. 6.. α7 and α9 nAChRs regulate TNF production and α4 nAChR regulate BCR signaling.
(A) Proximity ligation assay with membrane IgM and nicotinic ACh receptor subunits, assessed with the same method as Fig. 5F. Three mice were assessed per condition, and three independent fields were analyzed per sample. (B) TNF mRNA in nAChR knocked down B cells. B cells were transfected with siRNA for each nAChR subunit or control. Transfected cells were isolated by flow cytometry and subsequently stimulated with CpG and nicotine. (C) Akt (S473) phosphorylation of nAChR knocked down FO B cells. B cells were transfected with siRNA for each nAChR or control siRNA. Transfected cells were isolated by flow cytometry and subsequently incubated with anti-IgM F(ab′)2 and nicotine. FO B cells were identified by flow cytometry (gating strategy is shown in fig. S5A). Data are shown as mean ± SEM [(B) and (C)]. Data from two to three independent experiments were combined and assessed. Hash marks indicate significant differences (#P < 0.05, ##P < 0.01) obtained using one-way repeated measure ANOVA test with Geisser-Greenhouse correction. Asterisks indicate significant differences (*P < 0.05, **P < 0.01, ***P < 0.001, and ****P < 0.0001) obtained using paired t test.

References

    1. Bonaz B., Sinniger V., Hoffmann D., Clarençon D., Mathieu N., Dantzer C., Vercueil L., Picq C., Trocmé C., Faure P., Cracowski J.-L., Pellissier S., Chronic vagus nerve stimulation in Crohn’s disease: A 6-month follow-up pilot study. Neurogastroenterol. Motil. 28, 948–953 (2016). - PubMed
    1. Koopman F. A., Chavan S. S., Miljko S., Grazio S., Sokolovic S., Schuurman P. R., Mehta A. D., Levine Y. A., Faltys M., Zitnik R., Tracey K. J., Tak P. P., Vagus nerve stimulation inhibits cytokine production and attenuates disease severity in Rheumatoid arthritis. Proc. Natl. Acad. Sci. U.S.A. 113, 8284–8289 (2016). - PMC - PubMed
    1. Wang H., Yu M., Ochani M., Amella C. A., Tanovic M., Susarla S., Li J. H., Wang H., Yang H., Ulloa L., Al-Abed Y., Czura C. J., Tracey K. J., Nicotinic acetylcholine receptor alpha7 subunit is an essential regulator of inflammation. Nature 421, 384–388 (2003). - PubMed
    1. Meroni E., Stakenborg N., Gomez-Pinilla P. J., Stakenborg M., Aguilera-Lizarraga J., Florens M., Delfini M., de Simone V., De Hertogh G., Goverse G., Matteoli G., Boeckxstaens G. E., Vagus nerve stimulation promotes epithelial proliferation and controls colon monocyte infiltration During DSS-induced colitis. Front. Med. 8, 694268 (2021). - PMC - PubMed
    1. Koren T., Rolls A., Immunoception: Defining brain-regulated immunity. Neuron 110, 3425–3428 (2022). - PMC - PubMed

Publication types

MeSH terms