. 2024 Apr 26;10(17):eadl1088.
doi: 10.1126/sciadv.adl1088. Epub 2024 Apr 26.

Prevention of age-related truncation of γ-glutamylcysteine ligase catalytic subunit (GCLC) delays cataract formation

Affiliations

Prevention of age-related truncation of γ-glutamylcysteine ligase catalytic subunit (GCLC) delays cataract formation

Zongbo Wei et al. Sci Adv. .

Abstract

A sharp drop in lenticular glutathione (GSH) plays a pivotal role in age-related cataract (ARC) formation. Despite recognizing GSH's importance in lens defense for decades, its decline with age remains puzzling. Our recent study revealed an age-related truncation affecting the essential GSH biosynthesis enzyme, the γ-glutamylcysteine ligase catalytic subunit (GCLC), at aspartate residue 499. Intriguingly, these truncated GCLC fragments compete with full-length GCLC in forming a heterocomplex with the modifier subunit (GCLM) but exhibit markedly reduced enzymatic activity. Crucially, using an aspartate-to-glutamate mutation knock-in (D499E-KI) mouse model that blocks GCLC truncation, we observed a notable delay in ARC formation compared to WT mice: Nearly 50% of D499E-KI mice remained cataract-free versus ~20% of the WT mice at their age of 20 months. Our findings concerning age-related GCLC truncation might be the key to understanding the profound reduction in lens GSH with age. By halting GCLC truncation, we can rejuvenate lens GSH levels and considerably postpone cataract onset.


Figures

Fig. 1.
Fig. 1.. Age-related increase of GCLC truncation in mouse and human lenses.
Immunoblotting using specific antibodies was used to determine G73 and G60. The C-terminal fragment (G13) was also measured using an antibody recognizing the entire mouse G13 fragment. (A) Mouse lenses aged 1 month to 24 months were analyzed. These data represent three individual mouse lenses from each age group, and measurements were taken from a minimum of six mice in each group. (B) Human lenses with ages ranging from 6 to 76 years were also studied. (C) The relationship between the ratio of G60/G73 and age in human lenses was examined. Regression analysis with 95% confidence intervals (CI) yielded the following prediction: y = 0.0039x + 0.0138, r = 0.8229, P < 0.0001, n = 22. (D) The correlation between the ratio of G60/G73 and age range groups in human lenses was investigated. The regression line was found to be y = 0.0861x + 0.0286, r = 0.9976. (E) The occurrence of GCLC truncation in other aged mouse tissues. Blood was effectively removed through cardiac perfusion in all vascular tissues. (F) GCLC truncation in cultured cell lines. Note: The kidney tissue used as an additional positive control in (F) was not obtained through cardiac perfusion. Consequently, it reflects a mixture of G60 levels from both kidney and red blood cells. (G) The spatial distribution of G73 truncation in mouse lenses showed no detectable G60 in the lens epithelium, while notable G60 was observed in the lens fibers. (H) The spatial distribution of G73 truncation in human lenses indicated no detectable G60 in the human lens epithelium, while major G60 was present in the outer layer of the lens cortex, with no G60 detected in the lens nucleus. GAPDH, glyceraldehyde phosphate dehydrogenase.
Fig. 2.
Fig. 2.. Aspartate 499 GCLC cleavage in cortical fibers correlates with age-related decline of GCL activity.
(A) An age-related decline in GCL activity was observed in human lenses. Regression analysis with 95% CI yielded the following prediction: y = −0.08151x + 11.54, r = 0.7787, P < 0.0001, n = 21. (B) An age-related decline in GCL activity was observed in mouse lenses. (C) An age-related decline in lens GSH was observed in mouse lenses. (D) The correlation between lens GSH level and GCL activity was investigated. The regression line was found to be y = 5.606x + 9.325, r = 0.9741. (E) Significantly decreased GCL activity was found in the lens outer cortex but not epithelium when comparing 20-month-old mouse lenses to 2-month-old mouse lenses. (F and G) G73 and G60 were immunoprecipitated under denaturing conditions using a GCLC antibody recognizing the N-terminal region of protein GCLC. Mass spectrometry analysis revealed the detection of the theoretic tryptic peptide of the full-length GCLC, DICKGGNAVVDGCSK (F), and the cleavage peptide DICKGGNAVVD (G). (H) Tag-free GCLC was expressed in Gclc KO MEF cells using retroviral particle infection. Following induction of MEF cell death with 500 nM STS for 6 hours, G73 and G60 were determined by immunoblot (IB). Consistent with the findings, D499A and D499E mutations prevented G73 cleavage. CT, control cells without viral infection. (E) Results were expressed as mean ± SD and were analyzed using Student’s t test. (B and C) Results were expressed as mean ± SD and were analyzed using one-way analysis of variance (ANOVA) with Tukey’s multiple comparisons test. Only P < 0.05 is considered significant. *P < 0.05, **P < 0.01, ***P < 0.001, and ****P < 0.0001. ns, not significant; m/z, mass/charge ratio.
Fig. 3.
Fig. 3.. GCLC cleavage fragment G60 abolishes GCLM binding and enzymatic activity.
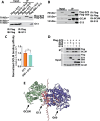
(A) AlphaFold-multimer 2 predicted the protein complex, and the C-terminal motif was found to be crucial for GCL holoenzyme formation by GCLC and GCLM. (B) Co-IP in HeLa cell culture revealed that overexpressing flag-tag G73 could pull down GCLM, while no detectable GCLM was found in G60 overexpressed cells. (C) In HeLa cell culture, substantial levels of GCLM were pulled down when both flag-tag G73 and Myc-tag GCLM were overexpressed. Conversely, only a weak GCLM band was detected in both flag-tag G60 and Myc-tag GCLM overexpressed HeLa cells. (D) G60 activity was assessed by expressing G73 and G60 in Gclc KO MEF cells. The cell lysate, collected 48 hours after viral particle infection, was used for GCL activity analysis. WT MEF cells were used as a control. (E) The results of GCL activity from (D) demonstrate that G60 nearly completely abolishes its enzymatic activity. One-way ANOVA with Tukey’s honest post hoc analysis was used to compare between groups, and only P < 0.05 is considered significant. (****P < 0.0001).
Fig. 4.
Fig. 4.. G60 and G13 coordinately bind GCLM, competing with G73.
(A) G60, but not G73, interacts with G13. Either the flag vector alone, flag-tag G73, or flag-tag G60 was expressed in HeLa cells with or without coexpression of G13. Only flag-tag G60 was able to pull down G13 in G60 and G13 coexpressed cells, demonstrating that G60 could still bind the G13 fragment. (B) The IP study demonstrated that coexpressing G60 and G13 could pull down an equal amount of GCLM compared to cells expressing G73. Flag-tag G60 was coexpressed with G13 and then compared with cells expressing flag-G73. The flag antibody IP was able to pull down an equal amount of endogenous GCLM. (C) Quantitative results from three repeats (n = 3) of (B) experiment. (D) G73 and the combination of G60 and G13 equally competed with flag tagged G73 for GCLM binding. In GCLC KO HeLa cells, flag tagged G73 was cooverexpressed with tag free G73, G60, G13, and G60 plus G13. GCLM was determined from IP product by flag tag antibody. (E) AlphaFold successfully predicted that G13 could act as a patch between GCLM and G60. All experiments in this figure used a transient ectopic expression system. One-way ANOVA with Tukey’s honest post hoc analysis was used to compare between groups, and only P < 0.05 is considered significant. (ns, not significant).
Fig. 5.
Fig. 5.. G60, G13, and GCLM complex significantly impair GCL enzymatic activity.
(A and B) GCL activity was significantly decreased in GCL holoenzyme assembled by G60, G13, and GCLM compared to G73 and GCLM. GCLC KO HeLa cells were used in the GCL activity assay. Approximately equal amounts of G73 and G60 (coexpressed with G13) were achieved (B), and the GCL activity was significantly lower in G60/G13-expressed cells than in G73-expressed cells (A). (C and D) Significantly lower levels of GSH were produced in G60/G13 coexpressed cells than in G73-expressed cells. In GCLC KO HeLa cells, a gradual increase in the expression of either G73 or G60/G13 was conducted (D). G60/G13 coexpressed cells generated a remarkably smaller amount of GSH than G73-expressed cells (C). Linear regression for G73: y = 0.8060x + 0.2536, r = 0.9957; for G60/G13: y = 0.3661x + 0.2364, r = 0.9648. The P value between G73 and G60/G13 = 0.0081. (E and F) G60 can stabilize G13. In GCLC KO HeLa cells, either G13 or G13 plus G60 overexpression was conducted by transient transfection. Cells were then split into four equal dishes and cultured from 36 to 72 hours. The G13 levels at each time point were determined by immunoblotting assay. G60 coexpression significantly prevented G13 degradation. All experiments in this figure used a transient ectopic expression system. One-way ANOVA with Tukey’s honest post hoc analysis was used to compare between groups, and only P < 0.05 is considered significant. (**P < 0.01 and ***P < 0.001).
Fig. 6.
Fig. 6.. D499E-KI mice alleviates GCLC cleavage and maintains lens GSH levels in aged mice.
(A) On the basis of in vitro apoptotic cell culture model, D499E largely blocks G73 cleavage, while D499A almost completely blocks G73 cleavage. In vitro HeLa cell apoptosis induction conditions: Cell death was induced by TNFα (30 ng/ml) and CHX (10 μg/ml) for 6 hours. G73 and G60 were determined by immunoblotting assay. Short (low exp) and long (high exp) time exposure was used to detect G60 formation. A weak G60 band was still detectable in D499E mutant G73-expressed cells. NT indicates no transfected cells. (B) D499E maintained a similar activity to G73, while D499A still maintained a high enzymatic activity but significantly less than G73. (C) Both D499A and D499E mutations maintain complex formation between GCLM and GCLC. Flag-tagged G73 with and without mutations were overexpressed in GCLC KO HeLa cells, and GCLM was measured in the IP products from flag-tag antibody pull-down. (D and E) GCLC truncation was significantly suppressed in both 14- and 20-month-old D499E-KI mouse lenses compared to WT. (F) GSH level was largely preserved in aged mice compared to age-matched WT lenses at 14 months old. Unpaired t test was used in (F) data analysis, one-way ANOVA with Tukey’s honest post hoc analysis was used to compare between groups in (B), and only P < 0.05 is considered significant. (*P < 0.05, **P < 0.01, ***P < 0.001, and ****P < 0.0001). TNFα plus CHX, T + C.
Fig. 7.
Fig. 7.. D499E-KI mice significantly delay cataract formation.
Twenty-month-old WT and D499E-KI mice were screened for lens opacity. Mice with corneal opacity were excluded from the study. A total of 94 WT mice (186 eyes) and 100 D499E-KI mice (188 eyes) were screened using a slit lamp. The lens opacity was categorized into three grades: grade I (no cataract), grade II (mild cataract), and grade III (severe cataract). (A to C) The full eye image exhibits varying degrees of opacity. Slit lamp settings: length, 14 mm; width, 20 mm; brightness, maximum. (D to F) Slit lamp slit images illustrate the extent of cataract severity. Slit lamp settings: length, 10 mm; width, 0.2 mm; brightness, maximum. (G to I) Lens dark-field images show opacity in the center of the anterior side. (J to L) Lens grid images depict both the opacity and the severity of cataracts, with the anterior side facing the grid. (M) At 20 months of age, roughly half of the D499E-KI mice remained cataract-free, contrasting with only about 20% of WT mice. Severe cataracts were observed in approximately 10% of D499E-KI mice at this age, in contrast to approximately 20% of WT mice. A chi-square test was used to compare the WT and D499E-KI groups. (N) Distribution of cataract density. A Mann-Whitney test was used to compare the WT and D499E-KI groups. (O) Distribution of cataract area. A Mann-Whitney test was used to compare the WT and D499E-KI groups. Only P < 0.05 is considered significant. (****P < 0.0001).
Fig. 8.
Fig. 8.. Model of the role of GCLC truncation in lens GSH homeostasis during aging.
In the lens at a young age, minimal GCLC cleavage occurs, leading to normal GSH biosynthesis and maintenance of GSH concentration. However, at older ages, GCLC truncation fragments compete with full-length GCLC for GCLM complex formation, resulting in impaired intracellular GSH synthesis and reduced lens GSH concentration. This age-related GCLC truncation may contribute to the decline in lens function and the development of age-related lens disorders.

References

    1. Cicinelli M. V., Buchan J. C., Nicholson M., Varadaraj V., Khanna R. C., Cataracts. Lancet 401, 377–389 (2023). - PubMed
    1. GBD 2019 Blindness and Vision Impairment Collaborators; Vision Loss Expert Group of the Global Burden of Disease Study , Causes of blindness and vision impairment in 2020 and trends over 30 years, and prevalence of avoidable blindness in relation to VISION 2020: The Right to Sight: An analysis for the Global Burden of Disease Study. Lancet Glob. Health 9, e144–e160 (2021). - PMC - PubMed
    1. Liu Y. C., Wilkins M., Kim T., Malyugin B., Mehta J. S., Cataracts. Lancet 390, 600–612 (2017). - PubMed
    1. Wormstone I. M., Wormstone Y. M., Smith A. J. O., Eldred J. A., Posterior capsule opacification: What’s in the bag? Prog. Retin. Eye Res. 82, 100905 (2021). - PubMed
    1. Wei Z., Gordon P., Hao C., Huangfu J., Fan E., Zhang X., Yan H., Fan X., Aged lens epithelial cells suppress proliferation and epithelial-mesenchymal transition-relevance for posterior capsule opacification. Cells 11, (2022). - PMC - PubMed

Publication types