. 2024 Apr 19;384(6693):295-301.
doi: 10.1126/science.adh5483. Epub 2024 Apr 18.

Neuroendocrine cells initiate protective upper airway reflexes

Affiliations

Neuroendocrine cells initiate protective upper airway reflexes

Laura F Seeholzer et al. Science. .

Abstract

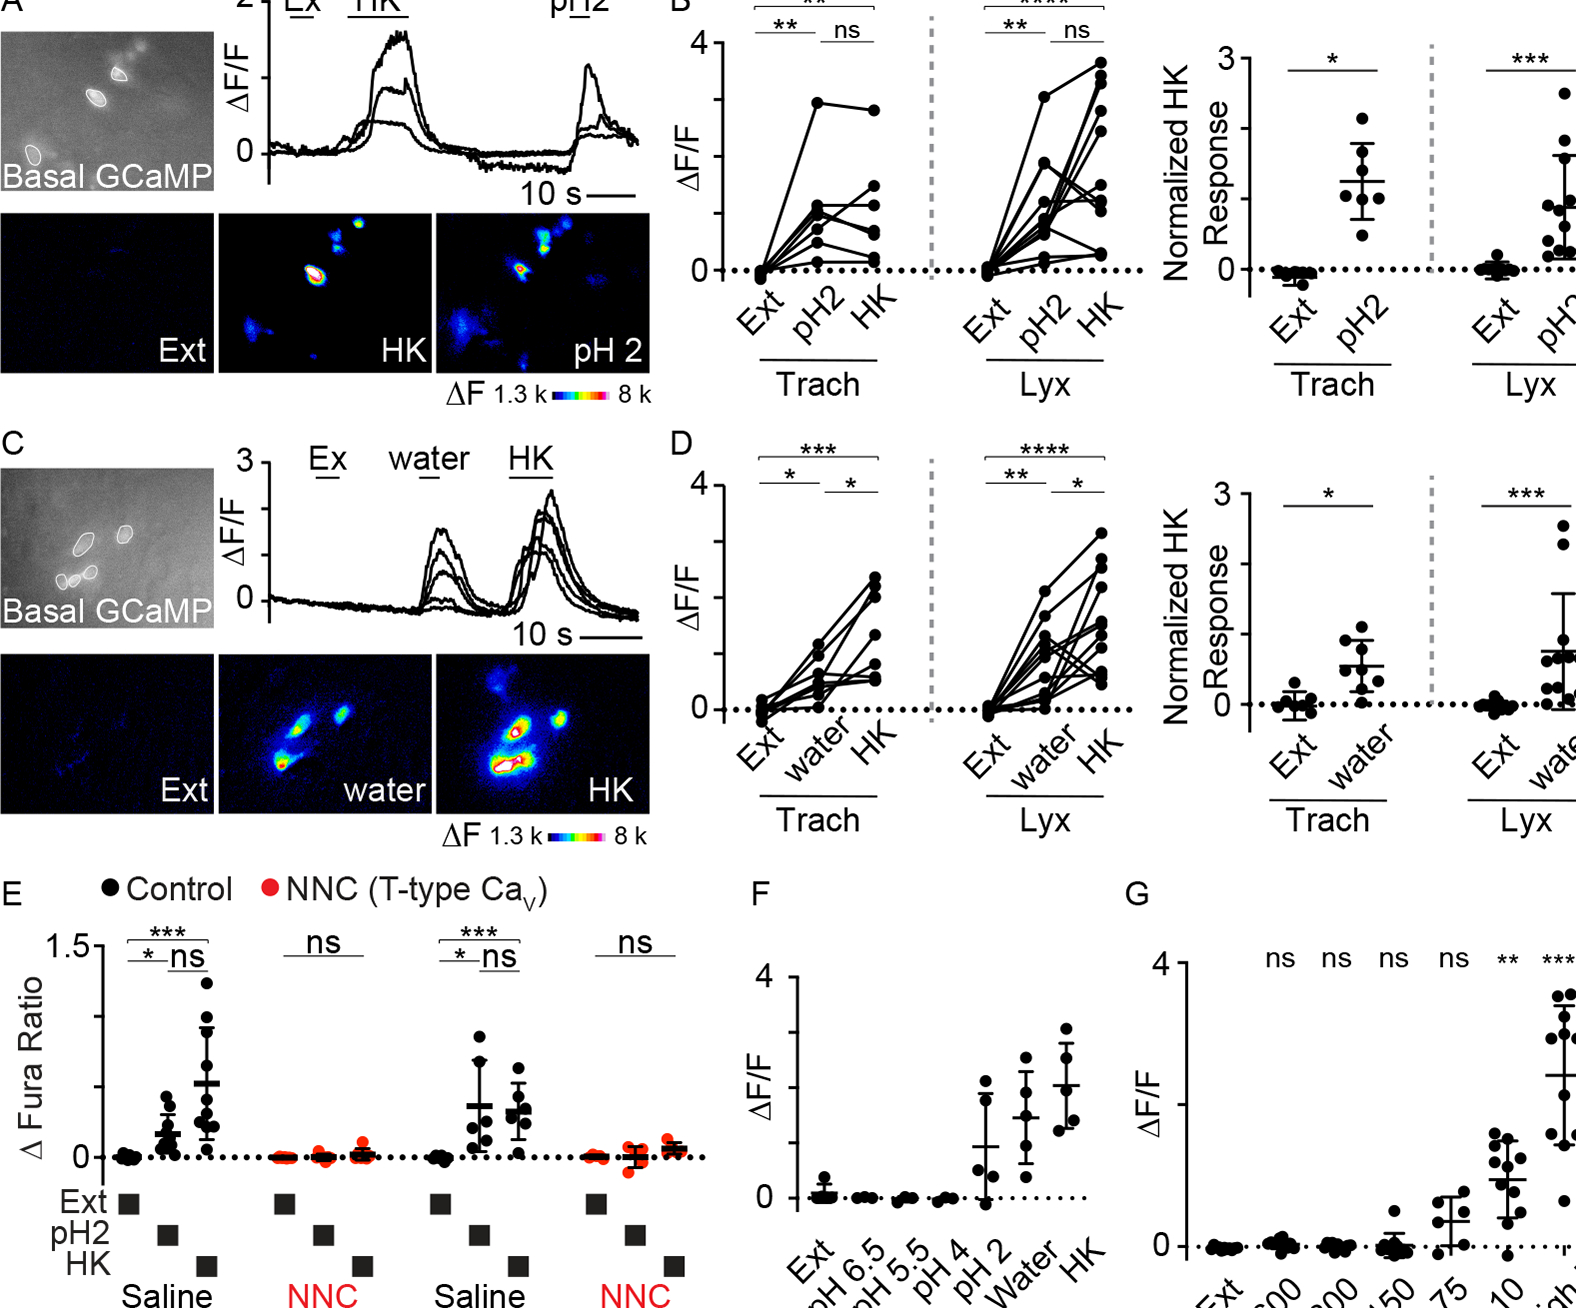
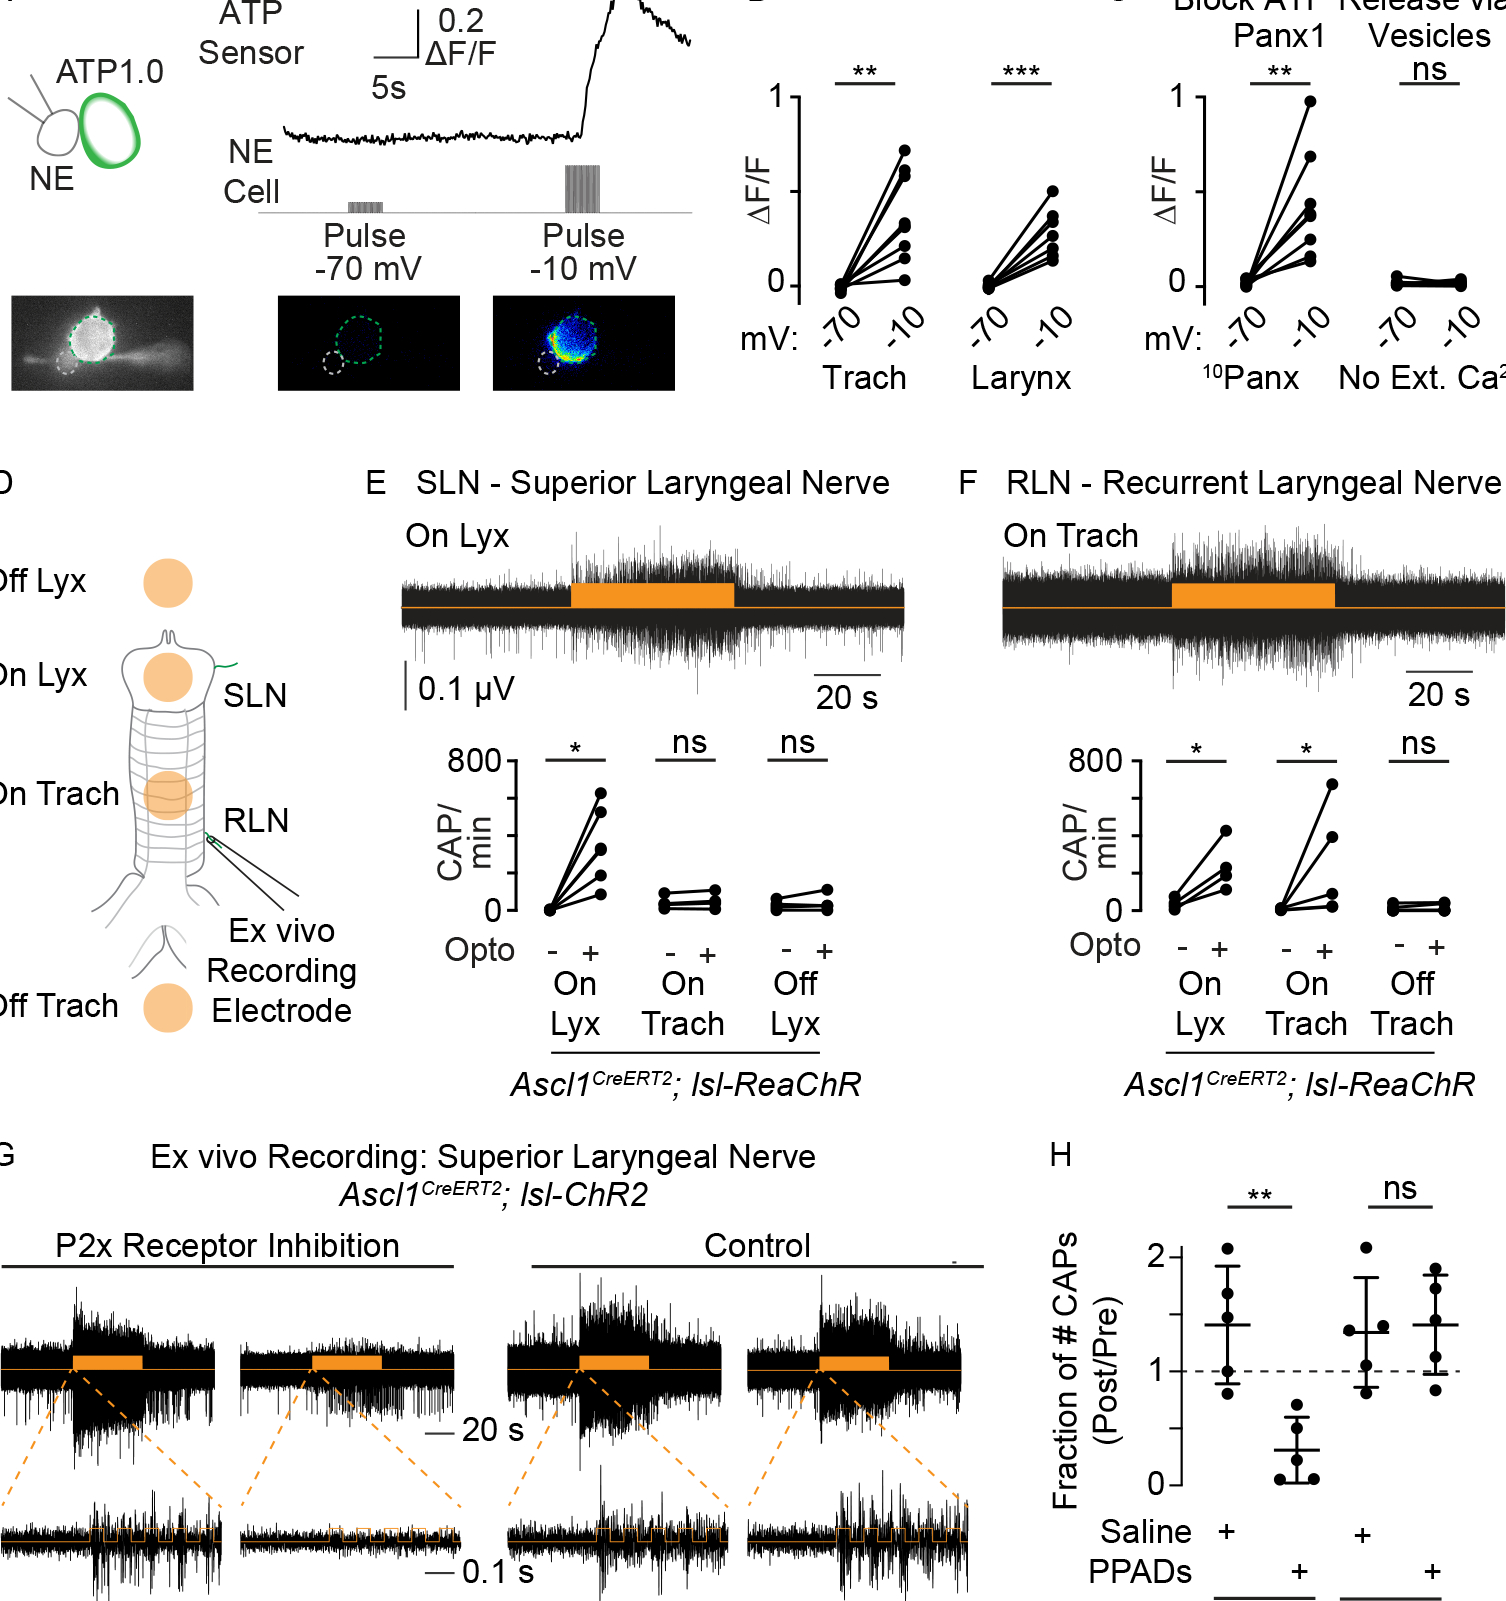
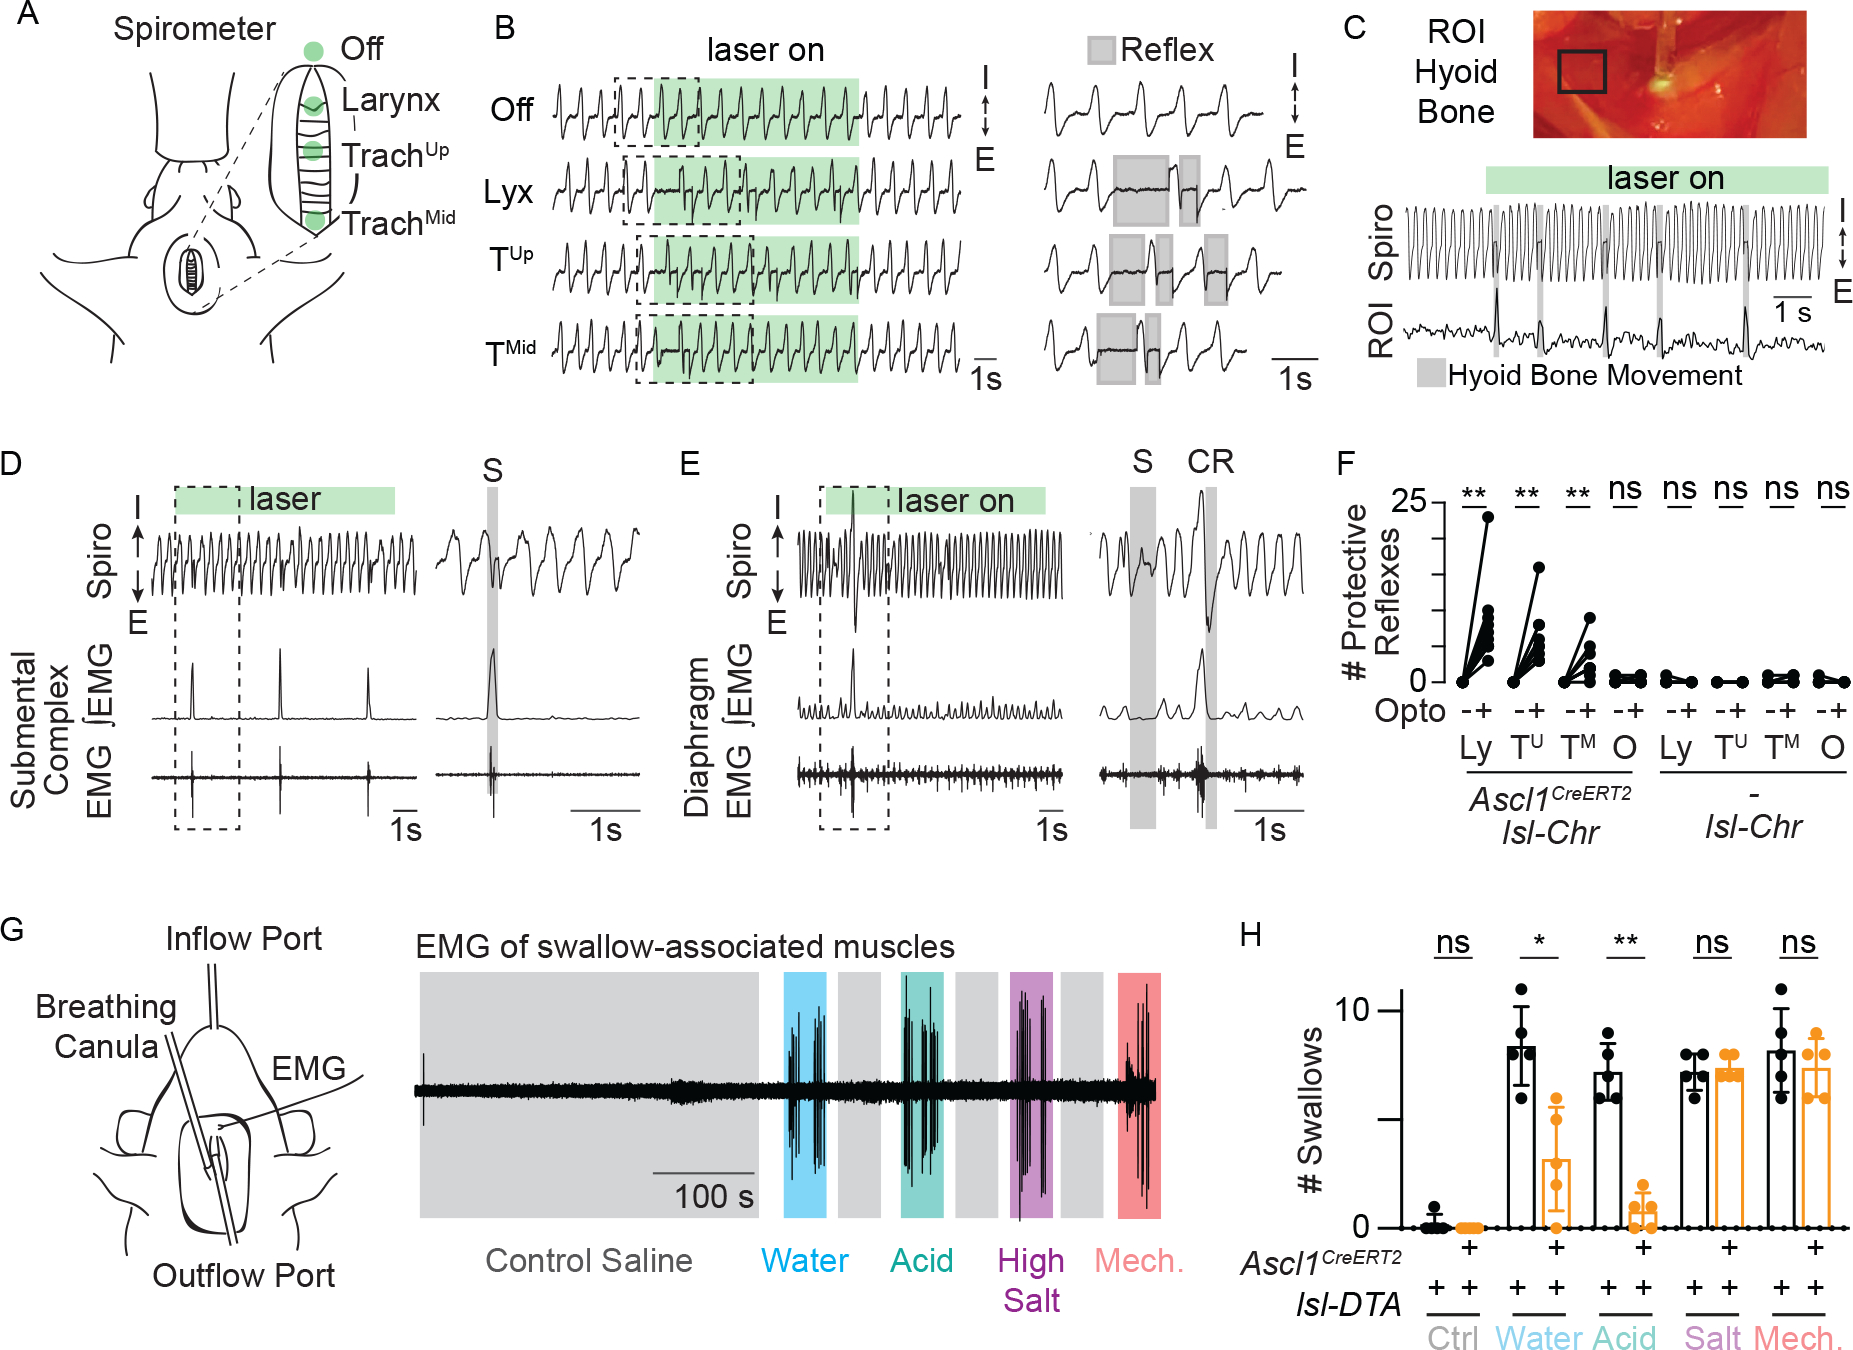
Airway neuroendocrine (NE) cells have been proposed to serve as specialized sensory epithelial cells that modulate respiratory behavior by communicating with nearby nerve endings. However, their functional properties and physiological roles in the healthy lung, trachea, and larynx remain largely unknown. In this work, we show that murine NE cells in these compartments have distinct biophysical properties but share sensitivity to two commonly aspirated noxious stimuli, water and acid. Moreover, we found that tracheal and laryngeal NE cells protect the airways by releasing adenosine 5'-triphosphate (ATP) to activate purinoreceptive sensory neurons that initiate swallowing and expiratory reflexes. Our work uncovers the broad molecular and biophysical diversity of NE cells across the airways and reveals mechanisms by which these specialized excitable cells serve as sentinels for activating protective responses.


Conflict of interest statement

Competing interests: Authors declare that they have no competing interests.

Figures

Fig. 1.
Fig. 1.. Morphological and biophysical diversity of neuroendocrine cells across the airway.
(A) Diagram of the airway (left). Co-localization of Ascl1CreERT2; R26lsl-TdTomato (pink), a neuroendocrine marker Pgp9.5 (green) and DAPI nuclear stain (blue) in lung (left, middle), trachea (right, middle) and larynx (right). Representative images from n = 5 mice. (B) Cartoon of NE cell morphology (pink) in mouse and human airway epithelium. (C) Whole mount (top) and slice (bottom) histology of NE cells (pink) with neurons marked by β-Tubulin (green, bottom) and DAPI (blue). Representative images from n = 5 mice. (D) Density of NE cells in extra pulmonary bronchi (EP Bronch), trachea (Trach) and larynx, n = 5 mice. (E) Spontaneous action potentials recorded at resting membrane potential in dissociated cells, n = 9–13 cells. (F, G) Biophysical characteristics of dissociated pulmonary (P, n = 68 cells), tracheal (T, n = 99 cells) and laryngeal (L, n = 9 cells) NE cells. All data were analyzed with Kruskal-Wallis (P<0.0001) and Dunn’s multiple comparisons test. (F) Number of action potentials elicited by depolarizing current injection (left) for pulmonary (P, blue) or tracheal/laryngeal (T/L, orange) NE cells together with representative traces (middle and right). (G) Peak inward voltage-gated currents (NaV, left) and steady-state outward currents at 30 mV (KV, right). (H, I) Slice electrophysiology recordings. Representative images (H) and current-voltage trace (I, left). Peak inward voltage-gated currents (I, right) for pulmonary (P) and tracheal (T) NE cells, n = 5 cells. Unpaired t test, P = 0.0035. (J) Representative tracheal NE patch-clamp-imaging trace. Current (middle) was injected into NE cell while recording membrane potential (top) and change in GCaMP fluorescence (bottom). Image scale bars 10 μm. * P < 0.05, ** P < 0.01, *** P < 0.001 and **** P < 0.0001. Data represented as mean +/− SD. See Table S1 for extended detail on statistics and P-values.
Fig. 2.
Fig. 2.. Airway NE cells are differentially mechanosensitive.
(A) Representative patch-clamp recordings of mechanically-evoked currents (middle) and action potentials (bottom) aligned to displacement of mechanical probe (top) showing number and type of mechanosensitive cells, including pulmonary or extra pulmonary (EP) bronchial NE cells with slowly and/or rapidly inactivating currents, and mechanically insensitive tracheal NE cells. (B) Representative image showing GCaMP response by a pulmonary NE cell cluster to mechanical stimulation (top). Quantification of calcium response to mechanical stimulation (mech) or high potassium (HK) in explant preparations (bottom). n = 6–7 cells. Unpaired t-test with Welch’s correction (mechanical, P = 0.0009 and HK, P = 0.5444). (C, D) Representative images (C) and quantification (D) of co-localization of Piezo2Cre; R26lsl-TdTomato (green), the NE cell marker Pgp9.5 (pink) and DAPI nuclear stain (blue) across the airways. n = 5–7 mice. (E) Representative traces (left) and quantification (right) of mechanical activation of pulmonary NE cells from WT mice or mice with conditional deletion of Piezo2 (cKO). n = 9 cells, Mann-Whitney test, P < 0.0001. Image scale bars 10 μm. * P < 0.05, ** P < 0.01, *** P < 0.001 and **** P < 0.0001. Data represented as mean +/− SD. See Table S1 for extended detail on statistics and P-values.
Fig. 3.
Fig. 3.. Airway NE cells respond to acid and water.
(A-D) Calcium imaging of NE cells in tracheal (trach) and laryngeal (lyx) tissue in response to low pH (A, B) or water (C, D) versus high potassium (HK). White circles in images mark cells analyzed for representative traces. Rainbow scale indicates change in fluorescence. Quantification of responses (B, D, left). Repeated measures one-way ANOVA (B, Trach P < 0.0038, B, Lyx P <0.0001, D, Trach P = 0.0002 and D, Lyx P < 0.0001) and Tukey’s multiple comparisons test for each tissue/stimulus pair. Calcium responses normalized to HK response (B, D, right). Wilcoxon signed rank test for trach pH 2, lyx pH 2, trach water and lyx water, respectively: n = 7, 12, 8 and 12 cells and P = 0.0156, 0.0005, 0.0156, and 0.0005. (E) Quantification of calcium responses in dissociated cells in the absence (black) or presence (red) of the T-type calcium channel blocker NNC 55–0396 adjusted for baseline Fura-2 ratio (delta Fura Ratio). Responses are to external saline (ext), pH2 or HK. Friedman test for Trach/Lyx Saline, NNC, Pulmonary Saline, NNC, respectively: (P < 0.0001, P = 0.96, P =0.0081 and P = 0.093, respectively) and Dunn’s multiple comparisons test. (F, G) Calcium responses to a range of acidities (F) or osmolarities (G). Kruskal-Wallis test (P < 0.0001) with Dunn’s multiple comparisons test to external saline. * P < 0.05, ** P < 0.01, *** P < 0.001 and **** P < 0.0001. Data represented as mean +/− SD. See Table S1 for extended detail on statistics and P-values.
Fig. 4.
Fig. 4.. Upper airway NE cells release ATP and activate purinoceptive neurons.
(A) Schematic of NE cell adjacent to an ATP biosensor cell (ATP1.0-expressing HEK293T cell). Representative trace (top) and images (bottom) of biosensor cell responses when NE cell is pulsed to −70 mV or −10 mV. (B, C) Quantification of changes in biosensor fluorescence in (B) tracheal or laryngeal NE cells or (C) tracheal NE cells incubated with 10Panx or calcium-free external saline. B: n = 7–9 cells, paired t-test, P = 0.0015 and 0.0009, respectively. C: n = 7–8 cells, paired t-test, P = 0.0061 and 0.805, respectively. (D) Schematic of ex vivo whole nerve electrophysiology preparation for recording superior laryngeal nerve (SLN) or recurrent laryngeal nerve (RLN) activity in response to optogenetic activation (orange dots). (E, F) Representative trace of spiking activity (black) in SLN (E) or RLN (F) in response to optogenetic activation (orange bar) (top). Number of compound action potentials (CAP) in the minute before (−) or during (+) optogenetic stimulation of larynx, trachea, or area adjacent to the preparation (off) in Ascl1CreERT2; R26lsl-ReaChR animals (bottom). E: Wilcoxon signed rank test, n = 4–6 preparations (P = 0.0312, 0.25, 0.875, respectively). F: n = 4–7 preparations, paired t test (P = 0.0355, 0.0233, 0.7663, respectively). (G) Effect of P2x receptor antagonist (PPADS, representative trace, left) or vehicle (representative trace, right) on light-evoked activity in SLN. (H) Quantification of suppression of SLN activity (# post CAPS/# pre CAPS) for optogenetic or high salt activation with PPADS or vehicle control, n = 5 preparations. Unpaired t-test, P = 0.0032 and = 08232, respectively. * P < 0.05, ** P < 0.01, and *** P < 0.001. Data represented as mean +/− SD. See Table S1 for extended detail on statistics and P-values.
Fig. 5.
Fig. 5.. Upper airway NE cells drive protective behavioral responses.
(A) Schematic of whole animal preparation with green dots representing approximate location of optogenetic stimulation. (B) Airway protective reflexes following optogenetic stimulation of NE cells. Representative spirometry traces during optogenetic stimulation (green, laser on) of NE cells (Ascl1CreERT2; R26lsl-ChR2) in the larynx (lyx), upper trachea (TUp), mid-trachea (TMid) and outside of airway. I = inspiration, E = expiration. (C) Representative image of hyoid bone ROI (top). Spirometry traces illustrating alignment of apneas with deflections in the hyoid bone. (D, E) Spirometry traces (top) aligned to electromyography (EMG) recordings of submental complex during representative swallow (D) or diaphragm during representative cough-like reflex and swallow (E). Integrated (middle) and raw (bottom) EMG traces depicted. (F) Quantification of # of protective reflexes (swallowing or cough-like reflex) before (−) and during (+) 3× 10 s stimulation bouts. Larynx (Ly), upper trachea (TU), mid-trachea (TM) and off airway (O) for Ascl1CreERT2; R26lsl-ChR and R26lsl-ChR animals (n = 5–7 animals). Wilcoxon signed rank test (P = 0.0156, 0.0156, 0.0156, >0.99, >0.99, >0.99, 0.5, >0.99, * P < 0.05. (G) Schematic (left) and representative EMG trace (right) of airway perfusion assay. (H) Quantification of stimulus-evoked swallows with and without NE cell ablation. Mann Whitney Test comparing responses in Cre+ vs Cre− for each stimulus (n = 5, P > 0.999, = 0.0159, = 0.0079, > 0.9999, = 0.6429). EMG, movement analysis and spirometry traces are arbitrary units. Data represented as mean +/− SD. See Table S1 for extended detail on statistics and P-values.

Comment in

  • Sentinels of the airways.
    Zhu Z, Sun X. Zhu Z, et al. Science. 2024 Apr 19;384(6693):269-270. doi: 10.1126/science.ado9995. Epub 2024 Apr 18. Science. 2024. PMID: 38669581

Similar articles

Cited by

References

    1. Pitts T, Rose MJ, Mortensen AN, Poliacek I, Sapienza CM, Lindsey BG, Morris KF, Davenport PW, Bolser DC, Coordination of cough and swallow: A meta-behavioral response to aspiration. Respir. Physiol. Neurobiol. 189, 543–551 (2013). - PMC - PubMed
    1. Hammond CAS, Goldstein LB, Horner RD, Ying J, Gray L, Gonzalez-Rothi L, Bolser DC, Predicting aspiration in patients with ischemic stroke. Chest. 135, 769–777 (2009). - PMC - PubMed
    1. Daniels SK, Brailey K, Priestly DH, Herrington LR, Weisberg LA, Foundas AL, Aspiration in patients with acute stroke. Arch Phys Med Rehabil. 79, 14–19 (1998). - PubMed
    1. Doggett DL, Tappe KA, Mitchell MD, Chapell R, Coates V, Turkelson CM, Prevention of pneumonia in elderly stroke patients by systematic diagnosis and treatment of dysphagia: An evidence-based comprehensive analysis of the literature. Dysphagia. 16, 279–295 (2001). - PubMed
    1. Lee LY, Yu J, Sensory nerves in lung and airways. Compr. Physiol. 4, 287–324 (2014). - PubMed

Publication types