. 2024 Apr 25;187(9):2129-2142.e17.
doi: 10.1016/j.cell.2024.03.017.

Generation of rat forebrain tissues in mice

Affiliations

Generation of rat forebrain tissues in mice

Jia Huang et al. Cell. .

Abstract

Interspecies blastocyst complementation (IBC) provides a unique platform to study development and holds the potential to overcome worldwide organ shortages. Despite recent successes, brain tissue has not been achieved through IBC. Here, we developed an optimized IBC strategy based on C-CRISPR, which facilitated rapid screening of candidate genes and identified that Hesx1 deficiency supported the generation of rat forebrain tissue in mice via IBC. Xenogeneic rat forebrain tissues in adult mice were structurally and functionally intact. Cross-species comparative analyses revealed that rat forebrain tissues developed at the same pace as the mouse host but maintained rat-like transcriptome profiles. The chimeric rate of rat cells gradually decreased as development progressed, suggesting xenogeneic barriers during mid-to-late pre-natal development. Interspecies forebrain complementation opens the door for studying evolutionarily conserved and divergent mechanisms underlying brain development and cognitive function. The C-CRISPR-based IBC strategy holds great potential to broaden the study and application of interspecies organogenesis.

Keywords: C-CRISPR; interspecies blastocyst complementation; interspecies chimeras; interspecies forebrain blastocyst complementation; interspecies neural blastocyst complementation; interspecies organogenesis; rat-mouse chimeras.


Conflict of interest statement

Declaration of interests The authors declare no competing interests.

Figures

Figure 1.
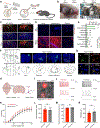
Figure 1.. CCBC facilitates quick genetic screening for neural blastocyst complementation
(A) Schematic showing one-step generation specific organ in mice using CCBC and candidate genes for forebrain compensation which involved in regulating Wnt signaling during brain organogenesis. (B) The efficiency of C-CRISPR-mediated gene knockout in 4-cell mouse embryos. Gene knockout is determined by both PCR and Sanger sequencing. >40bp deletion or frame shift is considered a putative gene knockout. (C) The percentage of forebrain agenesis after gene knockout in E12.5 mouse embryos. ND, no data. (D) Representative images showing forebrain agenesis at embryonic day (E) 12.5 in gene knockout mouse embryos. Embryos with forebrain agenesis are marked in yellow *. F, forebrain; M, midbrain; H, hindbrain. Experiments were repeated 3 times independently for each group. (E) Representative images showing forebrain reconstitution in E12.5 CCBC mouse embryos. Embryos with reconstituted forebrain are marked in yellow*. F, forebrain; M, midbrain; H, hindbrain. (F) The efficiency of forebrain reconstitution in E12.5 CCBC chimeras. (G) Images showing newborn Dkk1−/− mice (P0) with or without forebrain reconstitution. Note that the complete allogenic forebrain was only formed in Dkk1−/−+mESCs chimeras but not in Dkk1−/− mice. (H) Images showing newborn Hesx1−/− mice (P0) with or without brain reconstitution. Note that the forebrain was only formed in Hesx1−/−+mESCs chimera but not in Hesx1−/− mice. (I) Quantification of forebrain reconstitution efficiency of Dkk1−/−+mESCs and Hesx1−/−+mESCs chimeras at P0.
Figure 2.
Figure 2.. Intraspecies blastocyst complementation of forebrains in Hesx1−/− mice
(A) Schematic for the generation of dual-color-labelled chimeric mice. Red, tdTomato+ donor mESCs; Green, EGFP+ Hesx1−/− host blastocyst. (B) Representative images of Hesx1−/−+mESCs chimeras at P0. (C) Representative sagittal brain sections from WT+mESCs (lower, n = 3) and Hesx1−/−+mESCs (upper, n = 4) chimeras. Yellow dashed line, cortex (C); white dashed line, hippocampus (H); orange dashed line, midbrain (M). Scale bars, 1mm. (D) Representative images showing the contribution of tdTomato+ donor mESCs to the CA1, CA3, cortex and midbrain regions in WT+mESCs (upper, n = 3) and Hesx1−/−+mESCs (lower, n = 4) P0 chimeras. Green, host-derived cells; Red, donor-derived cells; Blue, DAPI-stained nuclei. Scale bars, 100 μm. (E) Percentages of tdTomato+ donor mouse cells in the CA1, CA3, cortex and midbrain regions in WT+mESCs and Hesx1−/−+mESCs chimeras (n = 3 per group). All values are presented as the mean ± s.e.m.. ***p < 0.001, unpaired t-tests. ns, not significant. (F) Hesx1−/−+mESCs and WT+mESCs chimeras at the age of 20 months. (G) Bright-field and fluorescence images showing no obvious difference between the brains of Hesx1−/−+mESCs and WT+mESCs chimeras at 10 weeks of age. (H) Brain weight of Hesx1−/−+mESCs and WT+mESCs at 10 weeks of age (n = 10 mice per group).
Figure 3.
Figure 3.. Generation of rat forebrain tissues in mice via interspecies blastocyst complementation
(A) Schematic for the generation of rESC-derived forebrain tissues in mice via CCBC. (B) Representative images of WT+rESCs and Hesx1−/−+rESCs chimeras at the age of P3 and 20 months. (C) Sagittal brain sections from WT+rESCs (left) and Hesx1−/−+rESCs (right) chimeras at 10 weeks. Yellow dashed line, cortex (C); White dashed line, hippocampus (H); Green dashed line, midbrain (M). Scale bar, 1mm. (D) Representative images showing the contribution of tdTomato+ rat cells to different brain regions in WT+rESCs and Hesx1−/−+rESCs chimeras (n = 3 per group). Scale bar, 100 μm. (E) Percentages of tdTomato+ rat cells in the indicated brain regions in WT+rESCs and Hesx1−/−+rESCs chimeras (n = 12 slices per group). Unpaired t-tests. (F) The axonal projections of neurons from a forebrain region anterior lateral motor cortex (ALM). Note that strong signals were observed in the cortex, thalamus, superior colliculus (SC), and medulla, the known target regions of ALM neuron axons (n = 2 chimeras). Scale bar, 1 mm. (G) Images from a coronal slice showing that the axon fibers of ALM neurons in the midbrain were positive for both EGFP and tdTomato, suggesting that rESC-derived tdTomato+ neurons send axons to the midbrain. Yellow arrowheads indicate the colocalization of tdTomato and EGFP signals in the axonal fiber. White arrowheads indicate projected host-derived axonal fibers. Scale bar, 10 μm. (H) Schematic of patch-clamp recordings of cortical neurons of the P14-aged Hesx1−/−+ rESCs chimeras. (I) A representative image of tdToamto+ rat (*) and tdTomato mouse (#) cortical neurons in the brain slice. (J) and (K) Action potential firing activities of tdToamto+ and tdTomato cortical neurons induced by a series of step current injections (2 s duration). Representative traces (E) and the quantification of firing rate (F) are shown. ns, not significant; two-way ANOVA with Sidak’s multiple comparison test. All values are presented as the mean ± s.e.m.. **p < 0.01, ***p < 0.001, unpaired t-tests. ns, not significant. (L) The quantification of input resistance of tdToamto+ and tdTomato cortical neurons. ns, not significant between tdToamto+ (581±37 MΩ) and tdTomato- (556±43 MΩ) cortical neurons; two-tailed unpaired t-test. (M) The quantification of resting membrane potential of tdToamto+ and tdTomato cortical neurons. ns, not significant between tdToamto+ (−79.4±1.6 mV) and tdTomato- (−81.8±1.3 mV) cortical neurons; two-tailed unpaired t-test. The data are shown as Mean ± SEM. (N) Single action potential of tdToamto+ and tdTomato cortical neurons was induced by a series of short step current injections (10 ms duration) to determine the rheobase. The quantification of rheobase are shown. ns, not significant between tdToamto+ (208±16.7 pA) and tdTomato- (236±18.8 pA) cortical neurons; two-tailed unpaired t-test.
Figure 4.
Figure 4.. Reconstituted forebrains of intra- or interspecies chimeras are structurally and functionally normal
(A) Body weight curves of Hesx1−/−+rESCs, Hesx1−/−+mESCs and WT+mESCs chimeras. (n = 10 per group). (B) Representative images of sections from the somatosensory cortex and the hippocampus stained with Ctip2 and DAPI from WT+mESCs (left), Hesx1−/−+mESCs (middle) and Hesx1−/−+rESCs (right) chimeras at P7. Scale bar, 100 μm. (C) Widths of somatosensory cortex layers in WT+mESCs (blue, n = 3), Hesx1−/−+mESCs (red, n = 5), or Hesx1−/−+rESCs (black, n = 5) chimeras at P7. (D) Widths of the dentate gyrus (DG), CA3, and CA1 regions in WT+mESCs (blue, n = 3), Hesx1−/−+mESCs (red, n = 5), or Hesx1−/−+rESCs (black, n = 5) chimeras at P7. (E) Quantitative analysis of cell density of different brain regions of Hesx1−/−+mESCs and Hesx1−/−+rESCs chimeras at the age of 8 weeks (n = 3 per group). (F) Total distance travelled in the open-field assay for WT+rESCs (gray), Hesx1−/−+mESCs (green), and Hesx1−/−+rESCs (orange) chimeras. n = 16 chimeras for the WT+mESCs and Hesx1−/−+mESCs groups; n = 10 chimeras for the Hesx1−/−+rESCs group. (G) Left. Mean path length to the platform for WT+rESCs (gray), Hesx1−/−+mESCs (green), and Hesx1−/−+rESCs (orange) chimeras in the learning trials of Morris water maze task. Right. Mean time spent in the target quadrant in the target quadrant for WT+rESCs (gray), Hesx1−/−+mESCs (green), and Hesx1−/−+rESCs (orange) chimeras in test trials of Morris water maze task. n = 16 chimeras for the WT+mESCs and Hesx1−/−+mESCs groups; n = 8 chimeras for the Hesx1−/−+rESCs group. (H) Percentage of freezing of WT+rESCs, Hesx1−/−+mESCs, and Hesx1−/−+rESCs chimeras in the contextual fear conditioning test. n = 16 chimeras for the WT+mESCs and Hesx1−/−+mESCs groups; n = 10 chimeras for the Hesx1−/−+rESCs group. All values are presented as the mean ± s.e.m.. **p < 0.01, ***p < 0.001, unpaired t-tests. ns, not significant.
Figure 5.
Figure 5.. The dynamic donor rat cell contribution in Hesx1−/−+rESCs embryos and fetsues
(A) Representative fluorescent images of different tissue sections in Hesx1−/−+mESCs and Hesx1−/−+rESCs fetuses at E12.5 and E15.5. Scale bars, 100 μm. (B) and (C) Contribution of rESCs in the whole body (B) and the forebrain (C) of the Hesx1−/−+mESCs and Hesx1−/−+rESCs chimeras (n = 5 for each group). All values are presented as the mean ± s.e.m.. *p < 0.05, **p < 0.01, ***p < 0.001, unpaired t-tests. ns, not significant.
Figure 6.
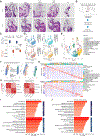
Figure 6.. Cell autonomous and non-cell autonomous effects in forebrain reconstituted rat-mouse chimeras
(A) Representative H&E staining images of WT (mouse), Hesx1−/− (mouse), Hesx1−/−+mESCs (chimera), Hesx1−/−+rESCs (chimera) and WT (rat) embryos at E9.5 and E11.5 (n = 3 for each group). prosencephalon (PRO), mesencephalon (MS), rhombencephalon (RHO), telencephalon (T), diencephalon (D), metencephalon (MT) and myelencephalon (MY). Scale bars, 300 μm. (B) Schematic overview of single-cell RNA-seq analysis of forebrains tissues from Hesx1−/−+rESCs chimeras (n = 3), WT rat (n = 1), and WT mouse (n = 1) at P0. (C) Boxplot showing UMI counts derived from the mouse genome and rat genome, among cells in WT mouse, WT rat and putative mouse or rat cells in the chimera. (D) Uniform manifold approximation and projection (UMAP) visualization of single cells that were analyzed based on both their gene expression and species origin. Homologous genes between mice and rats were used for the analysis. Single cell data from WT mouse, WT Rat and Chimeras were used to perform integrative analysis for identifying rat cells and mouse cells in the WT mouse, WT Rat and Hesx1−/−+rESCs chimeras, respectively. (E) Visualization of UMAP showing integrated analysis cells in WT mouse, WT Rat and Hesx1−/−+rESCs chimeras. Cells are as color-coded by cell type. EXs, excitatory neuron; INs, inhibitory neurons; OPCs, oligodendrocyte progenitor cells; NSCs, neural stem cells. (F) Principal component 1 (PC1) vs. PC2 of the principal component analysis (PCA) of EXs(NEUROD6,RND2,SEMA3C) and INs(DLX1,HTR3A) cells in WT mouse, WT rat and Hesx1−/−+rESCs chimeras. Cells from WT mouse, WT rat, and chimeras are as color-coded. The putative species origins are as shape coded. (G) Heatmaps showing Pearson correlations between cells of the indicated sources. Pearson correlation was calculated based on the normalized gene expression levels. (H) The heatmap shows the differentially expressed genes (DEGs) between Chimera_mouse cells and WT mouse cells, Chimera_Rat cells and WT rat cells in different cell types. EXs, excitatory neuron; INs, inhibitory neurons; OPCs, oligodendrocyte progenitor cells; NSCs, neural stem cells. The expression levels of the top 30 highly expressed genes in each cell type were presented. (I) and (J) Gene Ontology (GO) enrichment analysis of DEGs in Chimera_mouse cells and WT mouse cells, Chimera_Rat cells and WT rat cells among all the excitatory neurons (EXs Total) and inhibitory neurons (INs Total). The top 10 significantly enriched pathways of DEGs were showed.

References

    1. Wu J, Greely HT, Jaenisch R, Nakauchi H, Rossant J, and Belmonte JCI (2016). Stem cells and interspecies chimaeras. Nature 540, 51–59. 10.1038/nature20573. - DOI - PubMed
    1. Wu J, Platero-Luengo A, Sakurai M, Sugawara A, Gil MA, Yamauchi T, Suzuki K, Bogliotti YS, Cuello C, Morales Valencia M, et al. (2017). Interspecies Chimerism with Mammalian Pluripotent Stem Cells. Cell 168, 473–486.e415. 10.1016/j.cell.2016.12.036. - DOI - PMC - PubMed
    1. Isotani A, Hatayama H, Kaseda K, Ikawa M, and Okabe M (2011). Formation of a thymus from rat ES cells in xenogeneic nude mouse<-->rat ES chimeras. Genes Cells 16, 397–405. 10.1111/j.1365-2443.2011.01495.x. - DOI - PubMed
    1. Kobayashi T, Yamaguchi T, Hamanaka S, Kato-Itoh M, Yamazaki Y, Ibata M, Sato H, Lee YS, Usui J, Knisely AS, et al. (2010). Generation of rat pancreas in mouse by interspecific blastocyst injection of pluripotent stem cells. Cell 142, 787–799. 10.1016/j.cell.2010.07.039. - DOI - PubMed
    1. Zuo E, Cai YJ, Li K, Wei Y, Wang BA, Sun Y, Liu Z, Liu J, Hu X, Wei W, et al. (2017). One-step generation of complete gene knockout mice and monkeys by CRISPR/Cas9-mediated gene editing with multiple sgRNAs. Cell Res 27, 933–945. 10.1038/cr.2017.81. - DOI - PMC - PubMed

Publication types

LinkOut - more resources