. 2024 Apr 25;187(9):2143-2157.e15.
doi: 10.1016/j.cell.2024.03.042.

Functional sensory circuits built from neurons of two species

Affiliations

Functional sensory circuits built from neurons of two species

Benjamin T Throesch et al. Cell. .

Abstract

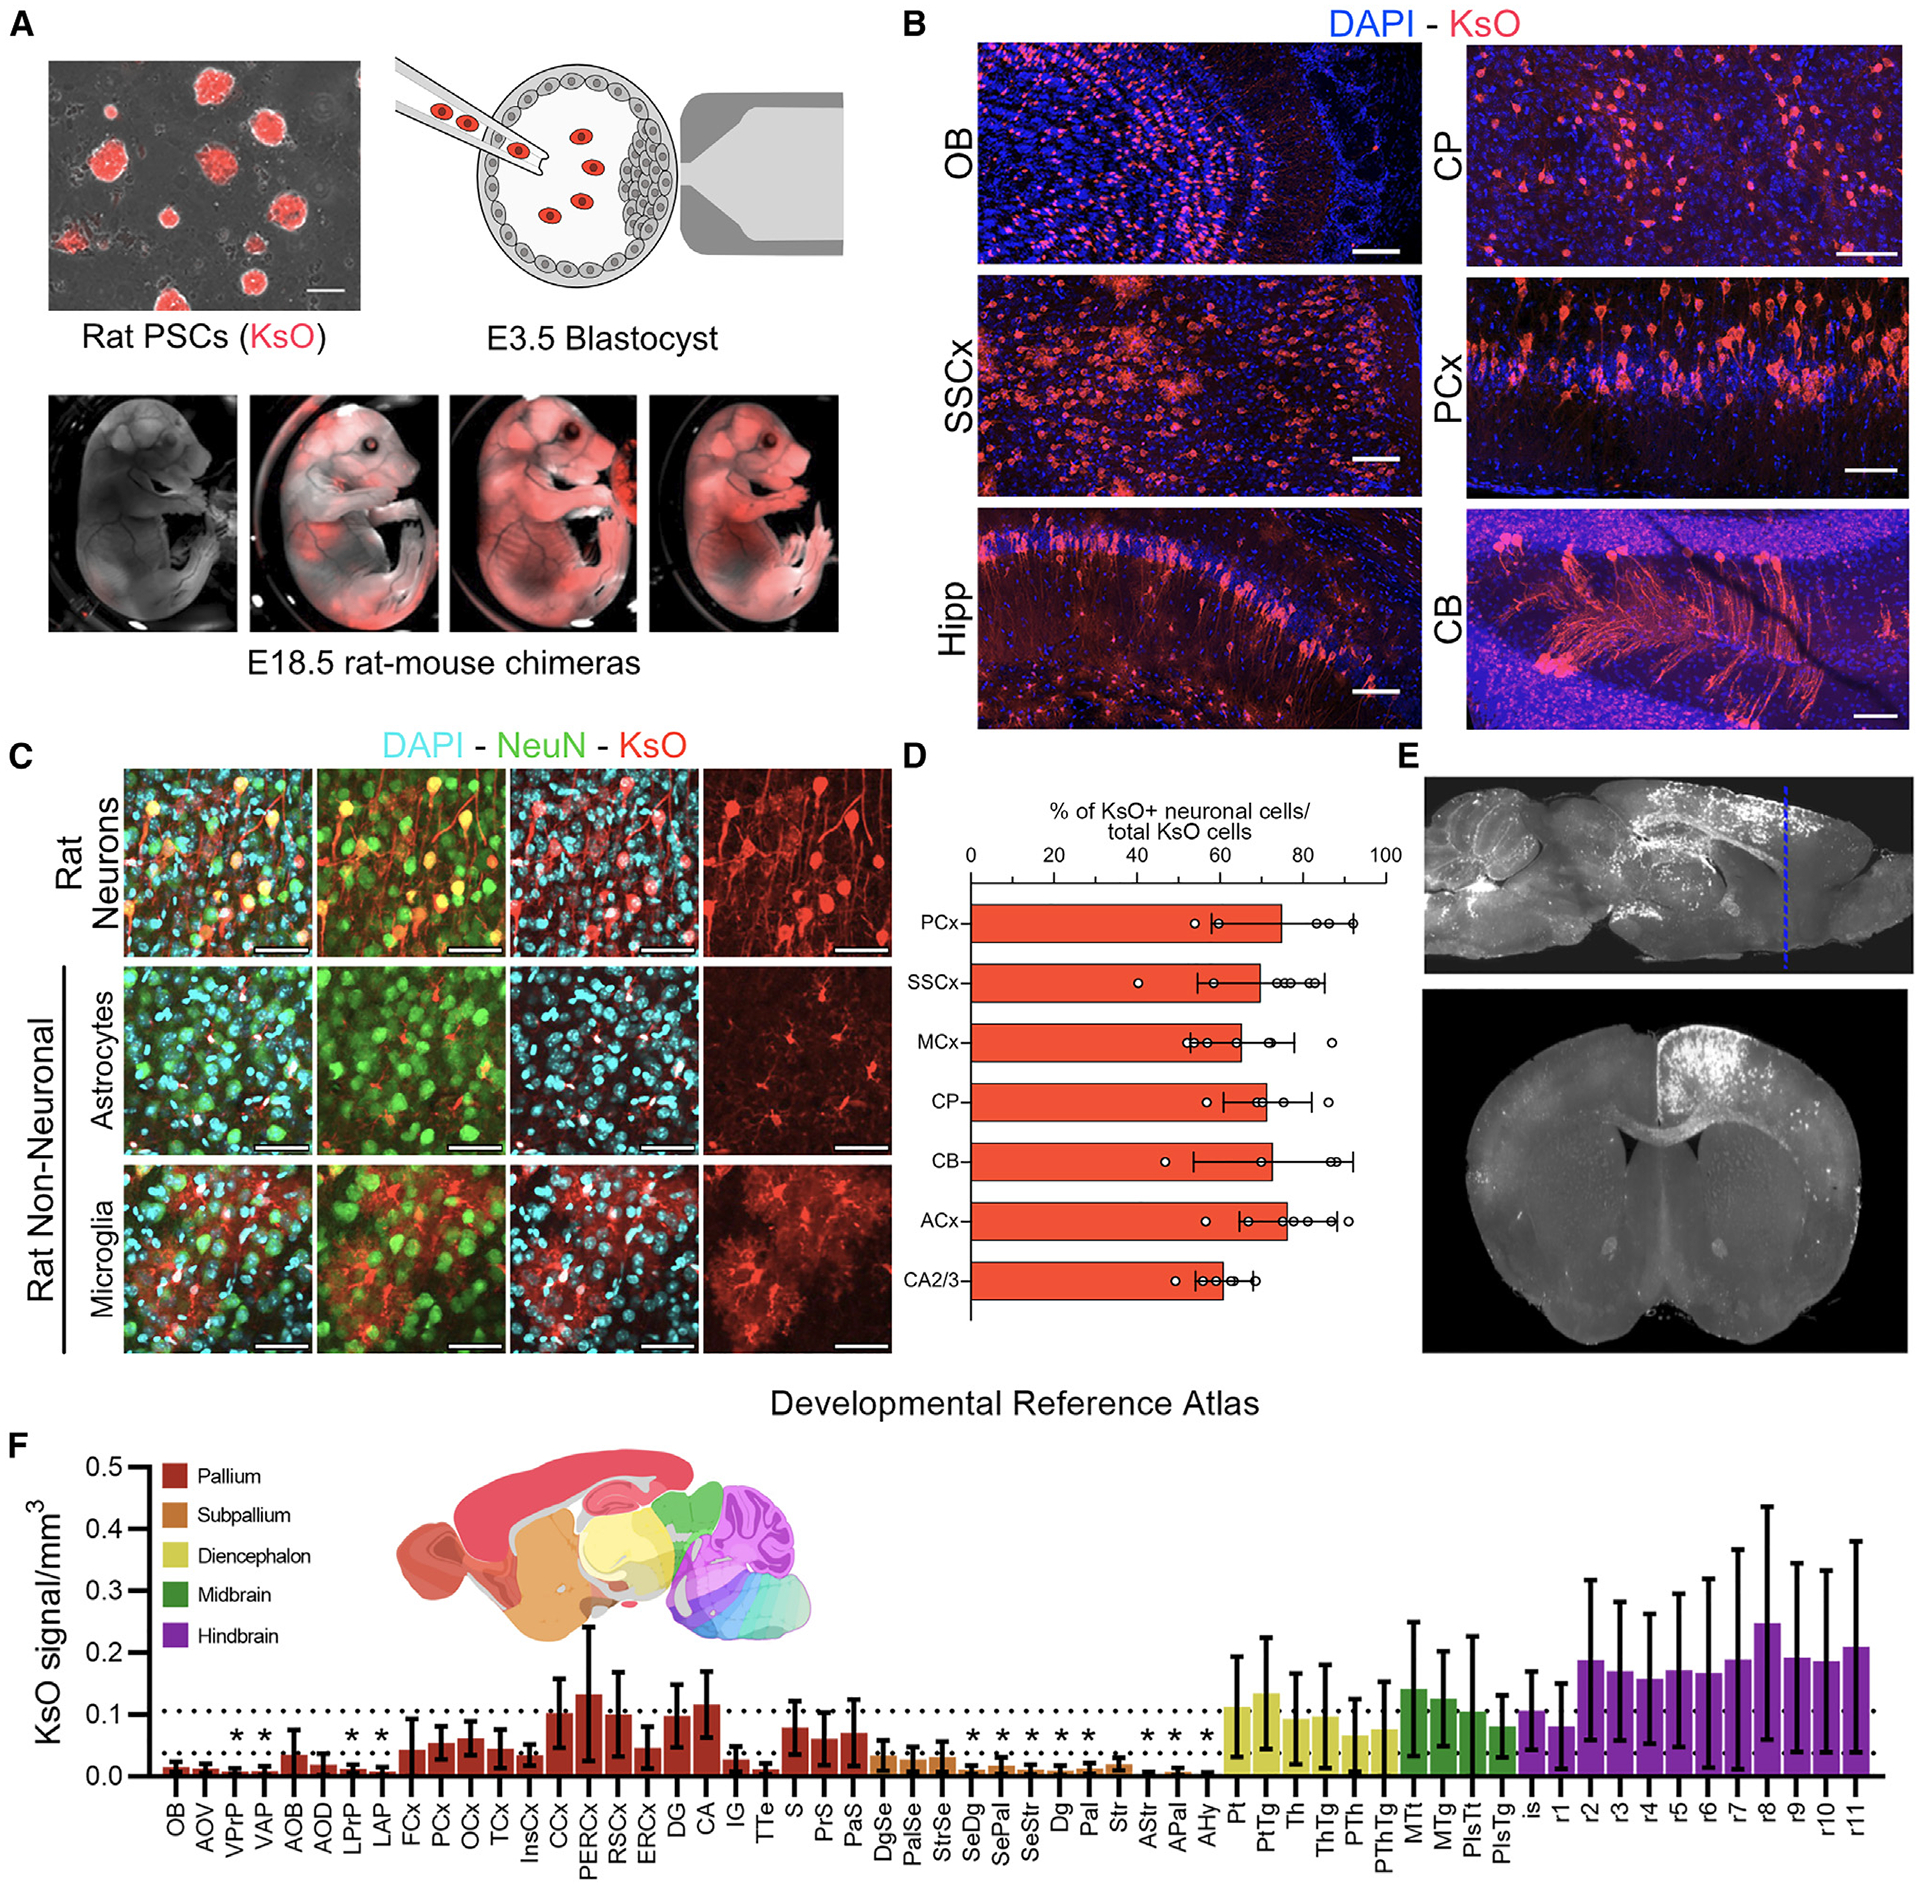
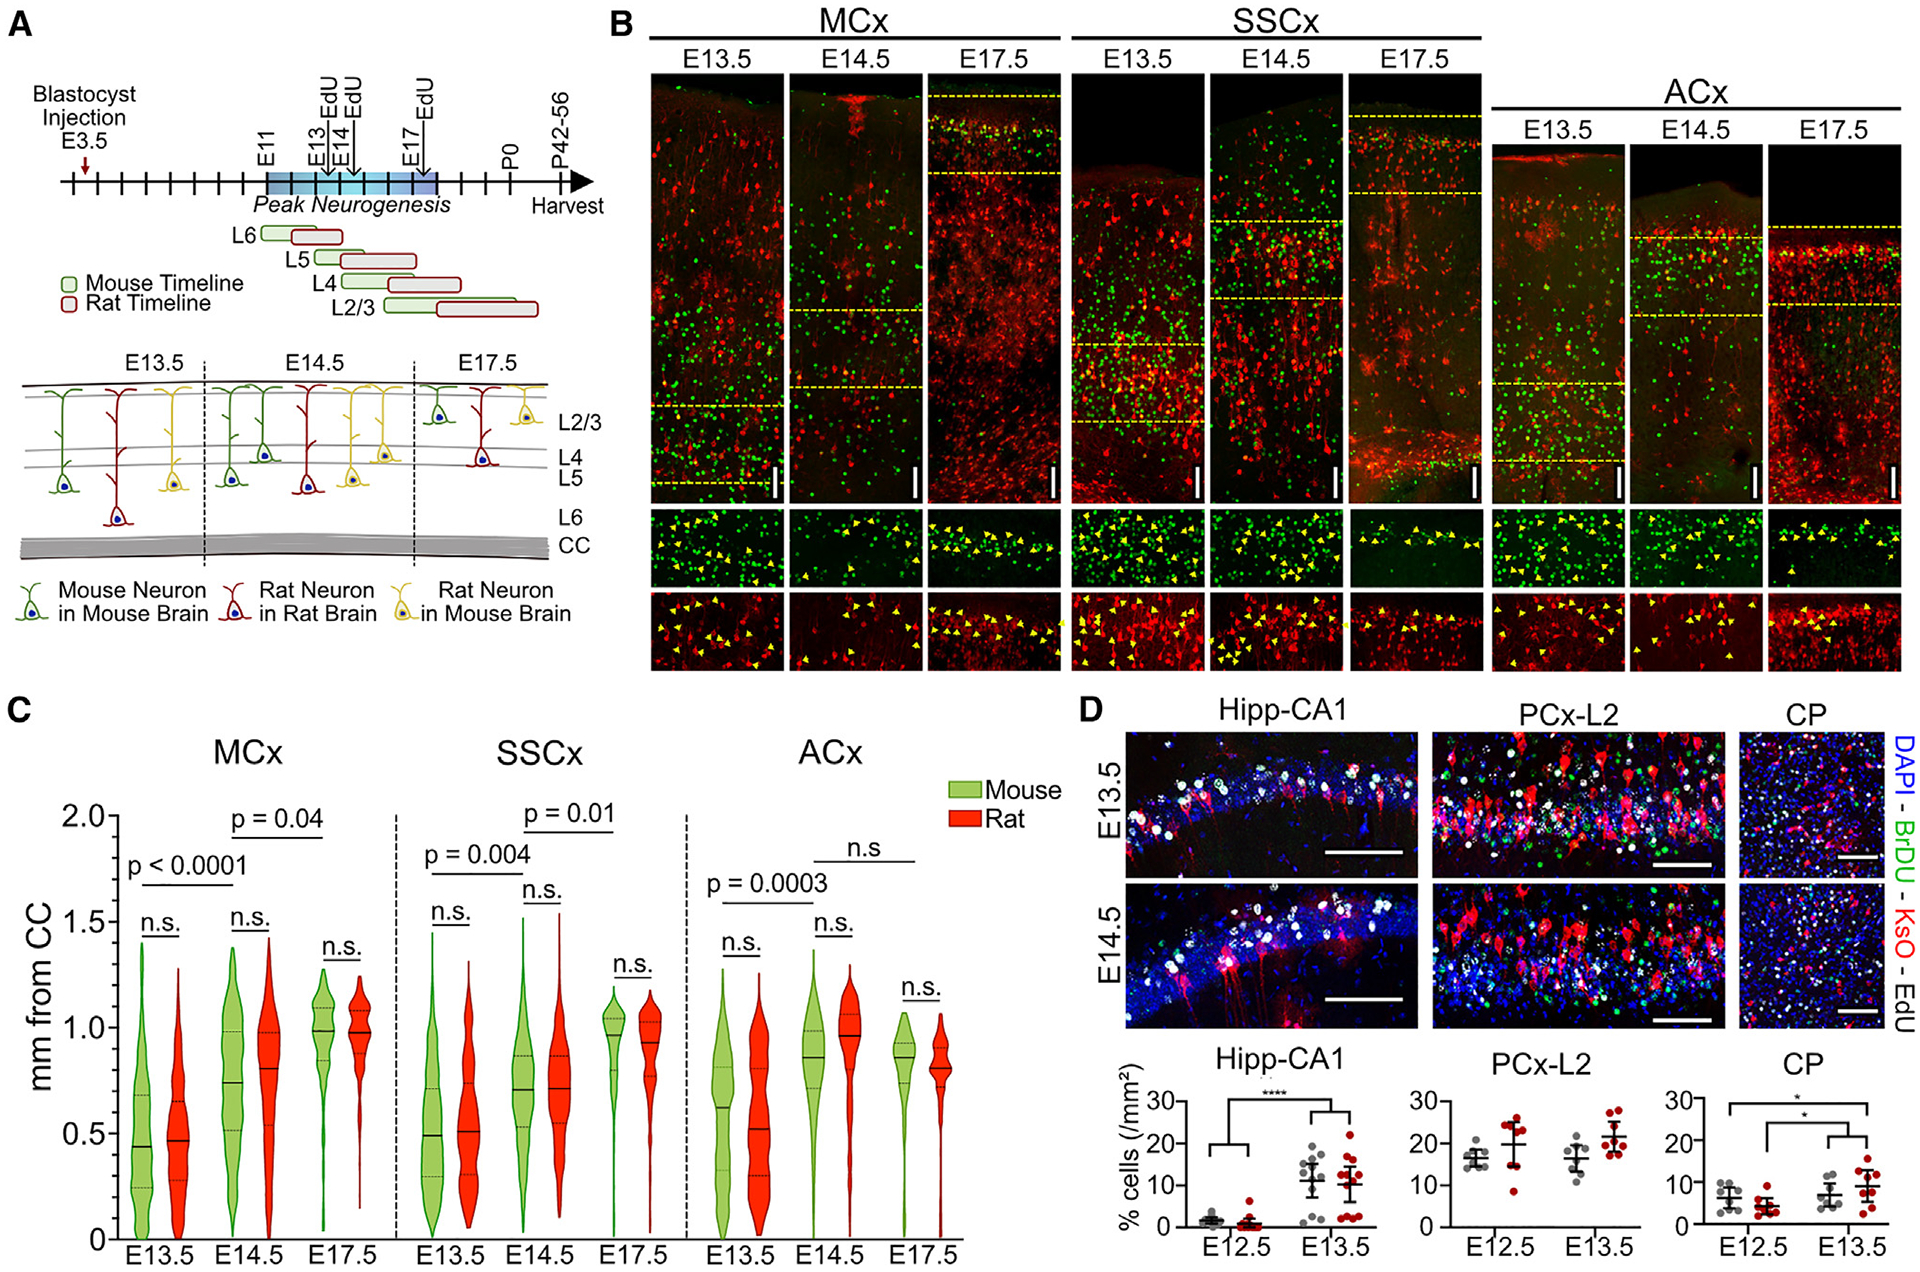
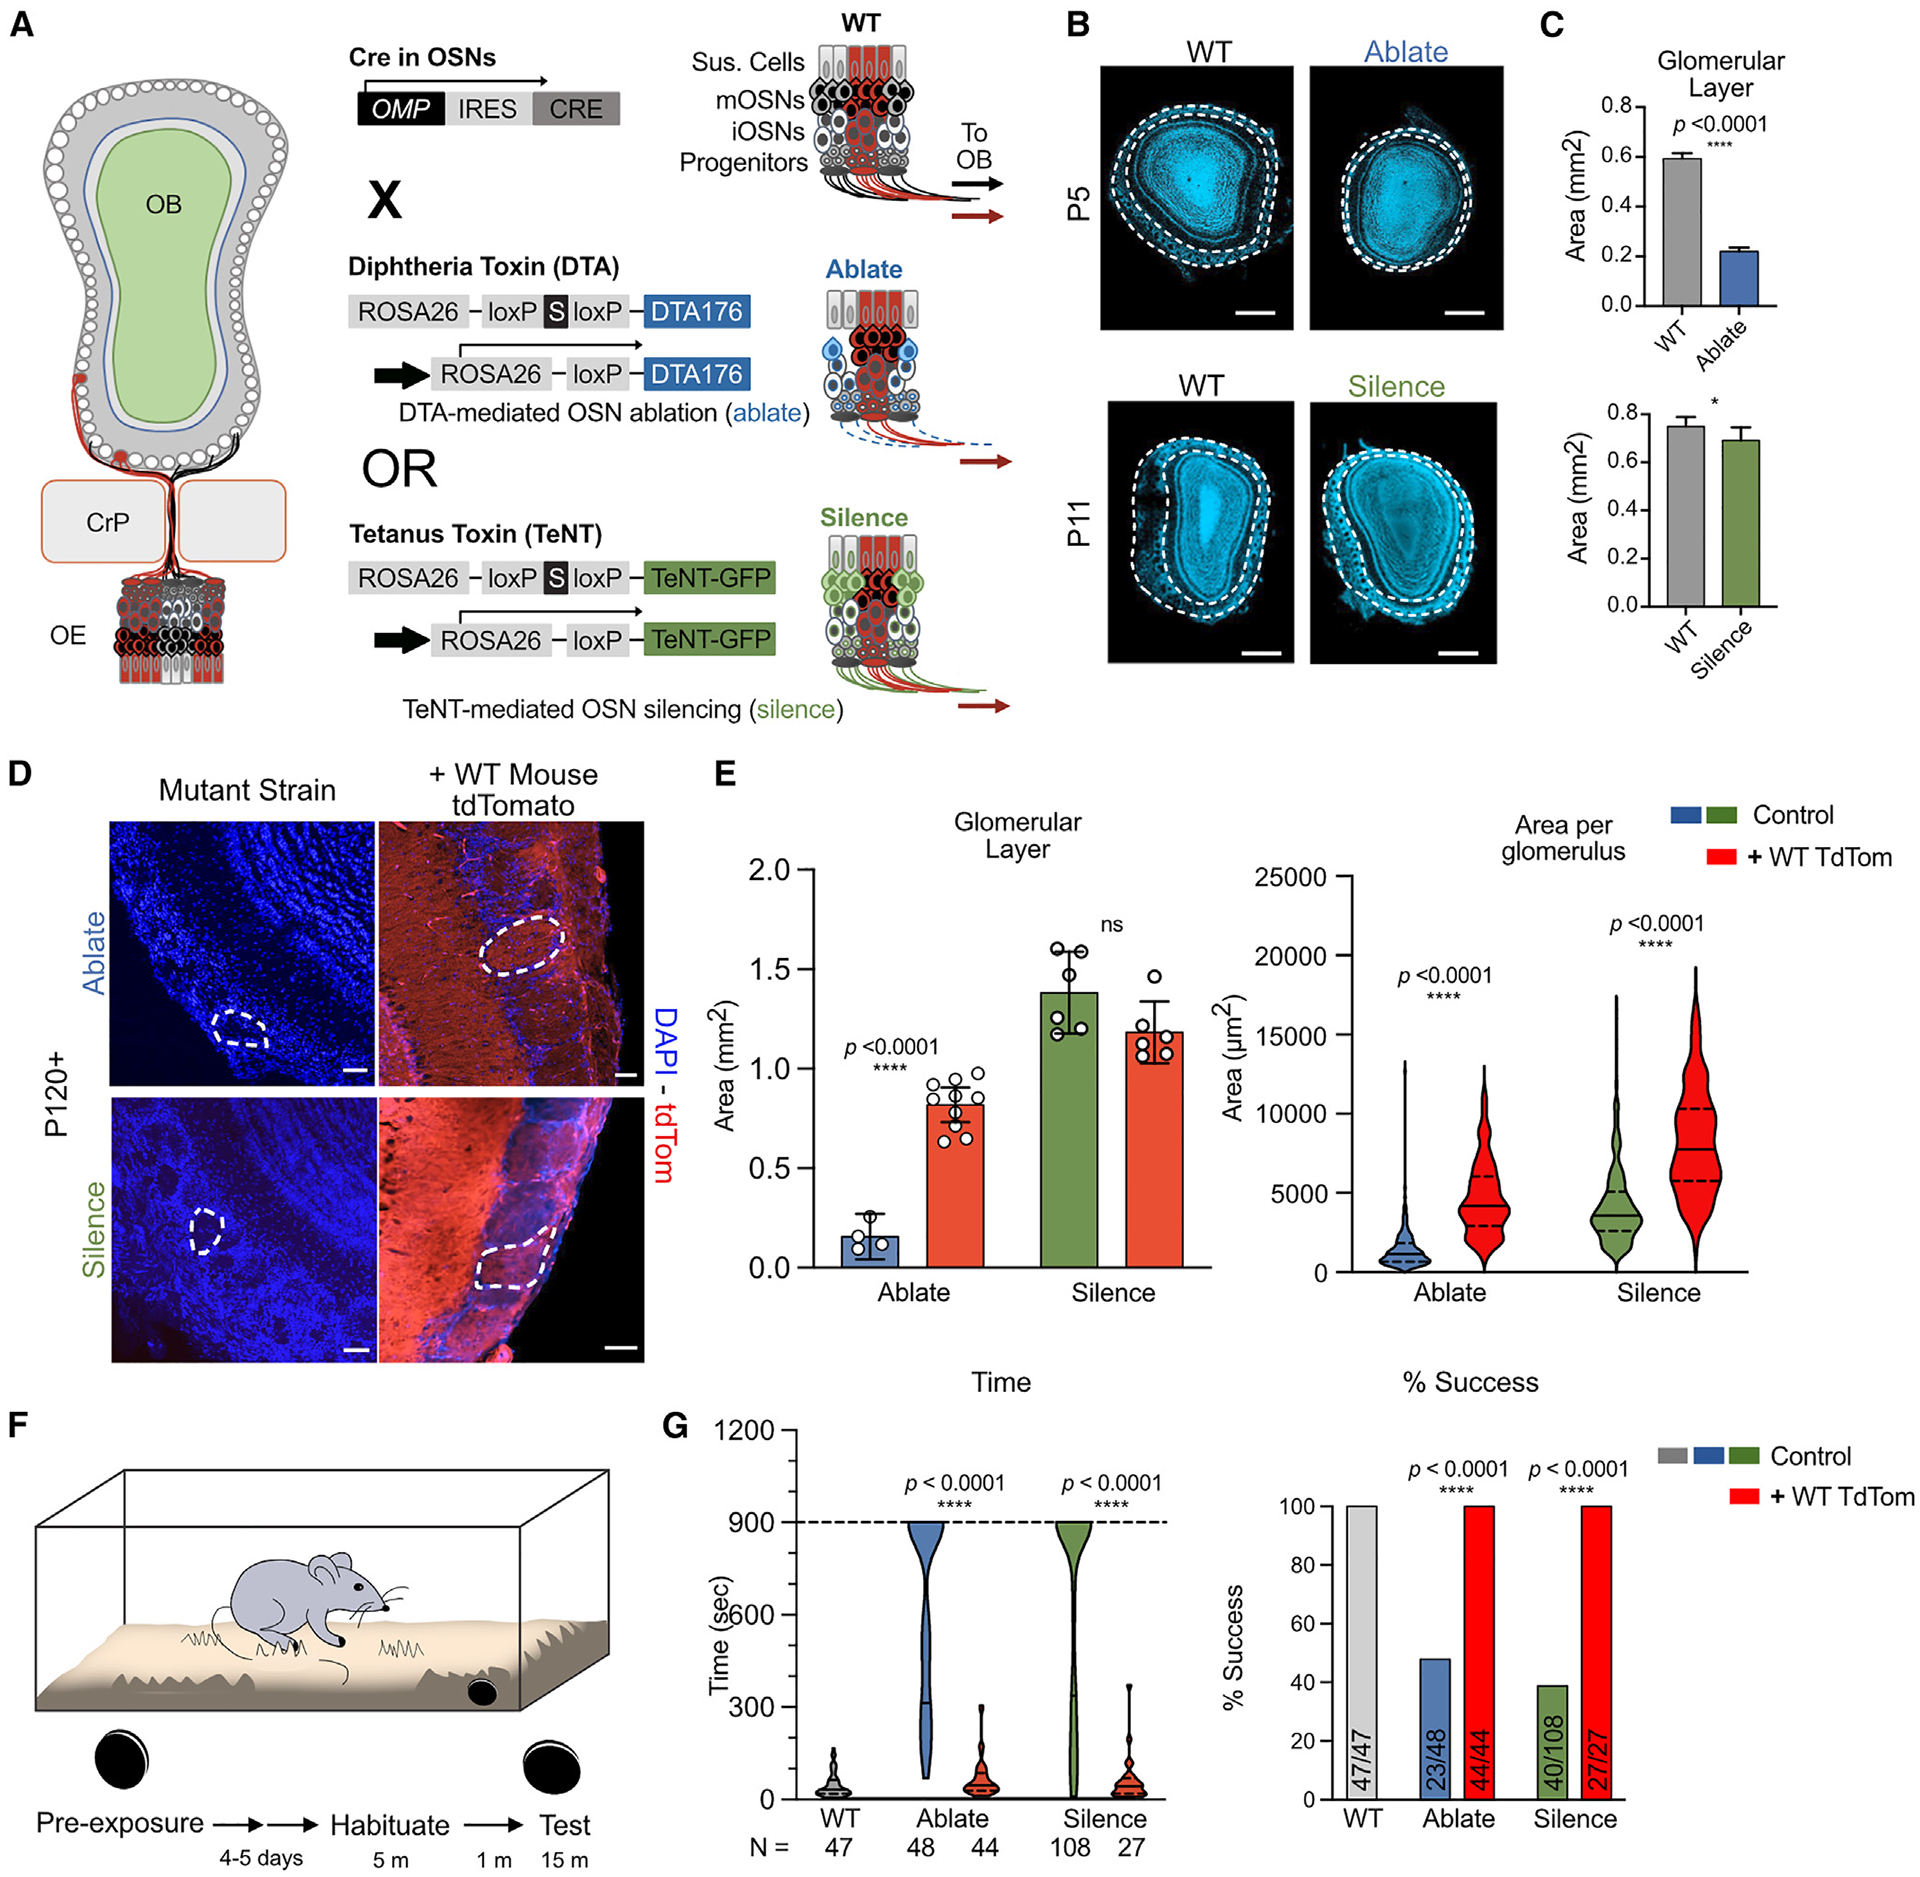
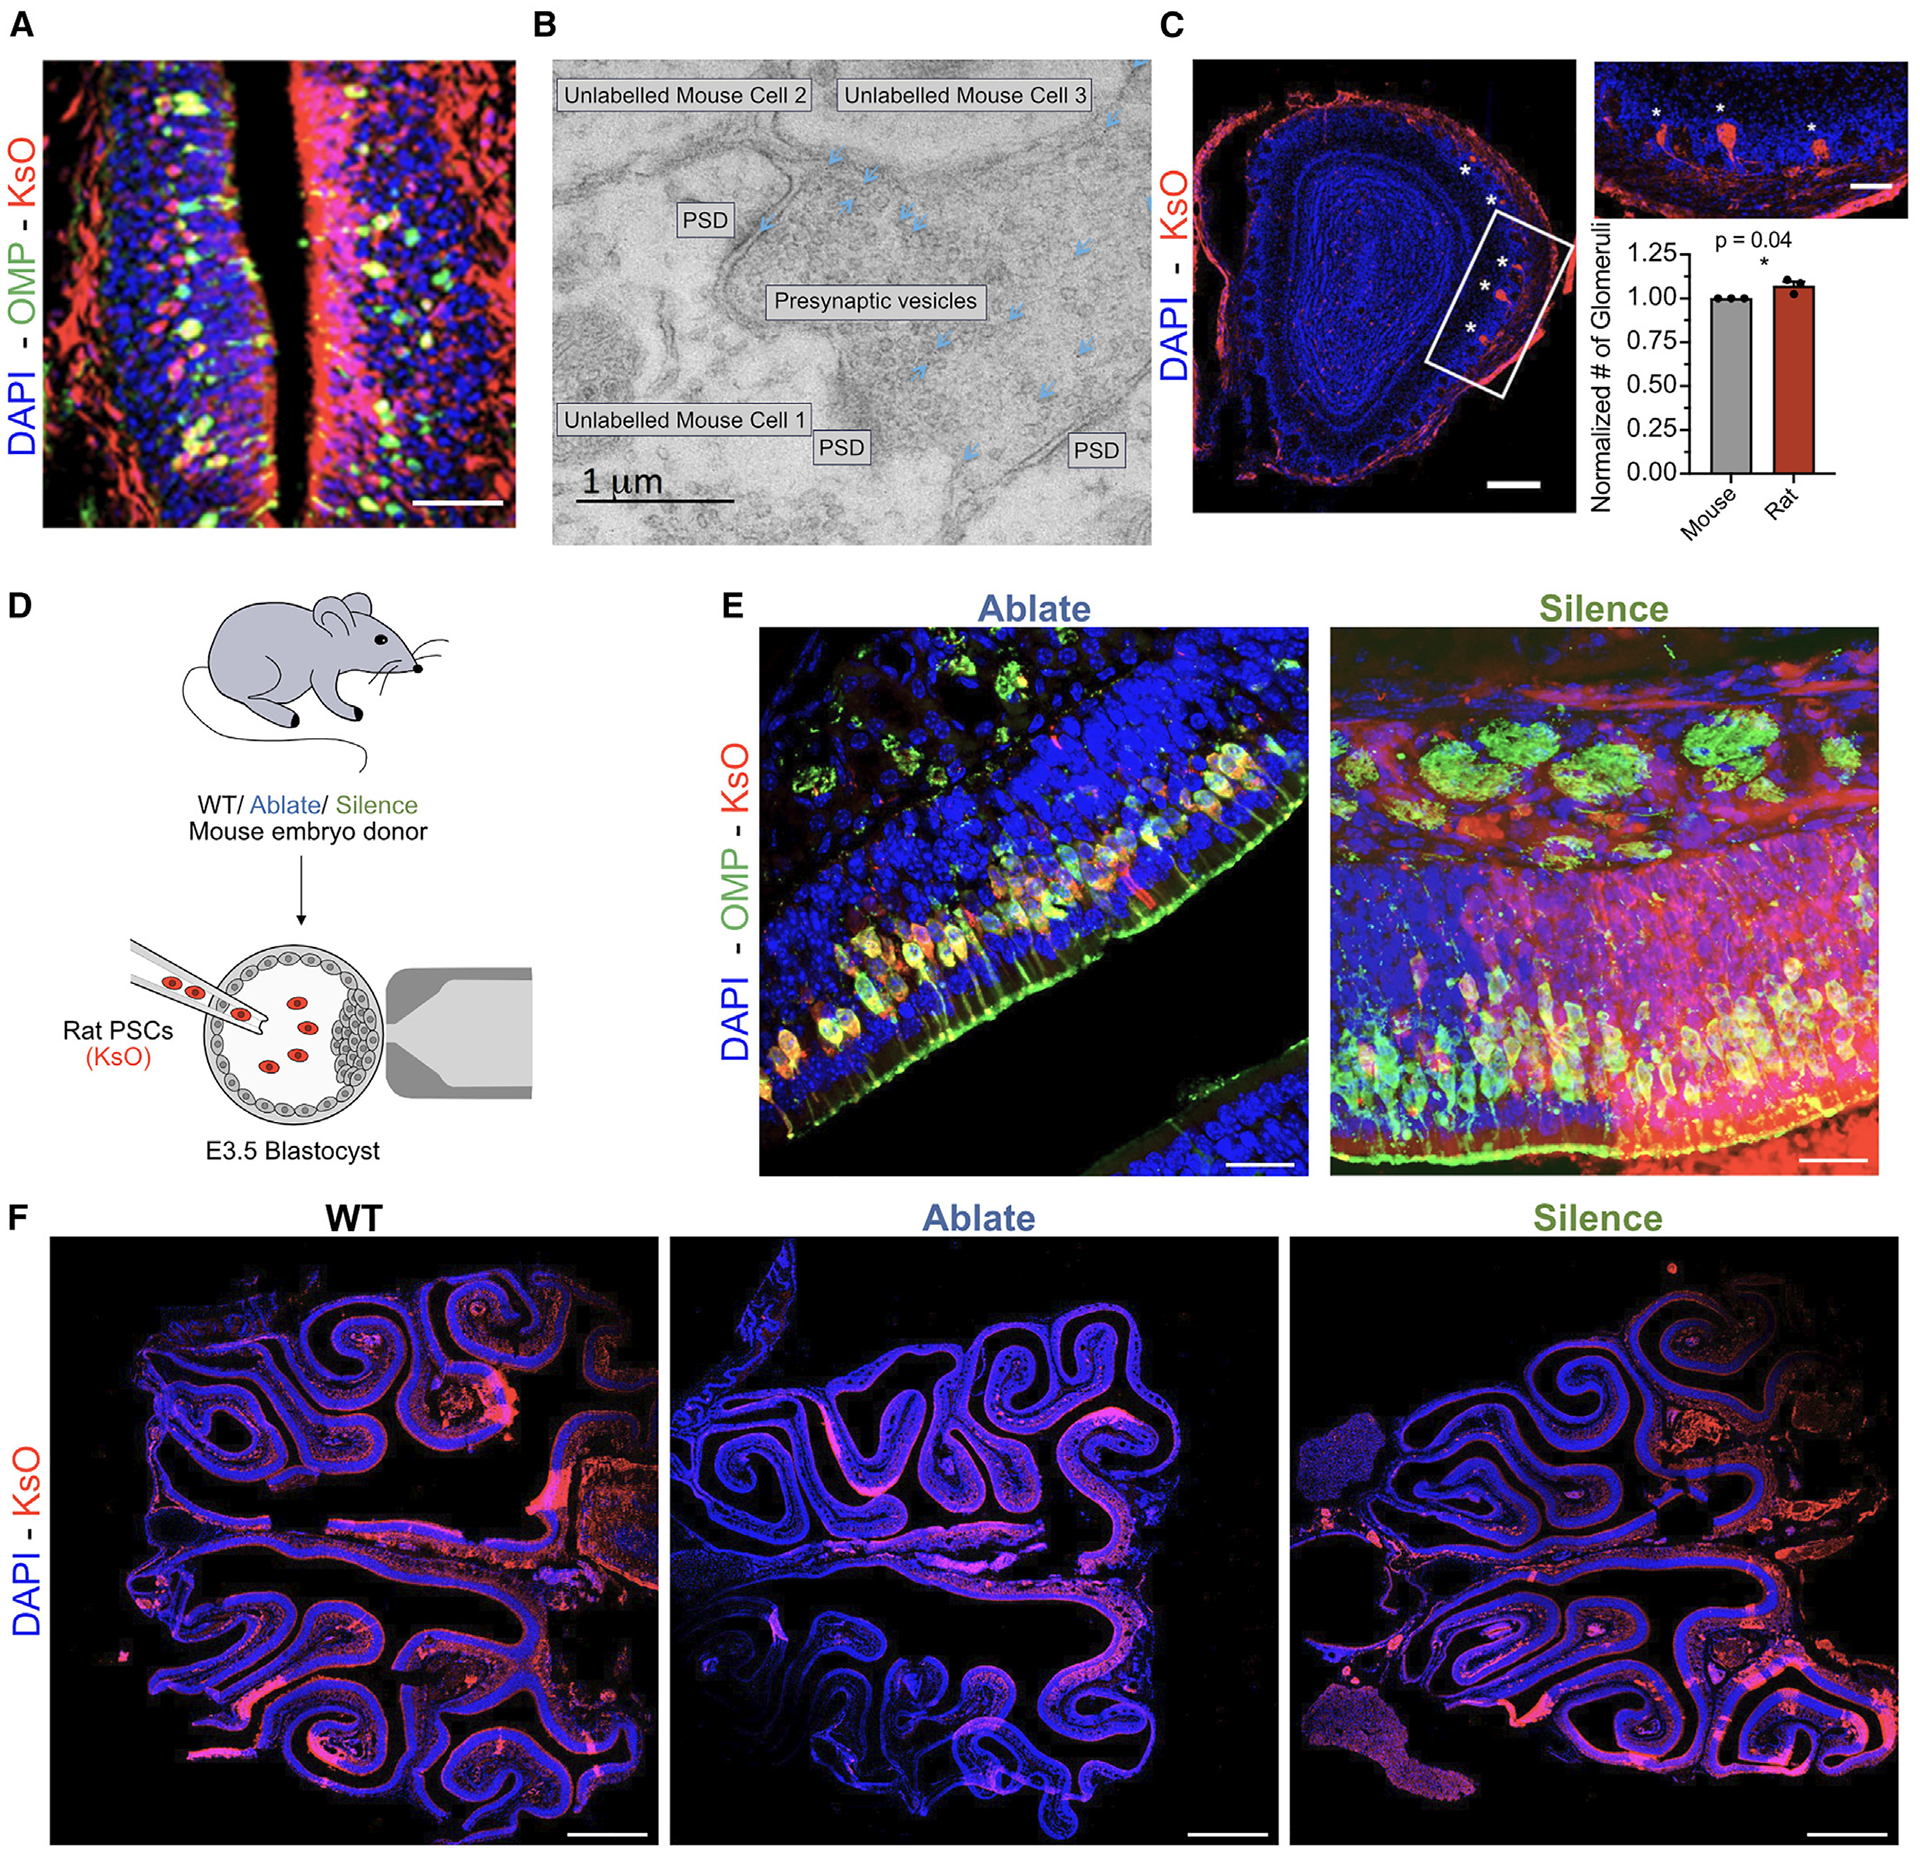
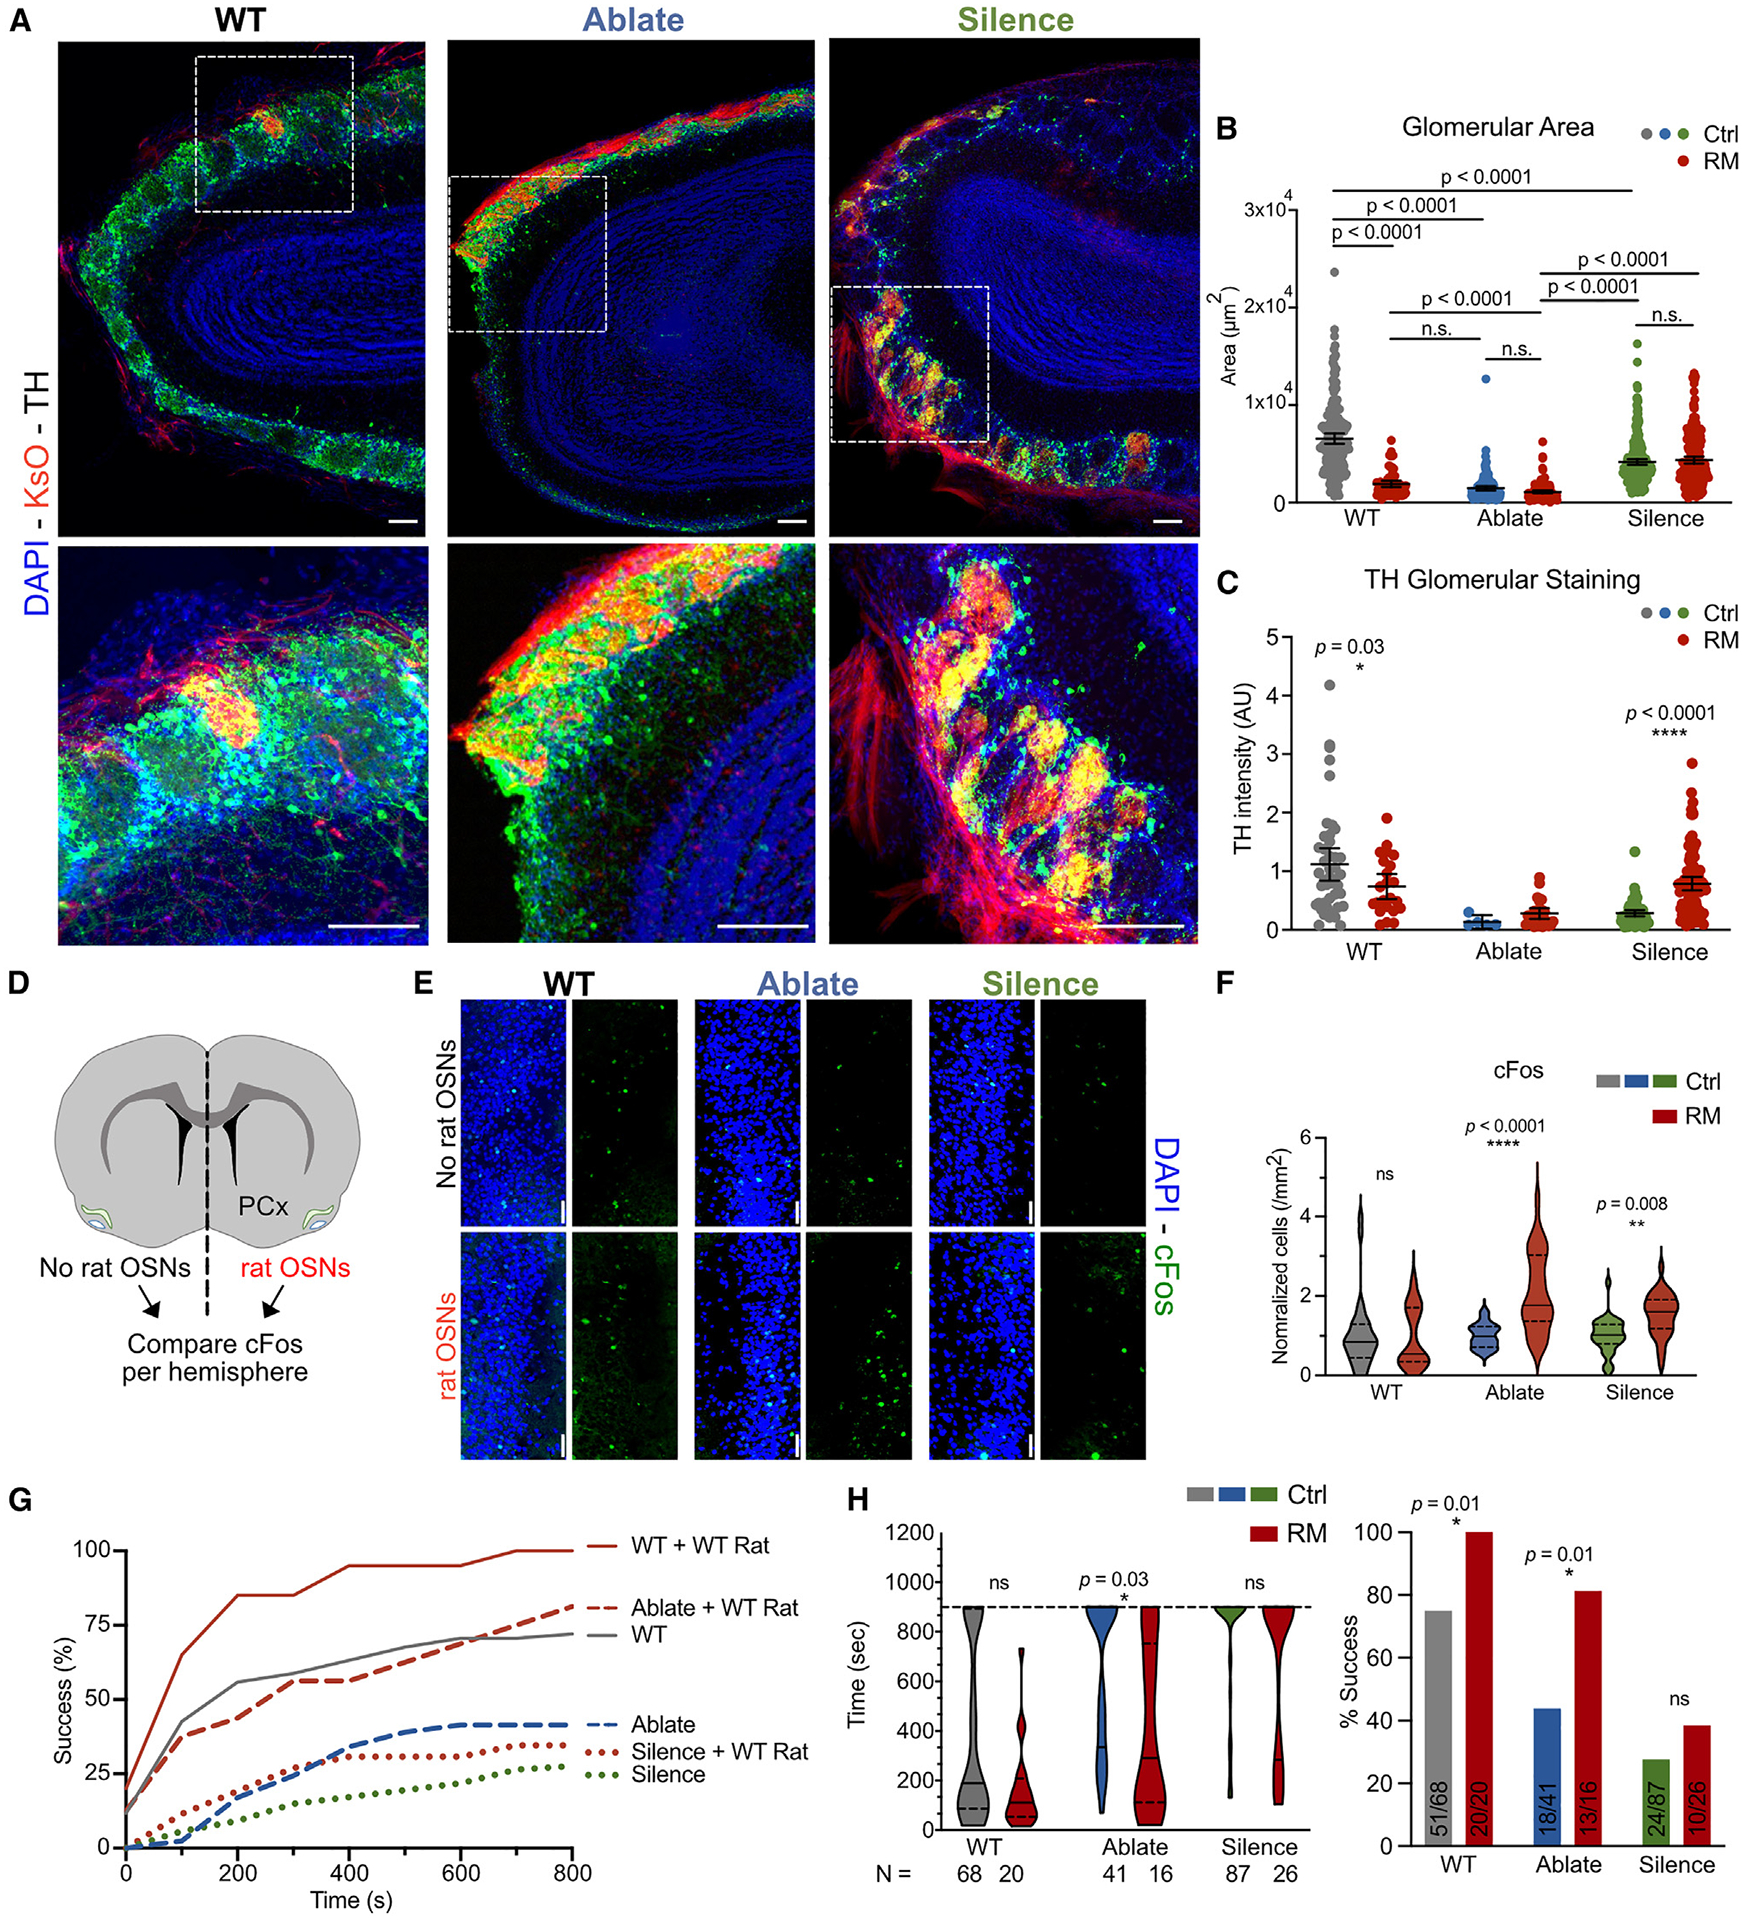
A central question for regenerative neuroscience is whether synthetic neural circuits, such as those built from two species, can function in an intact brain. Here, we apply blastocyst complementation to selectively build and test interspecies neural circuits. Despite approximately 10-20 million years of evolution, and prominent species differences in brain size, rat pluripotent stem cells injected into mouse blastocysts develop and persist throughout the mouse brain. Unexpectedly, the mouse niche reprograms the birth dates of rat neurons in the cortex and hippocampus, supporting rat-mouse synaptic activity. When mouse olfactory neurons are genetically silenced or killed, rat neurons restore information flow to odor processing circuits. Moreover, they rescue the primal behavior of food seeking, although less well than mouse neurons. By revealing that a mouse can sense the world using neurons from another species, we establish neural blastocyst complementation as a powerful tool to identify conserved mechanisms of brain development, plasticity, and repair.

Keywords: blastocyst complementation; brain evolution; brain regeneration; development; disease models; interspecies chimeras; neural circuits; neurons; olfaction; pluripotent stem cells.


Conflict of interest statement

Declaration of interests K.K.B. is on the SAB of Gameto Therapeutics. B.T.T. is a current employee of Janssen Research and Development. P.O. is a founder of Theracast. J.C.I.B is a founding scientist and director of the San Diego Institute of Science, Altos Labs.

Figures

Figure 1.
Figure 1.. Rat cells contribute widely to the mouse brain
(A) Schematic of rat-mouse chimera formation. Rat pluripotent stem cells (PSCs) labeled with KsO (red) were injected into E3.5 mouse blastocysts. Derived E18.5 fetuses displayed variable KsO contribution. (B) Rat contribution to diverse neural circuits; nuclei (DAPI, blue) and rat KsO cells (red). OB, olfactory bulb; PCx, piriform cortex; SSCx, somatosensory cortex; CP, caudoputamen; Hipp, hippocampus; CB, cerebellum. Scale bars, 100 μm. (C) Rat contribution to neuronal and non-neuronal cell populations; nuclei (DAPI [cyan]), neurons, NeuN (green), and rat KsO (red). Scale bars, 50 μm. (D) Quantification of rat contribution. Shown are the mean ± 95% CI. Animals analyzed per brain region; PCx = 5, SSCx = 7, MCx = 7, CP = 5, CB = 4, ACx = 7, and CA2/3 = 7. (E) Whole-brain imaging of high-contribution chimeric brains (KsO, white). (F) Volumetric analysis based on the Allen Developing Mouse Brain Reference Atlas. Results of 12 hemispheres from 6 independent brain samples are shown, mean ± 95% CI. Dashed lines indicate the 95% CI for the mean hemisphere signal. Significance was tested by repeated measures one-way ANOVA with Dunnett’s multiple comparisons test to the mean hemisphere signal, *p < 0.05, **p < 0.01. See also Figure S1.
Figure 2.
Figure 2.. Development of rat cells within mouse neural circuits
(A) Schematic of birth-dating experiments. Surrogate mothers were injected with BrdU at E12.5 and with EdU at E13.5, E14.5, or E17.5 to label different populations of neurons in chimeric embryos during peak mouse neurogenesis. Rat neurons could either maintain their developmental timeline (red neurons) or reprogram their timeline to that of the mouse cells (yellow, matching mouse in green). (B) EdU labeling at E13.5, E14.5, and E17.5 in 3 cortical regions, motor (MCx), somatosensory (SSCx), and auditory cortex (ACx). Rat KsO cells (red) and EdU-labeled cells (green). Scale bars, 100 μm. (C) Distance of each cell from the border between the cortex and the corpus callosum (CC). Data shown are the median and the upper and lower quartiles for each time point and cortical region. Statistical tests comparing mouse and rat distances were multiple paired t tests, corrected by the Sídák method. Animals per time point: E13.5 = 3, E14.5 = 4, and E17.5 = 1. Number of sections: MCx E13.5 = 9, MCx E14.5 = 12, MCx E17.5 = 7, SSCx E13.5 = 9, SSCx E14.5 = 12, SSCx E17.5 = 10, ACx E13.5 = 9, ACx E14.5 = 12, and ACx E17.5 = 9. Number of cells per section = MCx, 2,138 cells (E13.5-mouse), 498 (E13.5-rat), 2,961 (E14.5-mouse), 387 (E14.5-rat), 524 (E17.5-mouse), and 376 (E17.5-rat); SSCx, 3,600 (E13.5-mouse), 644 (E13.5-rat), 5,220 (E14.5-mouse), 1,072 (E14.5-rat), 1,811 (E17.5-mouse), and 709 (E17.5-rat); ACx, 2,879 (E13.5-mouse), 673 (E13.5-rat), 3,568 (E14.5-mouse), 506 (E14.5-rat), 717 (E17.5-mouse), and 222 (E17.5-rat). p values = ACx E13.5, p = 0.15; ACx E14.5, p = 0.62; ACx E17.5, p > 0.99; MCx E13.5, p > 0.99; MCx E14.5, p > 0.99; MCx E17.5, p > 0.99; SSCx E13.5, p = 0.13; SSCx E14.5, p = 0.58; and MCx E17.5, p = 0.65. Significance tests comparing mouse distances across time points were performed using one-way ANOVA, corrected by the Šídák method. (D) Rat temporal development is reprogrammed in mouse non-cortical regions. Top: BrdU (labeled E12.5) and EdU (labeled E13.5 or E14.5) staining in CA1 hippocampus (Hipp-CA1), layer 2 piriform cortex (PCx-L2), caudoputamen (CP). Nuclei (DAPI, blue), BrdU (green), rat KsO cells (red), and EdU (white). Scale bars, 100 mm. Bottom: data are mean ± 95% CI, n = 3–4 animals, 3 slices/animal. Significance was tested by two-way ANOVA and Šídák’s multiple comparisons test, *p < 0.05, **p < 0.01, ***p < 0.001, and ****p < 0.0001. See also Figure S2.
Figure 3.
Figure 3.. Rat neurons form functional synaptic connections with mouse neurons
(A) Schematic of rat iPSC reprogramming and ChR2-eYFP insertion. REF, rat embryonic fibroblast; riPSC, rat induced pluripotent stem cell; MEF, mouse embryonic fibroblast. (B) Acute transverse slice images from 2- to 4-week-old chimera brains. Mouse cells were eYFP negative. (C) Evoked EPSPs in a mouse neuron upon stimulation of rat neurons with blue light. Glutamate receptor antagonists (CPP, NBQX) abolished light-evoked depolarizations. Blue triangles mark blue light stimulation. Traces are an average of 20 trials. Scale bar is 2 mV, 50 ms. (D) Recordings from rat neuron (YFP positive) upon light activation. Traces are an average of 20 trials. Scale bar is 2 mV, 50 ms. (E) Peak EPSP amplitude ± glutamate receptor antagonist for rat (green) and mouse (gray) (left). EPSP amplitude vs. time of onset of the signal. Rat (green) and mouse (gray); cortex (cross) and hippocampus (circle) (right). n = 10 YFP− mouse cells, 1 YFP+ rat cell, 7 animals. Significance for mouse cells tested by two-tailed, paired t test. **p < 0.01. See also Figure S3.
Figure 4.
Figure 4.. Genetic disability models and mouse-mouse olfactory complementation
(A) Schematic of genetic strategies: crossing OMP-Cre mice with floxed DTA and TeNT animals to Ablate (DTA) or Silence (TeNT) mouse OSNs. (B) Olfactory bulb (OB) from wild-type (WT) and Ablate mice at P5 (top) and OBs in WT vs. Silence P11 (bottom) (nuclei in blue, DAPI). Dotted lines encircle the glomerular layer. Scale bars, 500 μm. (C) Glomerular layer size is reduced in both models. Data are mean ± 95% CI; WT n = 9; Silence, n = 6 (top); WT, n = 15; and Ablate, n = 11 (bottom). Significance tested by two-tailed, unpaired t test, *p < 0.05, ****p < 0.0001. (D) Red mouse PSCs expressing tdTomato rescue OB deficits in both models. Ablate and Silence mutant strains (left) and mouse (tdTomato WT) chimeric rescue (right); DAPI (blue) and tdTomato (red). Scale bars, 50 μm. (E) Glomerular layer size (bar graph, left) and individual glomerulus size (violin plot, right). For glomerular layer, data shown are means ± 95% CI; Silence (control), n = 6 and +WT TdTom, n = 6; Ablate (control), n = 4 and +WT TdTom, n = 10. p values shown are two-tailed unpaired t test. ****p < 0.0001. For individual glomerular size, violin plots with the median, upper, and lower quartiles are plotted; Silence(control), n = 260 glomeruli and +WT TdTom, n = 134 glomeruli; Ablate (control), n = 141 glomeruli and +WT TdTom, n = 260 glomeruli. Significance was tested by two-tailed unpaired t test, ****p < 0.0001. (F) Schematic of the buried cookie (round black and white object) test. (G) WT Mouse PSCs rescue behavior in both models. For time, violin plots with the median and the upper and lower quartile are shown. WT, n = 47. Ablate (non-chimera), n = 7; Ablate (+WT TdTom), n = 44. Silence (non-chimera), n = 27; Silence (+WT TdTom), n = 27. Significance was tested by repeated measures one-way ANOVA with Dunn’s multiple comparisons test. For percent success, the test was deemed successful if the cookie was found under 900 s. For the Ablate nonchimeras, 5/7 were successful while 44/44 were rescued by WT mouse chimerism. For the Silence model, 27/27 non-chimeras were successful. Significance tested by Fisher’s exact test. See also Figure S4.
Figure 5.
Figure 5.. Rat-mouse anatomic complementation
(A) OMP-positive rat OSNs in a rat-mouse chimera, nuclei (DAPI, blue), OMP (green), and rat KsO (red). Scale bars, 100 mm. (B) Transmission electron microscopy on rat-mouse chimeric synapses labeled with immunogold staining against KsO as indicated by dark densities marked by blue arrows. Synapses between rat and mouse cells with presynaptic vesicles and postsynaptic densities (PSD) labeled. (C) OB section shows glomeruli with majority rat cells or no rat cells in a P10 rat-mouse chimera; rat KsO (red) and nuclei (DAPI, blue). Asterisks mark rat glomeruli. White box is inset. Scale bars, 250 and 100 μm (inset). Total number of glomeruli in animals with unilateral rat OSN contribution (right), normalized to the hemisphere without rat glomeruli. Mean ± 95% CI, n = 3 animals, 32 slices/animal. Significance tested by a two-tailed unpaired t test, *p = 0.0412. (D) Schematic of rat PSCs expressing KsO injected into mouse embryos. (E) Olfactory epithelium (OE) in chimeric rat rescue of Ablate (left) or Silence (right) mouse blastocyst; nuclei (DAPI, blue), rat (KsO, red), and OMP (green). Scale bars, 25 μm. (F) OE from rat mouse chimeras in labeled mouse background; nuclei (DAPI, blue) and rat (KsO, red). Scale bars, 500 μm. See also Figure S5.
Figure 6.
Figure 6.. Rat neurons rescue synaptic communication and behavior in anosmic mice
(A) Rat and mouse glomeruli stained for tyrosine hydroxylase (TH, green), nuclei (DAPI, blue), and rat KsO (red). Scale bars, 100 μm. (B) Glomerulus size across models. Scatterplots with mean ± 95% CI; n = 3–4 animals/genotype, 2–3 slices/animal, 191 glomeruli (WT-mouse), 68 (WT mouse-rat chimera), 141 (Ablate-mouse), 145 (Ablate mouse-rat chimera), 260 (Silence-mouse), and 232 (Silence mouse-rat chimera). Significance tested by 2-way ANOVA followed by Tukey’s multiple comparisons test. ****p < 0.0001, **p < 0.01. (C) Rat OSNs rescue TH only in the Silence model. Scatterplots with mean ± 95% CI; n = 1 animal/genotype, 3 slices/animal, 44 glomeruli (WT-mouse), 23 (WT mouse-rat chimera), 5 (Ablate-mouse), 25 (Ablate mouse-rat chimera), 60 (Silence-mouse), and 95 (Silence mouse-rat chimera). Significance by two-way ANOVA and Sídák’s multiple comparisons test. *p < 0.0248, ****p < 0.0001. (D) A schematic illustrating unilateral rat contribution internal comparison for c-Fos in the piriform cortex (PCx). (E) c-Fos staining in left and right hemisphere PCx of animals with unilateral rat OSNs; nuclei (DAPI, blue) and c-Fos (green). Scale bars, 50 μm. (F) Rat OSN contribution increases c-Fos expression in the ipsilateral PCx. Cell densities were normalized to the mean density in the no contribution hemisphere for each animal. Violin plots with the median and upper and lower quartiles are shown; n = 2 animal/genotype, 15 slices/animal. Significance tested by two-way ANOVA followed by Sídák’s multiple comparisons test, **p < 0.01, ****p < 0.0001. (G) WT rat PSCs rescue behavior in the Ablate model. Cumulative cookie-finding success of chimeras per second (s). (H) (Left) Rat contribution rescues time to find the cookie in Ablate models, shown as violin plots with median and the upper and lower quartile. WT, n =68; WT (rat-mouse chimeras), n = 20; Ablate (control), n = 41; Ablate (rat-mouse chimeras), n = 16; Silence (control), n = 87, Silence (rat-mouse chimeras), n = 26. Significance tested by repeated measures one-way ANOVA with Dunn’s multiple comparisons test (left panel). Significance was tested by Fisher’s exact test, *p < 0.05 with exact p values listed (right panel). See also Figure S6.

References

    1. Isotani A, Hatayama H, Kaseda K, Ikawa M, and Okabe M (2011). Formation of a thymus from rat ES cells in xenogeneic nude mouse↔rat ES chimeras. Genes Cells 16, 397–405. 10.1111/j.1365-2443.2011.01495.x. - DOI - PubMed
    1. Isotani A, Yamagata K, Okabe M, and Ikawa M (2016). Generation of Hprt-disrupted rat through mouse←rat ES chimeras. Sci. Rep 6, 24215. 10.1038/srep24215. - DOI - PMC - PubMed
    1. Wu J, Platero-Luengo A, Sakurai M, Sugawara A, Gil MA, Yamauchi T, Suzuki K, Bogliotti YS, Cuello C, Morales Valencia M, et al. (2017). Interspecies Chimerism with Mammalian Pluripotent Stem Cells. Cell 168, 473–486.e15. 10.1016/j.cell.2016.12.036. - DOI - PMC - PubMed
    1. Xiang AP, Mao FF, Li WQ, Park D, Ma BF, Wang T, Vallender TW, Vallender EJ, Zhang L, Lee J, et al. (2008). Extensive contribution of embryonic stem cells to the development of an evolutionarily divergent host. Hum. Mol. Genet 17, 27–37. 10.1093/hmg/ddm282. - DOI - PubMed
    1. Yamaguchi T, Sato H, Kato-Itoh M, Goto T, Hara H, Sanbo M, Mizuno N, Kobayashi T, Yanagida A, Umino A, et al. (2017). Interspecies organogenesis generates autologous functional islets. Nature 542, 191–196. 10.1038/nature21070. - DOI - PubMed

Publication types

LinkOut - more resources